
ABSTRACT
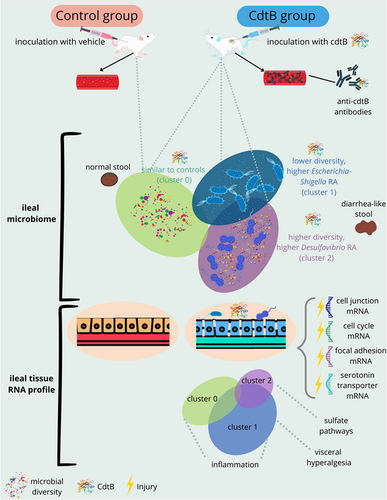
Diarrhea-predominant irritable bowel syndrome (IBS-D), associated with increased intestinal permeability, inflammation, and small intestinal bacterial overgrowth, can be triggered by acute gastroenteritis. Cytolethal distending toxin B (CdtB) is produced by gastroenteritis-causing pathogens and may underlie IBS-D development, through molecular mimicry with vinculin. Here, we examine the effects of exposure to CdtB alone on gut microbiome composition, host intestinal gene expression, and IBS-D-like phenotypes in a rat model. CdtB-inoculated rats exhibited increased anti-CdtB levels, which correlated with increased stool wet weights, pro-inflammatory cytokines (TNFα, IL2) and predicted microbial metabolic pathways including inflammatory responses, TNF responses, and diarrhea. Three distinct ileal microbiome profiles (microtypes) were identified in CdtB-inoculated rats. The first microtype (most like controls) had altered relative abundance (RA) of genera Bifidobacterium, Lactococcus, and Rothia. The second had lower microbial diversity, higher Escherichia-Shigella RA, higher absolute E. coli abundance, and altered host ileal tissue expression of immune-response and TNF-response genes compared to controls. The third microtype had higher microbial diversity, higher RA of hydrogen sulfide (H2S)-producer Desulfovibrio, and increased expression of H2S-associated pain/serotonin response genes. All CdtB-inoculated rats exhibited decreased ileal expression of cell junction component mRNAs, including vinculin-associated proteins. Significantly, cluster-specific microRNA-mRNA interactions controlling intestinal permeability, visceral hypersensitivity/pain, and gastrointestinal motility genes, including several previously associated with IBS were seen. These findings demonstrate that exposure to CdtB toxin alone results in IBS-like phenotypes including inflammation and diarrhea-like stool, decreased expression of intestinal barrier components, and altered ileal microtypes that influenced changes in microRNA-modulated gene expression and predicted metabolic pathways consistent with specific IBS-D symptoms.
GRAPHICAL ABSTRACT
Introduction
Irritable bowel syndrome (IBS) is a chronic disorder characterized by altered bowel habits and abdominal pain.Citation1 The prevalence of IBS is approximately 11% worldwide,Citation2 although estimates vary considerably.Citation3 IBS symptoms include abdominal pain and altered bowel habits that vary between the principal subtypes: diarrhea-predominant (IBS-D), constipation-predominant (IBS-C), and mixed (IBS-M).Citation4 In addition, studies now indicate that the gut microbiome plays significant, but different, roles in IBS-C, which is associated with intestinal methanogen overgrowth (IMO),Citation5 and IBS-D, in which small intestinal bacterial overgrowth (SIBO) is common.Citation6 A recent study now demonstrates the presence of distinct microbial profiles (microtypes) and associated breath gas patterns in IBS-C vs. IBS-D subjects.Citation7
While the etiology of IBS and its related microbiome changes are incompletely understood, it is now well established that acute bacterial gastroenteritis is an important trigger of IBS-D.Citation8 To understand this further, animal models have been developed for the study of IBS following gastroenteritis. Campylobacter jejuni is the organism most proven to induce IBS,Citation9 and rats gavaged with C. jejuni exhibit IBS-like phenotypes.Citation10–12 As C. jejuni and other pathogens that induce IBS all produce a common toxin, cytolethal distending toxin B (CdtB),Citation13 a C. jejuni knockout lacking CdtB was generated. Significantly, rats gavaged with this CdtB knockout did not develop IBS-like phenotypes, suggesting that CdtB might play a role in the pathophysiology of IBS.Citation11 Subsequent work showed that direct inoculation with C. jejuni CdtB alone is sufficient to induce IBS-like phenotypes in rats,Citation14 including increased bacterial levels in the small intestine (overgrowth), significantly increased anti-vinculin antibody levels, and significantly reduced vinculin gene expression in host intestinal tissues,Citation14 further underscoring that CdtB likely plays a key role in the development of IBS. These findings begin to synergize with known findings in humans with IBS.
While these findings are important, this rat model still has gaps in the link to human disease. For example, IBS also has other characteristic changes including visceral hyperalgesia,Citation15 alterations in serotonin signaling,Citation16 and gut barrier dysfunction,Citation17 and IBS subtypes are associated with distinct gut microbial profiles (microtypes) characterized by differences in microbial diversity and compositionCitation7 – IBS-C subjects exhibit a microtype with increased predominance of methanogenic archaea and bacterial families that include known syntrophs of methanogens, and IBS-D subjects exhibit 2 distinct microtypes – one associated with increased H2 on breath test and lower microbial diversity, and one associated with increased hydrogen sulfide (H2S) on breath test and increased predominance of the H2S producers Fusobacterium and Desulfovibrio.Citation7 Therefore, a deeper examination of microbiome composition in the CdtB-inoculated rat model, including whether different microtypes are also present in the small bowel, is warranted. Furthermore, a recent review highlights that post-transcriptional regulation of gene expression by microRNAs (miRNAs) in humans is associated with important pathways in IBS.Citation18 Therefore, a natural extension of the animal work is to determine if altered gene expression in the host following CdtB inoculation continues to parallel findings in humans, including the importance of miRNAs as regulatory factors. Importantly, the animal model would allow us to discern whether effects on host gene expression profiles are driven by exposure to the CdtB toxin or by the resulting microbiome changes (microtypes) identified.
In this study, we perform a detailed analysis of the effects of inoculation with CdtB alone on gut microbiome composition and host intestinal gene expression in a rat model, and the relationship to the development of IBS-D-like phenotypes. In addition, given the potential influence of miRNAs in altering gene expression, we explore host gut mRNA expression profiles and the potential miRNA involvement after inoculation with CdtB, and any resulting changes in the microbiome.
Results
PHASE 1
Rats inoculated with CdtB developed biomarkers and phenotypes consistent with those seen in IBS-D
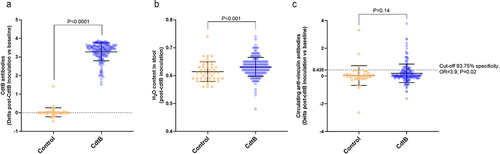
In phase 1 of this study, adult male Sprague Dawley rats were inoculated with recombinant C. jejuni CdtB protein (N = 178) or vehicle alone (controls, N = 48), and received booster inoculations with CdtB protein or vehicle 3 weeks later (Supplemental Figure S1), per our previously published protocol.Citation14 Seven weeks after the booster inoculations, CdtB-inoculated rats exhibited significantly increased circulating anti-CdtB antibody levels when compared to controls (P < .0001) and also had significantly increased stool wet weights (P < .001), indicating a diarrhea-like phenotype (). Further, the increased stool wet weights correlated with increased anti-CdtB levels. Anti-vinculin antibody levels were also higher in a subset of CdtB rats (P = 0.14, ). Using an optical density (OD) cutoff of > 0.435 (delta of post-inoculation and baseline), 20.57% of CdtB rats developed anti-vinculin antibodies (specificity: 93.75%, OR = 3.9, 95%CI 1.2 to 12.46, P = .02).
Figure 1. (a) Serum levels of anti-CdtB antibodies (delta of post-inoculation levels vs. baseline levels) in controls and CdtB-inoculated rats (CdtB). (b) Stool wet weight (%) in controls and CdtB rats. (c) Serum levels of anti-vinculin antibodies in controls and CdtB rats. The Mann-Whitney test was used to compare groups and a p-value <0.05 was considered significant.
CdtB induced a systemic pro-inflammatory response in inoculated rats
CdtB rats had increased serum levels of classic pro-inflammatory cytokines such as IL2 (fold change (FC) = 1.21, P = .021) and TNFα (FC = 1.18, P = .022) when compared to controls (Supplemental Table S1). The serum levels of IL5, which stimulates B cell growth and immunoglobulin secretion, and IL18, which plays a major role in the production of IFNγ from T-cells and natural killer cells, were also increased in CdtB rats vs. controls (FC = 1.15, P = .0004; FC = 1.12, P = .030, respectively, Supplemental Table S1). Levels of GRO/KC/CINC-1 (the IL8 functional homologue in rats) were below the lowest value on the standard curve (14.64 pg/mL) in all samples analyzed.
In addition, metabolic pathway predictions based on differences in cytokine, chemokine, and antibody levels between CdtB rats and controls predicted a classic inflammatory response (P = 5.12E–7) driven by lipopolysaccharides, the top upstream regulator identified (predicted activation z-score = 2.19, P = 6.22E–6). Inflammatory response, activation of phagocytes, and cytotoxicity of leukocytes were among the top 5 diseases and disorders predicted to be activated in CdtB rats (P < .05). Significantly, diarrhea was also predicted to be increased in CdtB rats (Supplemental Figure S2), which is consistent with the increased stool wet weights identified in these animals ().
PHASE 2
CdtB inoculation had profound effects on the small bowel microbiome, particularly in the ileum
In phase 2 of this study, one group of CdtB-inoculated rats and one group of controls were used to explore the effects of the CdtB toxin alone on the gut microbiome (Supplemental Figure S1). 16S rRNA gene sequencing was performed on DNAs from luminal contents from the duodenum, ileum, cecum, and left colon (stool). After excluding rats that did not have samples available from all segments, and samples that did not meet the minimal number of reads for analysis (≥5,000), 69 rats (CdtB N = 48, control N = 21) were included in the downstream analysis for this phase of the study (Supplemental Figure S1). After quality control, the average number of reads classified under an OTU was 92,121, ranging from 8,695 to 258,077.
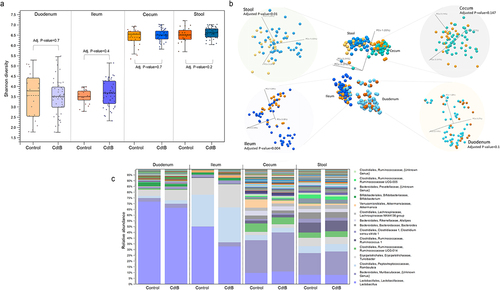
No differences in microbial alpha diversity were identified for any gut segment (). While the stool microbial profile (reflecting overall beta diversity) in CdtB rats was measurably different when compared to controls, these differences were modest (adj. P-value = 0.01, ), and were driven by the relative abundances (RA) of two bacterial genera (Eubacterium ruminantium group and Oribacterium) (Supplemental Table S2). In contrast, the ileal microbial profile most strongly differentiated CdtB rats from controls (adj. P-value = .004, ), with significant differences in the RA of 58 bacterial genera (, Supplemental Table S2). Of these, Lactobacillus RA was significantly lower in CdtB rats vs. controls (log2FC = −1.04, adj. P-value = 3.43E–3, Supplemental Table S2), and the RA of the remaining 57 genera were higher in CdtB rats vs. controls (, Supplemental Table S2). In fact, Lactobacillus was the top 1 genus resulting from Linear Discriminant Analysis Effect Size (LEfSe) analysis, with a linear discriminant analysis (LDA) score of 3.6 (adj. P-value = .001), followed by Ruminococcus (LDA score = 1.87, adj. P-value = .0001). Although the genus Bifidobacterium had a LDA score higher than 1.5 (applied cutoff), the adj. P-value was not significant (LDA score = 1.87, adj. P-value = .7). No other feature was identified as significant after LEfSe analysis.
Figure 2. (a) Small intestinal (duodenum and ileum), large intestinal (cecum) and stool microbial alpha diversity (Shannon entropy) of CdtB rats (blue) and controls (orange). (b) Small bowel (duodenum and ileum), large intestine (cecum) and stool microbial beta diversity of CdtB rats (shades of blue) and controls (shades of yellow/orange). (c) Relative abundances of all bacterial genera throughout the small bowel (duodenum and ileum), large intestine (cecum) and stool of CdtB rats and controls.
Inoculation with CdtB resulted in the formation of 3 distinct microtypes in the ileum
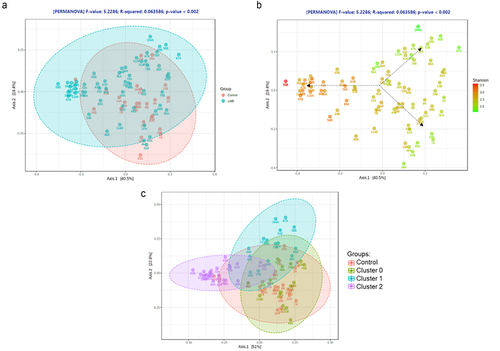
Further analysis revealed that the effects of CdtB on the ileal microbiome were not uniform. Rather, three distinct microtypes (clusters) characterized by different ileal microbial diversities and microbial compositions (profiles) were identified within the CdtB group (). Cluster 0 rats (N = 13) had an ileal microbial alpha diversity and microbial profile that were similar to controls (, Supplemental Figure S3A). Cluster 1 (N = 13) had a less diverse ileal microbiome than controls (P = 0.0005, Supplemental Figure S3A), but had a unique microbial profile (). In contrast, cluster 2 rats (N = 22) had a more diverse ileal microbiome than controls (P = 6.0E–7, Supplemental Figure S3A) as well as a unique microbial profile that was different from both controls and cluster 1 ().
Figure 3. (a) Principal coordinate analysis (PCA) plot of ileal microbiome beta diversity in CdtB rats (blue) and controls (red). (b) PCA plot of ileal microbiome beta diversity in CdtB rats and controls, colored according to differences in alpha diversity (Shannon index). (c) PCA plot of ileal microbiome beta diversity showing the different clusters of CdtB rats (cluster 0 - green, cluster 1 - blue and cluster 2 - purple) and controls (red), after clustering analysis using the K-Means clustering algorithm.
Cluster 0 rats exhibit similar ileal beta and alpha diversities to controls (Bray Curtis PERMANOVA adj. P-value = 1, and UniFrac 0.5 PERMANOVA adj. P-value = 1, Shannon diversity P = .2) but did exhibit some ileal microbiome differences at the genus level when compared to controls (Supplemental Figure S3B). While Lactobacillus RA was not different between cluster 0 and controls (FC = 0.35, adj. P-value = 0.8), cluster 0 rats had a significantly lower Bifidobacterium RA, a unique feature of this cluster (FC = −3.91, adj. P-value = 1.98E–4), lower Methanosphera RA (FC = −4.13, adj. P-value = .02), and higher RA of 10 genera including Enterococcus (FC = 2.85, adj. P-value = 6.58E–3), Lactococcus (FC = 2.70, adj. P-value = 5.63E–3), Morganella (FC = 3.74, adj. P-value = .02), Proteus (FC = 3.95, adj. P-value = .03), and Rothia, another unique feature of this cluster (FC = 2.23, adj. P-value = 7.75E–3, Supplemental Table S3).
Cluster 1 rats, characterized by a lower ileal alpha diversity than controls (Shannon diversity P-value = .0005), exhibited differences in 23 genera, including lower RA of Lactobacillus (FC = −1.40, adj. P-value = 5.65E–4) and Methanosphera (FC = −3.98, adj. P-value = .02, Supplemental Table S3). Many differences seen in cluster 0 rats vs. controls were also seen in cluster 1, including higher ileal RA of Enterococcus (FC = 3.94, adj. P-value = 1.5E–5), Lactococcus (FC = 3.08, adj. P-value = 4.8E–4), Proteus (FC = 4.87, adj. P-value = 1.83E–3), and Morganella (FC = 3.04, adj. P-value = .06, Supplemental , Supplemental Table S3). However, there were features unique to cluster 1, including higher RA of Escherichia-Shigella (FC = 3.02, adj. P-value = .02, Supplemental Table S3), an important player associated with microbiome changes in humans with IBS-D.Citation19 The absolute abundance of E. coli was also quantified by real-time PCR, and cluster 1 rats alone were found to have higher absolute abundance of E. coli when compared to controls (P = .008, Supplemental Figure S4).
Cluster 2 CdtB rats exhibited differences in 76 genera, most of which were also found in stool (Supplemental Table S3, Supplemental Figure S3B). This ileal colonization with stool bacteria was accompanied by decreased RA of Lactobacillus species (FC = −2.54, adj. P-value <.0001), and increased RA of Parasutterella and unknown genera from families Muribaculaceae and Ruminococcaceae UCG-013 and order Coriobacteriales (Supplemental Table S3). The top 5 genera uniquely enriched in cluster 2 rats were Parasutterella, Acetitomaculum, Allobaculum, Parvibacter, and Desulfovibrio (Supplemental Table S3), which were also associated with increased ileal microbial diversity. Notably, Parvibacter, which can ferment amino acids,Citation20 and Desulfovibrio, a classic hydrogen sulfide (H2S) producer, also strongly correlated with microbial diversity in cluster 2 rats (R = 0.694, P = 3.77E–11, R = 0.675, P = 2.01E–10, respectively).
A total of 24 microbial identified genera characterizing the differences between clusters were identified after LEfSe analysis (Supplemental Table S4). Changes in the relative abundance of genus Lactobacillus was the top 1 driver differentiating controls from clusters 1 and 2 (LDA score = 3.88, adj. P-value = 8.7E–9). Most of the genera identified as driving the differences between clusters, including Desulfovibrio, were highly associated with cluster 2, which could be a reflection of the increased alpha diversity in this group (Supplemental Table S4). The genera Romboutsia, Turicibacter and Escherichia-Shigella were associated with the differentiation of cluster 1 (Supplemental Table S4).
Inoculation with CdtB produced alterations in host ileal tissue transcriptomes
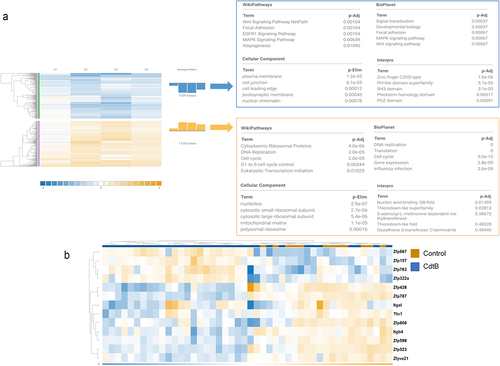
A meta-analysis of host ileal tissue transcriptomes from all 3 CdtB rat clusters and controls was performed to identify common mRNA signatures indicative of ileal function changes due solely to CdtB effects (). Regardless of microtype, CdtB had a profound effect on cell cycle mRNAs in ileal tissues (adj. P-value = 2E–5), with alterations in mRNAs for several transcription factors, including those involved in DNA replication (adj. P-value = 2E–5) and control of G1-to-S phase transition (adj. P-value = .003, ), onsistent with the known effects of CdtB on the cell cycle. Downstream CdtB effects were also observed for plasma membrane components, with alterations in host mRNAs for structural components of focal adhesions (adj. P-value = .001) and other cell junctions (P-Elim = 6.1E–5, ), including zinc finger proteins, integrins, and the vinculin-associated protein talin, a key cytoplasmic protein that mediates integrin adhesion to the extracellular matrix.Citation21 () Although ileal vinculin gene expression was unchanged in CdtB rats (adj. P-value = .83), notably, circulating levels of anti-vinculin antibodies in these rats correlated with alterations in host ileal tissue pathways, including ‘cell junctions’ (Spearman r = 0.304, P = .042) and ‘cell-cell adhesion junctions’ (Spearman r = .298, P = .047) pathways.
Figure 4. (a) Common altered host ileal tissue pathways in different microbiome-based clusters of CdtB rats, based on whole transcriptome analysis. C1 – cluster 2 vs. Control; C2 – cluster 1 vs. Control; C3 – cluster 0 vs. Control; C4 – CdtB (all rats) vs. Control. (b) Zinc finger (zfp), integrins (itg) and talin (Tln) mRNA expression profiles in control (orange) and CdtB (blue) rats after meta-analysis of differently expressed genes associated with the global effects of CdtB. Hypergeometric distribution was used to analyze the enrichment of pathways, gene ontology, domain structure, and other ontologies. The topGO R library was used to determine local similarities and dependencies between GO terms in order to perform Elim pruning correction. DEseq2 was used to calculate fold changes and p-values. Differentially expressed mRNAs had absolute fold change (FC) ≥ 1.25 and adj. P-value (FDR P-value) <.05.
Having defined common ileal mRNA signatures across all microtypes due solely to CdtB exposure, the host transcriptome of each CdtB microtype was compared separately to controls. Applying a filter for a minimum fold change of ± 1.25 and an adjusted P-value (FDR) ≤0.05, a total of 170 and 1463 genes were identified as differentially expressed in the ileal tissues of cluster 2 and cluster 1 rats, respectively (Supplemental Figure S5). Surprisingly, 1561 genes were differentially expressed in ileal tissues from cluster 0 rats compared to controls, despite the similar ileal microtypes in these 2 groups (Supplemental Figure S5).
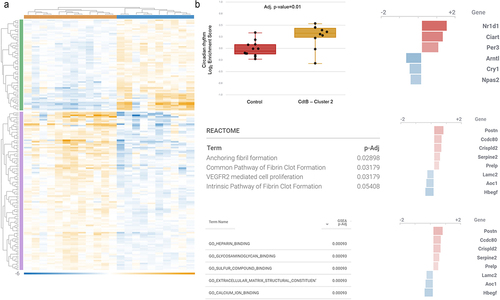
Cluster 2 rats exhibited enrichment of pathways linked to circadian rhythm (adj. P-value = 2.8E–5) and fibrin clot formation (adj. P-value = 0.02) (), both of which are partly controlled by H2S.Citation22,Citation23 In addition, the top 5 Gene Ontology (GO) terms enriched in this cluster included genes encoding sulfur-binding compounds (adj. P-value = .00093, ). Interestingly, pathways linked to pain response mechanisms, including serotonin response, appeared to be associated with Cluster 2 vs. controls (adj. P-value = .05).
Figure 5. (a) Differentially expressed genes in host ileal tissues of cluster 2 CdtB rats as compared to controls. (b) Gene ontology (GO) enriched pathways in ileal tissues of cluster 2 CdtB rats as compared to controls. DEseq2 was used to calculate fold changes and p-values. Differentially expressed mRNAs had absolute fold change (FC) ≥ 1.25 and adj. P-value (FDR P-value) <0.05. Hypergeometric distribution was used to analyze the enrichment of pathways, gene ontology, domain structure, and other ontologies. The topGO R library was used to determine local similarities and dependencies between GO terms in order to perform Elim pruning correction.
Further analysis of host miRNAs identified cluster-specific expression profiles when compared to controls (, Supplemental Table S5). Cluster 0 did not exhibit any differently expressed miRNAs when compared to controls. In cluster 2, 14 miRNAs were differently expressed (DE) (3 downregulated and 11 upregulated) (), of which 13 were associated with the control of 87 of all DE mRNAs after in-silico miRNA-mRNA expression pairing analysis on IPA (Supplemental ). Extracellular region and space, and many vesicle and membrane components were identified as the most significantly controlled cellular components and ‘high-density lipoprotein particle’ was the cellular component with the highest fold change (). In terms of fold change, these interactions were mainly associated with the regulation of biological processes that are also linked to circadian rhythms, particularly ‘circadian temperature homeostasis’ ().
Figure 6. Differentially expressed host miRNAs in CdtB-induced dysbiosis. (a) Principal component analysis of miRNA expression in clusters of different microbiomes emerged after CdtB exposure. (b) Venn diagram of the differentially expressed (DE) miRNAs in each microbiome cluster. Cluster 0 did not show any differently expressed miRNAs when compared to controls. (c) DE miRNAs in cluster 1. (d) DE miRNAs in cluster 2. (e). Top 20 DE miRNAs in cluster 1. (f) All DE miRNAs in cluster 2. Differentially expressed miRNAs have absolute fold change (FC)≥1.5 and adj. P-value (FDR P-value)<0.1. FDR p-values were obtained through multi-factorial statistics based on a negative binomial generalized linear model (GLM) using CLC Genomics Workbench v.20 (Wald test). Heatmaps use relative color scheme, where the minimum and maximum values in each row are used to convert values to colors. Euclidean distance and average linkage were used for the creation of heatmaps using morpheus software (https://software.Broadinstitute.org/morpheus).
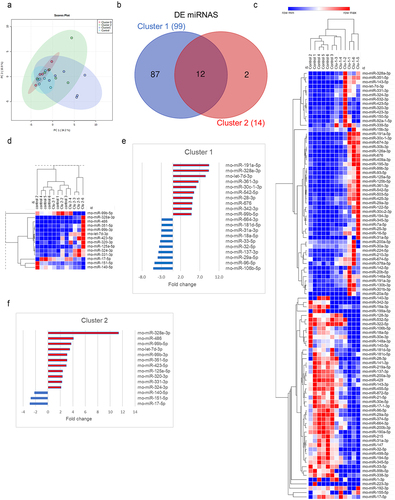
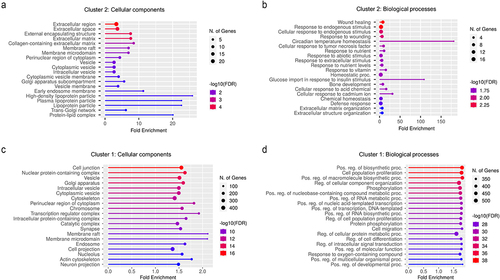
Figure 7. Enrichment analysis of DE host mRNAs that were the targets of DE miRNAs in clusters 2 and 1. Predicted and validated miRNA targets were uploaded to ShinyGO v.0.76.1 to obtain the gene ontology (GO) terms for cellular components and biological processes that were regulated by miRNAs in each cluster. (a) Top 20 dysregulated cellular components regulated by miRNAs in cluster 2. (b) Top 20 dysregulated biological processes controlled by miRNAs in cluster 2. (c) Top 20 dysregulated cellular components regulated by miRNAs in cluster 1. (d) Top 20 dysregulated biological processes controlled by miRNAs in cluster 1. Enrichment analysis in ShinyGO v.0.76 was calculated based on hypergeometric distribution followed by false discovery rate (FDR) correction (FDR <0.05). No background list was used for enrichment analysis.
Cluster 0 and Cluster 1 rats (which had ileal microtypes characterized by higher RA of Gram-negative Enterobacteriaceae taxa), had highly similar ileal tissue transcriptomic profiles. However, when compared to controls, changes in the expression of more than 1,000 genes using a fold-change cutoff of ± 1.25 (adj. P-value ≤.05, Supplemental Figure S5) were found. To narrow down the most important genes, a new cutoff of ± 1.5 was applied. CdtB rats from both of these clusters exhibited ileal tissue transcriptomic profiles related to immune responses to external antigens, including the regulation and differentiation of T cells (adj. P-value = 1.3E–5 and adj. P-value = .0003), antigen processing and presentation via major histocompatibility complex (MHC) (adj. P-value = 1.3E–5, Supplemental Figure S7), and enrichment of several GO terms associated with defensins, including alpha defensins (Supplemental Figure S8).
Comparing the ileal tissue transcriptomic profiles of cluster 1 and cluster 0 rats to each other revealed a more severe immune response (adj. P-value = 6.2E–13) and local acute inflammation response in cluster 1 (adj. P-value = 3.1E–7), with down/upregulation of genes involved in responses to local TNF effects (adj. P-value = 4.1E–5, Supplemental Figure S9). Altered regulation of genes encoding cell adhesion pathway molecules were also more characteristic of cluster 1 rats (adj. P-value = 7.06E–5, Supplemental Figure S9).
As noted above, cluster 0 did not show any differently expressed miRNAs when compared to controls and the DE mRNAs in this cluster appeared not to be controlled by differences in host miRNA expression. However, cluster 1 had 99 DE miRNAs (). Of these, 82 DE miRNAs paired with 87.6% of the DE mRNAs, leading to the identification of 336 interactions previously identified in the literature, irrespective of over- or under-expression (Supplemental Figure S10, Supplemental Table S5). ‘Cell junction’ was identified as the most significant cellular component regulated by DE miRNAs in cluster 1 (, Supplemental File 1), and membrane raft and microdomain were the ones with the highest fold changes. ‘Positive regulation of biosynthetic process’ was the most significant biological process, followed by many others associated with transcript regulation and cell proliferation and differentiation, which had similar fold changes (, Supplemental File 1). Prediction of the top upstream regulators in cluster 1 indicated that microbiome changes influenced alterations in gene expression that were modulated by miRNAs, revealing E. coli B4, B5, and serotype 0127B8 LPS as the top upstream regulators of gene expression (z-score = 5.556, adj. P-value <.001; z-score = 4.429, adj. P-value <.001; z-score = 2.915, adj. P-value <.001, respectively) (Supplemental Figure S11, Supplemental File 1).
DE miRnas modulate IBS-associated mechanisms in dysbiosis caused by CdtB
To identify whether DE host miRNAs were targeting genes previously identified in the literature and associated with IBS, we performed a search for updated journal reviews and found 2 publications exploring this theme from January 2021 to August 2022.Citation24,Citation25 This approach demonstrated that downregulation of miRNA targets such as Myocd (myocardin), Srf (serum response factor), Aqp3 (aquaporin 3), occludin (Ocln), cadherin (Cdh1), Cacna1 (calcium voltage-gated channel subunit alpha1 A) and Pten (phosphatase and tensin homolog) occurred in CdtB-induced dysbiosis in cluster 1, indicating that mechanisms associated with GI motility, barrier function, and visceral nociception, previously identified in IBS, were also affected in cluster 1. Moreover, validated miRNA-mRNA interactions associated with IBS were also identified in our rat model in the same direction, particularly miR-29a-3p, which interacted with the mRNAs for aquaporins Aqp3 and Aqp8, and for tight-junction protein 1 (Tjp1, also known as ZO-1) and miR-122-5p, which interacted with the mRNA for Ocln ().
Table 1. Relevant miRNAs and targets previously identified in the literature and associated with IBS pathophysiology in clinical and animal studies.
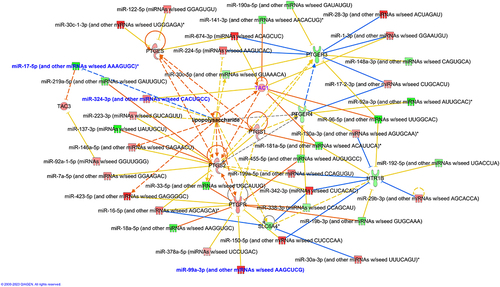
In addition, the previously identified role of the gut microbiota in the regulation of pain mechanisms involving prostaglandin E2 in IBSCitation38 was also observed in cluster 1. Further analysis identified upregulation of Ptges (prostaglandin E synthase), Ptgfr (prostaglandin F receptor), Ptgs2 (prostaglandin peroxidase synthase 2), Tac1 (tachykinin precursor 1) and Tac3 (tachykinin precursor 3) and downregulation of serotonin receptors Slc6a4 (SERT) and htr1b (5-hydroxytryptamine receptor 1b) and prostaglandin E receptors Ptger3 and Prgr4 in cluster 1. All targets were exclusively found as DE mRNA in cluster 1, with the exception of Tac1 which was also found in cluster 2, and formed interactions with miRNAs, and LPS, predictably, appeared as a top upstream regulator of many DE miRNAs and genes (). All targets showed more than 1 interaction with miRNAs. These results demonstrate that many central mechanisms associated with the development of IBS were potentially regulated by changes in the small bowel (ileal) microbiome induced by CdtB exposure, which, in turn, involved the activity of miRNAs.
Figure 8. miRNA-mRNA interactions in mechanisms associated with pain in IBS. DE genes involved in mechanisms that were previously associated with pain in IBS were added to the network along with their DE interacting miRNAs from our dataset. LPS was added to the network for activity pattern prediction. Activation/inhibition predictions were obtained using the MAP prediction tool on IPA. Targets with names in purple and miRnas with names in blue were dysregulated in cluster 1 and 2 in the same direction. Targets and miRNAs with names in black were dysregulated in cluster 1 only.
Discussion
In this study, we demonstrate for the first time a direct link between systemic exposure to the C. jejuni CdtB toxin and changes in the small bowel microbiome and host gene expression in an in vivo model. We show that these microbiome changes in response to CdtB exposure lead to 3 distinct microtypes that can be identified based on the resulting ileal microbiome profiles. One microtype of rats developed a more diverse ileal microbiome enriched with Parasutterella and Desulfovibrio (cluster 2); a second microtype developed a less diverse ileal microbiome enriched with Escherichia coli (cluster 1); and a third microtype (cluster 0) exhibited an ileal microbiome profile that was more similar to controls. We also show that all of these CdtB-induced microtypes were associated with altered ileal gene and miRNA expression relative to controls, but the genes and miRNAs affected differed between microtypes. Specifically, impairments of extracellular space and membrane components, as well as clot formation and sulfur compound binding pathways, were identified in the microtype with increased ileal relative abundance of Parasutterella and Desulfovibrio (cluster 2), whereas altered pathways associated with immune responses were found in the E. coli-enriched microtype (cluster 1). Finally, we show that altered ileal expression of genes involved in cell adhesion, although common to all rats exposed to CdtB, was strongly controlled by miRNAs in the E. coli-enriched microtype. Expression of miRNA targets known to be associated with IBS and pain pathways were also seen in the E. coli-enriched microtype.
Over the past 10 years our understanding of the pathophysiology of IBS-D has undergone several conceptional transformations and modifications,Citation39 including the current belief that IBS-D is a spectrum of diseases, rather than a single condition representing a well-defined group of phenotypically similar subjects. Defining this spectrum is, perhaps, one of the greatest challenges in IBS-D, considering that the condition is diagnosed solely based on gastrointestinal symptoms (recurrent abdominal pain and diarrhea), without a need to demonstrate unique etiological and/or organic factors associated with changes in normal gut function. In a recently published paper, we demonstrate the presence of distinct microbial profiles (microtypes) and associated breath gas patterns in human IBS-C and IBS-D subjects.Citation7 Specifically, we show that IBS-C is associated with increased breath methane (CH4), increased predominance of methanogenic archaea and increased gut microbial diversity, whereas IBS-D is associated with increased breath H2 and is also associated with increased breath H2S. Increased breath H2 and H2S are associated with decreased microbial diversity, and increased H2S is also associated with a higher prevalence of H2S producers including Fusobacterium and Desulfovibrio species, and of H2 donors from the family Enterobacteriaceae.Citation7
Another known microbiological association with IBS-D is that acute bacterial gastroenteritis can be a precipitating event leading to this chronic illness.Citation8 Most bacterial causes of acute gastroenteritis share pathogenic features, including the ability to invade tissues and translate extremely active and cytotoxic toxins, such as CdtB. Prior exposure to CdtB, indicated by elevated anti-CdtB antibodies, is associated with the development of IBS-D, and a subset of subjects also exhibit an autoimmune phenotype characterized by elevated antibodies to vinculin, a cytoskeletal protein essential in stabilizing tight and adherens junctionsCitation40 and focal adhesionsCitation41 and for paracellular barrier function maintenance.Citation42 Previous studies have demonstrated that inoculation with the CdtB toxin alone can trigger the development of IBS-D-like phenotypes in rats that mirror human findings.Citation14 In the present study, exposure to the CdtB toxin alone again led to a diarrhea-like phenotype and bacterial overgrowth, as well as the autoimmune phenotype in a smaller subset of rats.
Elevated anti-vinculin and anti-CdtB antibodies are frequent in IBS-D and are believed to contribute to SIBO. In the present study, the overgrowth of E. coli (commonly isolated from the small bowel of subjects with SIBO) in the ileum of rats following exposure to CdtB alone was a notable consequence, despite the low incidence of antibodies to vinculin. Nonetheless, at the gene expression level, CdtB-induced alterations in genes involved in cell adhesion and cell junctions in ileal tissues were associated with circulating levels of anti-vinculin antibodies, suggesting that the establishment of the autoimmune state might happen at molecular level first, locally in small bowel tissues, before systemic events occur. More importantly, ileal expression of vinculin-associated genes, such as Ocln, Cdh1, and Tjp1/ZO-1 were altered following CdtB exposure. In adherens junctions, vinculin forms a complex with α/β-catenin, cadherin and actin filaments, and functions as an adaptor during mechanical fluctuations.Citation43,Citation44 Moreover, vinculin stabilizes tight junctions, which are formed by Ocln, Tjp1 and claudin-3, through maintenance of their linear distribution pattern.Citation41
In this study, imbalances in the ileal expression of genes encoding structural components of cell junctions were seen in all rats following exposure to the CdtB toxin. This finding is significant as increased intestinal barrier permeability, particularly small intestinal permeability, has long been associated with IBS-D,Citation45,Citation46 and our results suggest that this hallmark of IBS-D is directly associated with exposure to the CdtB toxin. These alterations in intestinal barrier proteins were followed in most cases by profound disruptions in the ileal microbiome. Three distinct microtypes were seen: one associated with increased small bowel relative abundance of bacteria that are seen in stool, including Parasutterella and Desulfovibrio; one with increased absolute load of E. coli and decreases in ileal microbial diversity; and one with no major changes in ileal microbiome structure.
In the first microtype, the presence of stool/fecal bacteria in the ileum (fecalization) that followed CdtB exposure was associated with an increase in microbial diversity, which in most gut microbiome studies is considered a marker of a healthier state. However, ileal transcriptomic analyses pointed to disturbances of basic physiological processes in this microtype, including H2S-associated pathways involved in the control of fibrin clot formation and circadian rhythm, this last regulated by miRNA. H2S is a toxic gasotransmitter implicated in different physiological and pathological processes in humans, including the modulation of plasma hemostatic parameters, inhibition of various steps in blood platelet activation and fibrin clot formation,Citation23 and the regulation of the intracellular redox via changes in the expression of circadian clock genes.Citation22 H2S also affects the levels of several neurotransmitters in the brain, including serotonin,Citation47 which may explain the activation of molecular pathways associated with serotonin metabolism in these rats. In fact, periostin (Postn) and epidermal growth factor receptor (Egfr), genes previously associated with visceral hypersensitivity,Citation48,Citation49 were impaired in this microtype and were predicted to be targets of two DE miRNAs, miR-151-5p and miR-99b-3p, respectively. In addition, the relative abundance of a classic sulfate reducing bacteria - Desulfovibrio – was increased in the ileum of these rats. H2S can be detected in exhaled breath, and we recently found increased H2S levels, in association with increased H2S producers including Fusobacterium and Desulfovibrio species, in some IBS-D subjects.Citation7 H2S-associated increases in serotonin may explain the heightened visceral sensitivity seen in some IBS-D subjects.Citation50
Fecalization of the small bowel is a sign of SIBO and includes the overgrowth of specific organisms from family Enterobacteriaceae, such as E. coli, Klebsiella, and Salmonella,Citation19,Citation51,Citation52 associated with decreased diversity of commensal microbes in the small bowel and increases in breath H2.Citation19 Increased breath H2 and increased prevalence of Enterobacteriaceae in stool samples were also recently demonstrated in human IBS-D subjects.Citation7 These microbial hallmarks were also seen in the second microtype of CdtB rats, in conjunction with an extremely disconfigured ileal transcriptomic and miRNAomics profiles, leading to imbalances in cellular structural components and immune responses. Enteric pathogens have evolved complex strategies to outcompete normal intestinal microbiota, including promoting intestinal inflammation and producing toxins that inhibit commensal microbes.Citation53,Citation54 Nonetheless, inflammation often impairs cell structure components, and ‘cell junction’ was prominently impaired in this microtype and was the most significant structural component regulated by miRNAs. Important mRNA-miRNA interactions previously associated with IBS are consistent with our current findings, such as the concomitant upregulation of miR-122-5p and miR-29-3p and downregulation of their targets, Ocln, Citation32,Citation55–57, Aqp3 and Tjp1 Citation30,Citation33 demonstrating the essential role of miRNAs in barrier homeostasis and in small bowel dysbiosis in which E. coli is the primary disruptor, as demonstrated by upstream prediction analysis and confirmed by PCR.
Intestinal immune activation and inflammation also lead to abdominal hyperalgesia,Citation38,Citation58–61 which is an important symptom of IBS and a Rome criterion.Citation62 Therefore, we analyzed the expression of molecules associated with sensitization and intestinal motility,Citation38,Citation61,Citation63 and found that dysregulated miRNAs formed interactions, with genes encoding prostaglandins and their receptors, serotonin, and tachykinins, such as Ptges and Slc6a4 (Sert), both of which were dysregulated in the E. coli-enriched microtype. LPS treatment stimulates cultured mouse mast cells to increase expression and release of prostaglandin-2 (which is mediated by Ptges), resulting in decreased mucosal Sert,Citation38 suggesting an association with diarrhea and abdominal pain in IBS. Moreover, a serotonin receptor 3E variant was recently implicated as a risk factor for female IBS-D subjects who exhibited downregulated transcript levels in the colon.Citation64 Interestingly, Htr1b – a similar serotonin receptor – was significantly downregulated in the E. coli microtype in this study and was a predicted target of multiple miRNAs, such as miR-29a-3p. Further, tachykinin family members Tac3 and Tac1 (a substance P precursor closely associated with regulation of gastrointestinal motility, secretion, and pain sensitivity), and the miRNAs miR-17-5p, miR-423-5p, miR-324-3p and miR-99a-3p (predicted to interact with pain-associated targets) were dysregulated in both the Desulfovibrio and E. coli microtypes, suggesting that pain-related pathways might be a common signature in both microtypes. These two microtypes share common signatures beyond those related to pain, as miR-17-5p, a member of the miR-17/92 family which is strongly associated with several types of cancer when upregulated, including colorectal cancer,Citation65 was significantly downregulated in both the Desulfovibrio and E. coli microtypes. Moreover, the significant downregulation of this and other family members associated with colorectal cancer (such as miR-18a-5p, miR-19a-3p, miR-20-5p, and the paralog miR-106b-5p) in the E. coli microtype suggests that this miRNA signature could explain, at least in part, the lower risk of colorectal cancer and cancer-specific mortality in patients with IBS.Citation66
Even though the third microtype of CdtB rats exhibited a more resilient ileal microbiome, alterations in specific potential pathobionts such as Morganella and Proteus were seen, coupled with significant changes in the ileal transcriptomic profile, but not the miRNA profile, which suggests other gene expression regulation mechanisms may be occurring. These findings suggest that alterations in certain bacterial species are sufficient to disrupt homeostasis in the host, and that modifications of structural components of an entire microbiome are more likely to be affected by changes in specific microbial features, rather than in response to impaired host homeostasis. This may provide evidence of the directionality of the cascade of events seen in these rats after exposure to CdtB, where CdtB promotes changes in the gut microbiome, profoundly affecting bacterial communities particularly in the ileum, which leads to alterations of host gut homeostasis, exacerbating the direct effects of CdtB on ileal functions. Further studies aiming to manipulate the intestinal microbiome with some of the key microbes identified in this study would provide more clarity and determine whether the microbiome and host gene expression changes seen in this study can be driven solely by these microbes, in the absence of CdtB.
This study has some limitations. Considering the importance of breath H2 and H2S levels in the diagnosis of SIBO and IBS-D, detection, and analysis of these two gases will be required to determine if the small bowel microbiome changes induced by CdtB also precipitate the elevation of H2 or H2S. In addition, miRNA-RNA interaction validation studies were not performed, although predicted interactions reproduced important findings from the literature. Moreover, many of the findings here mirror the distinct gut microtypes we recently identified in IBS-D subjects with different breath gas profiles,Citation7 indicating that the rat model in this study may indeed reflect IBS-D-like patterns.
In conclusion, systemic exposure to the C. jejuni CdtB toxin precipitates changes in ileal gene expression and the ileal microbiome, leading to the development of distinct microtypes that mirror findings in human subjects with SIBOCitation19,Citation52 and IBS-D.Citation7 One microtype was associated with increased prevalence of H2S producing bacteria and related pathways, suggesting that exposure to CdtB may also contribute to alterations in the small bowel microbiome of IBS-D subjects with increased breath H2S levels, but further studies will be needed to confirm this. These findings suggest that exposure to the CdtB toxin results in changes in ileal gene expression and ileal microbial populations that may underlie the phenotypes of IBS-D.
Materials and methods
In vivo IBS-D model
This study had 2 phases. The first phase, which was designed to evaluate the effects of CdtB inoculation, included a total of 226 male 12-week old Sprague Dawley rats (Envigo, Somerset, NJ) that were used for analyses of stool wet weight, anti-vinculin and anti-CdtB antibody levels, levels of circulating cytokines and chemokines. Rats were housed under regular 12/12 hour light-dark cycles with ad libitum access to food and water. 178 rats were inoculated with recombinant C. jejuni CdtB protein (CdtB group), and 48 rats were injected with vehicle alone (controls).
In the second phase of this study, after the CdtB effects evaluation phase, the rats were randomized into 5 different groups − 2 groups of control rats and 3 groups of CdtB-inoculated (CdtB) rats. One group of controls (N = 21) and one group of CdtB rats (N = 48) remained in this study for microbiome, gene expression, and microRNA expression analyses. The remaining groups of rats became part of a separate study and no further data from these animals are included in this manuscript. The study was approved by the Cedars-Sinai Institutional Animal Care and Use Committee (IACUC).
Subcutaneous inoculation with CdtB protein
Controls (N = 48) were inoculated with a 1:1 preparation of complete Freund’s adjuvant (CFA) (Sigma-Aldrich, St. Louis, MI) and a 20 mM Tris-HCl buffer (pH 8.0) containing 0.2 M NaCl, and 2 mM DTT. CdtB group rats (N = 178) were inoculated with 90 µg of C. jejuni CdtB protein (Creative Biomart, Shirley, NY) dissolved in the same 20 mM Tris-HCl buffer. Subcutaneous injections were performed as described previously,Citation14 with 100 µL per site of either vehicle/CFA or CdtB/CFA was injected at each of 5 sites along the animal’s back. For the CdtB group, each 100 µL injection contained approximately 18 µg CdtB, such that each animal received a total of 90 µg CdtB. Booster injections were given 3 weeks after the initial injection, and 100 µL of either vehicle/incomplete Freund’s adjuvant (IFA) or CdtB/IFA was injected at each of 3 sites along the animal’s back. For the CdtB group, each 100 µL injection contained 18 µg CdtB, such that each animal received a total of 54 µg CdtB.
Serum and stool collection
Blood and stool samples were collected from each rat at baseline and 7 weeks after the booster injections (Supplemental Figure S1). Blood was collected from tail veins in sterile 2.0 mL tubes, allowed to coagulate for at least 30 minutes, and then centrifuged. Serum aliquots were prepared and stored at −80°C.
Stool was collected from each rat via stimulation of the anus under manual restraint. Stool samples were collected for 3 consecutive days. The percent water content was determined by weighing the stool immediately after collection (wet weight) and after drying for 72 hours at 80°C in a convection oven (dry weight) and expressing the difference as a % for each stool.
Small bowel content and tissue collection
Thirteen days after the 7-week collections, all rats were euthanized (Supplemental Figure S1). Luminal contents from segments of the small bowel (duodenum and ileum) and large intestine (cecum and left colon [stool]) were collected and stored at − 80°C prior to DNA isolation. A 1‐cm section from each segment was preserved in AllProtect (Qiagen, Hilden, Germany) and stored at − 20°C for RNA expression analyses. Small bowel segments were identified as follows:
Duodenum: 5 cm distal to the pylorus.
Ileum: 5 cm proximal to the ileocecal valve.
Determination of anti-CdtB and anti-vinculin antibodies in serum
Using a second-generation ELISA, levels of anti-CdtB and anti‐vinculin antibodies were determined using serum collected after the booster injections, following previously described protocols.Citation67
Systemic inflammatory profile determination
The inflammatory profile of each rat was determined using serum collected after the booster injections. A Luminex FlexMap 3D (Luminex Corporation, Austin, TX) was used to analyze circulating cytokine and chemokine levels with a bead-based multiplex panel for interleukin (IL) 4, IL1β, IL2, IL6, IL13, IL10, IL12p70, interferon gamma (IFNγ), IL5, IL18, monocyte chemoattractant protein-1 (MCP1), GRO/KC/CINC-1 (a functional homolog of IL-8 in rats), and tumor necrosis factor alpha (TNFα) (EDM Millipore, Billerica, MA).
The fold change differences between groups and P-values (<0.05) for each cytokine and chemokine were uploaded to Ingenuity Pathway Analysis (IPA, Summer Release 2022) software to identify altered pathways after CdtB exposure. The fold changes (expression levels) were used to perform a Core Analysis for the identification of canonical pathways and their possible top upstream regulators.
DNA extraction from small bowel luminal samples and stool
Samples were thawed on ice and weighed. The MagAttract PowerSoil DNA KF kit (Qiagen) was used to isolate microbial DNA from each sample utilizing the KingFisher Duo (ThermoFisher), followed by quantification using the NanoDrop One fluorometer (ThermoFisher) and with the Qubit DNA Broad Range Assay kit (Invitrogen, Carlsbad, CA) on a Qubit 4 Fluorometer (Invitrogen). Extractions were also performed on negative control samples (laboratory grade water).
Bacterial absolute abundance analysis
Bacterial load was assessed by measuring the number of 16S copies in each sample using the Pan Bacterial 1 assay (Qiagen). Reactions were carried out on the QuantStudio 6 Flex Real-Time PCR System (ThermoFisher) as follows: 5 µL of Microbial qPCR Mastermix, 0.5 µL Pan Bacterial 1 assay, ~0.2ng of genomic DNA, and PCR grade H2O for a final volume of 10 µL. Thermocycling conditions were as follows: 95°C for 10 min, 40 cycles of 95°C for 15 s, 60°C for 2 minutes.
Total DNA extracted from 1 mL of a bacterial culture containing 9 × 10⁸ colony forming units (CFU) (15ng) was used to create a standard curve. Serial dilutions were prepared and analyzed as described above. The final concentration of 16S rRNA gene copies in each sample was determined by comparing the resulting Ct of each sample with the standard curve, correcting for dilutions and normalizing to the extracted sample weight.
Escherichia coli absolute quantification
Bacterial load was assessed by measuring the number of 16S copies in each sample using an Escherichia spp. assay (Qiagen) following the manufacturer’s protocol. Reactions were carried out on a QuantStudio 6 Flex Real-Time PCR System using: 5 µL of Microbial qPCR Mastermix, 0.5 µL of the assay, ~100ng of genomic DNA, and PCR grade H2O for a final volume of 10 µL. Thermocycling conditions were: 95°C for 10 minutes, 40 cycles of 95°C for 15 s, 60°C for 2 minutes.
The total DNA extracted from 1 mL of an E. coli culture containing 9 × 10⁸ CFU (15 ng) was used to create a standard curve. Serial dilutions were prepared and analyzed and the final concentration of 16S rRNA gene copies was determined as described above.
16S rRNA sequencing and analysis
Specific primers (S-D-Bact-0341-b-S-17 and S-D-Bact-0785-a-A-21) modified to include Illumina adapters (Illumina, San Diego, CA) were used to amplify the 16S V3/V4 regions.Citation68 Five microliters of extracted DNA was added to a Master Mix (0.5 µL of 10 µM 16S Amplicon PCR Forward primer, 0.5 µL of 10 µM 16S Amplicon PCR Reverse primer, 12.5 µL 2× KAPA HiFi HotStart ReadyMix and 6.5 µL of molecular grade PCR H2O). Amplicon PCR was performed as follows: initial denaturation step at 95°C for 3 minutes, 27 cycles of 95°C for 30 seconds, 55°C for 30 seconds and 72°C for 30 seconds, and a final step of 72°C for 5 minutes followed by hold at 4°C. After the amplicon PCR, an optimized Clean-Up step was performed with Agencourt AMPure XP beads.Citation69 5 µL of the final Amplicon PCR product was used for the Index PCR, which was performed using the Nextera XT Index kit and 2× KAPA HiFi HotStart ReadyMix, following the Illumina protocol,Citation70 for 8 cycles. After a second modified Clean-Up step, library quality was determined using an Agilent 2100 Bioanalyzer System was used to assess library quality. Paired-end sequencing (2×301 cycles) of amplicons was performed on a MiSeq system (Illumina) using the MiSeq reagent v3 Kit, with 600 cycles, and 10% to 15% PhiX (Illumina). 16S sequencing was also performed on DNAs extracted from negative control samples.
Sequences were first trimmed using the ‘Trim Reads’ tool available with CLC Genomics Workbench v.10.1.1 (Qiagen). The trimming step was first performed based on quality scores set to 0.5 and ambiguous nucleotides set to 2 (this option trims the sequence ends based on the presence of ambiguous nucleotides – typically N). Then, a second trimming step was performed to remove remaining adapters in each sequence (the removal of adapters is often done directly on the MiSeq, but in some cases, some adapters remain on the sequenced reads). After trimming, sequences were merged using the ‘Merge Overlapping Pairs’ tool available with CLC Genomics Workbench v.10.1.1 (Qiagen) considering the alignment scores as follows: mismatch cost of 2, gap cost of 3, zero maximum unaligned end mismatches and minimum score of 30.
The Operational Taxonomic Unit (OTU) clustering tool available at CLC Genomics Workbench v.10.1.1 and CLC Microbial Genomics Module v.2.5 (Qiagen) software were used to perform reference-based OTU clustering and taxonomic analyses against the SILVA Database with 97% similarity. Default parameters were used for minimum occurrences and chimera crossover cost, and the creation of new OTUs was not allowed. Low depth samples (<5,000 sequences per sample) were excluded, and microbial alpha diversity (Shannon index) was calculated using the ‘Alpha Diversity’ tool included in the CLC Microbial Genomics Module package. Alpha diversity estimates were calculated from a series of rarefaction analyses using default parameters for minimum depth (set to 1), number of points (set to 20) and replicates at each point (set to 100). Taxonomic levels were not aggregated during alpha diversity analysis. The Bray-Curtis metric was used to calculate the inter-sample variability (beta diversity) using the ‘Beta Diversity’ tool included in the CLC Microbial Genomics Module package. First, the tool estimates the distance between each pair of samples, then once the distance matrix was calculated, the beta diversity analysis tool performed a Principal Coordinate Analysis (PCoA) on the distance matrices. Predictions for significant differentially abundant OTUs between different groups were performed using a rarefied OTU table, singletons, doubletons and OTUs highly detected in blank samples (1 OTU assigned to genus Pseudomonas and 3 OTUs assigned to genus Bacteroides) were removed. OTUs assigned to chloroplasts (phylum Cyanobacteria) were not removed but were monitored throughout the downstream analysis. Multiple comparisons and statistical analyses were performed using CLC Genomics Workbench v.10.1.1, CLC Microbial Genomics Module v. 2.5 (Qiagen).
The OTU table was rarefied to the minimal number of reads assigned to a sample. Using the tool ‘Differential Abundance Analysis’ included in the CLC Microbial Genomics Module packageCitation71, a Negative Binomial GLM model was used to obtain maximum likelihood estimates for the fold change (FC) of an OTU between different groups. FCs were automatic calculated and generated from the GLM, which corrects for differences in library size between the samples and the effects of confounding factors (it is therefore not possible to derive these fold changes from the original counts by simple algebraic calculations). The Wald test was used for determination of significance, and P-values were corrected using False Discovery Rate (FDR). In addition, to identify the most important microbial features characterizing the differences between groups, a Linear Discriminant Analysis Effect Size (LEfSe) was performed using the MicrobiomeAnalyst 2.0 package designed for 16S datasets.Citation72 The software guidelines were followed and features with a linear discriminant analysis (LDA) score higher than 1.5 were reported.
Ileal RNA isolation
Total RNA from host ileal tissues was isolated using an RNeasy Plus Mini Kit (Qiagen) following the supplementary protocol for isolation of total RNA containing microRNA (miRNA), with some modifications. Ileal tissues were thawed at room temperature. Samples were removed from the All Protect Reagent using a sterile forceps and residual reagent was eliminated by rolling the tissue over an optical paper. Approximately 20 mg of ileal tissue was cut and transferred to a sterile 2 mL tube containing RLT Plus buffer and one stainless steel bead (Qiagen). Samples were disrupted and homogenized using a TissueLyzer II for 2 minutes at 30 Hz. After disruption, an optimized two-step DNA removal was applied. In the first step, samples were transferred to a gDNA Eliminator column (Qiagen). After precipitation with 100% ethanol, the eluate was applied to a RNeasy Mini spin column and a second DNA removal step was performed directly on the column membrane using the RNase-Free DNase Set (Qiagen) for 15 minutes at room temperature. DNase I was inactivated with 350 µL RWT buffer (Qiagen). Two washing steps with 500 µL of RPE buffer (Qiagen) were performed and total RNA was eluted with 30 µL of RNase-free water. Total RNA was quantified on NanoDrop One fluorometer (ThermoFisher). RNA integrity was evaluated on an Agilent 2100 Bioanalyzer (Agilent) using the RNA 6000 Nano kit (Agilent).
mRNA and miRNA sequencing
Stranded mRNA libraries were built using the TruSeq stranded mRNA kit (Illumina, San Diego, California) following manufacturer’s instructions. miRNA sequencing libraries were obtained using the Qiaseq miRNA Library Kit (Qiagen, Hilden, Germany) according to the manufacturer’s protocol for tube indices. Libraries were quantified using the KAPA Library Quantification Kit (Roche, Basel, Switzerland) according to the manufacturer’s protocol. Briefly, all final libraries were diluted 1:99 twice, followed by 1:10 dilutions for 4 × . All 1:10 dilutions from each sample (4 dilutions/sample), standards and blank were quantified in triplicate. ROX low was added to the KAPA SYBR FAST qPCR Master Mix (Roche, Basel, Switzerland) containing the Primer Premix for subsequent run on the QuantStudio 12K Flex (Qiagen, Hilden, Germany). Individual libraries with equal molarities were pooled together and the pooled library was prepared for sequencing following instructions from the Standard Normalization Method in the NextSeq 500/550 Sequencing Systems protocol (Illumina). Stranded mRNA 2 × 76 cycles sequencing was performed on a NextSeq 550 machine using a High Output Flow Cell Cartridge 2.5, a NextSeq 500/550 Buffer Cartridge v2 and a NextSeq 500/550 High Output Reagent Cartridge v2 (Illumina). miRNA sequencing was performed on a NextSeq 550 machine using a single High Output Flow Cell Cartridge 2.5, a NextSeq 500/550 Buffer Cartridge v2, and a NextSeq 500/550 High Output Reagent Cartridge v2 for 75 cycles (Illumina).
mRNA sequencing analysis
Data were analyzed by ROSALIND® (https://rosalind.bio/), with a HyperScale architecture developed by ROSALIND, Inc. (San Diego, CA). Fastq files were uploaded and reads were trimmed using cutadapt.Citation73 Quality scores were assessed using FastQC.Citation74 Reads were aligned to the Rattus norvegicus genome build rn6 using STAR.Citation75 Individual sample reads were quantified using HTseq and normalized via Relative Log Expression (RLE) using DESeq2 R library.Citation76,Citation77 DEseq2 was also used to calculate fold changes and p-values and perform optional covariate correction. Hypergeometric distribution was used to analyze the enrichment of pathways, gene ontology, domain structure, and other ontologies. The topGO R library, was used to determine local similarities and dependencies between GO terms in order to perform Elim pruning correction.Citation78 Several database sources were referenced for enrichment analysis, including Interpro, NCBI, MSigDB, REACTOME, WikiPathways.Citation79–84
miRNA sequencing analysis
A subset of 24 rat ileal tissue samples (6 samples/group), representing all 3 microtypes as well as controls, was randomly selected for downstream analysis. Run metrics were obtained from Basespace sequence hub (Illumina) and the fastq files were collected from the Local Run Manager in the Nextseq machine and imported to CLC Genomics Workbench v.20 (Qiagen, Hilden, Germany). For miRNA, sequences were extracted, counted, and analyzed using the Qiaseq miRNA Differential Expression Analysis tool using total UMI reads, grouped on mature. Reads were normalized using the trimmed mean of M-values (TMM) method.Citation85 All groups were compared against the control group (no CdtB exposure). miRNAs were identified based on rat miRBase v22.1 sequences. miRNAs with a minimum of 5 counts per million (CPM) and absolute 1.5-fold change or higher, and a false discovery rate (FDR)<0.1 were considered as statistically significant. mRNA expression data were assessed and reanalyzed for the subset of rats that had their miRNAs sequenced using the same configuration described above in the Rosalind platform (https://rosalind.bio/). mRNAs showing absolute 1.3-fold change and FDR < 0.1 were considered as statistically significant and were used for the identification of miRNA-mRNA interactions. MetaboAnalyst v.5.0 (https://www.metaboanalyst.ca/) was used to obtain the Principal Component Analysis plot. Euclidean distance and average linkage were used for the obtention of heatmaps using Morpheus from the Broad Institute (https://software.broadinstitute.org/morpheus), and Venn diagrams were obtained from the Bioinformatics and Evolutionary Genomics website (https://bioinformatics.psb.ugent.be/webtools/Venn/).
ShinyGO v.0.76Citation86 was used to determine the top 20 biological processes and cellular components associated with the DE genes using the default parameters, no background list, and FDR p-value cutoff = 0.05 for identified terms. A list of DE mRNAs and miRNAs, including their fold change and FDR p-values, was uploaded on Ingenuity Pathway Analysis (IPA, Fall Release 2022) software. A paired analysis was performed to identify miRNA-mRNA interactions. The expression levels of the molecules in the interactions were used to perform a Core Analysis for the identification of canonical pathways and their possible top regulators. Importantly, due to the dynamic nature of miRNA-mRNA interactions,Citation87,Citation88 all expression combinations were considered and exhibited, although miRNA-mRNA pairs with opposite directions and previously identified in the literature had special attention in our discussion. Networks containing expression data matching literature findings and important pathways associated wit IBS were designed to show miRNA-mRNA interactions. In addition to that, a comparison analysis was performed on IPA to compare the groups of rats according to their ileal microbiome and identify the main differences in terms of mechanisms regulated by miRNAs. For the identification of common IBS miRNA targets in our datasets and in the literature, we searched for journal reviews using the terms “irritable bowel syndrome and microRNAs and targets”.
Author contributions
Conceptualization: MP, RM; Formal analysis: GL, AR, MP; Funding acquisition: MP, GMB; Investigation: GL, WM, JFG, GP, MLP, GMB, MJVM, MS, SA, SW, AR, MP; Methodology: GL, JFG, WM, SW, MP; Project administration: RM, MP; Supervision: WM, SW, RM, MP; Visualization: GL; Writing – original draft: GL, GMB, JFG, WM, MP; Writing – review & editing: GL, GMB, JFG, WM, AR, RM, MP.
Statistical analyses for non-high-throughput data
Paired and group analyses were performed using GraphPad Prism 9.1.0 (GraphPad Software) and IBM SPSS Statistics Version 24. Normally distributed data were analyzed with t-test or paired t-test, and data that were not normally distributed were analyzed with Mann-Whitney test or Wilcoxon paired test. Correlations were performed using Spearman’s rank associations.
Supplementary material_CdtB_R3.docx
Download MS Word (5.3 MB)Supplemental File 1.xlsx
Download MS Excel (4.4 MB)Acknowledgments
The authors would also like to thank the following donors for their support: The Gottesdiener foundation, Frank Lee, Joel Levine, the Monica Lester Charitable Trust, the Elias, Genevieve, and Georgianna Atol Charitable Trust, the Tull Family Foundation, Thomas Wurster and David Allen, and the John and Geraldine Cusenza Family Foundation.
Disclosure statement
MP and AR are consultants for, and have received grant support from, Bausch Health Inc. The remaining authors have no relevant conflicts of interest to disclose.
Data availability statement
The datasets generated during this study are available in the National Center for Biotechnology Information (NCBI) BioProject Repository https://www.ncbi.nlm.nih.gov/bioproject under BioProject PRJNA858800.
Supplementary material
Supplemental data for this article can be accessed online at https://doi.org/10.1080/19490976.2023.2293170
Additional information
Funding
References
- Ford AC, Lacy BE, Talley NJ, Longo DL. Irritable bowel syndrome. N Engl J Med. 2017;376(26):2566–25. doi:10.1056/NEJMra1607547.
- Ford AC, Sperber AD, Corsetti M, Camilleri M. Irritable bowel syndrome. Lancet. 2020;396:1675–1688. doi:10.1016/S0140-6736(20)31548-8.
- Sperber AD, Bangdiwala SI, Drossman DA, Ghoshal UC, Simren M, Tack J, Whitehead WE, Dumitrascu DL, Fang X, Fukudo S, et al. Worldwide prevalence and burden of functional gastrointestinal disorders, results of Rome Foundation global study. Gastroenterology. 2021;160:99–114 e3. doi:10.1053/j.gastro.2020.04.014.
- Lacy BE, Mearin F, Chang L, Chey WD, Lembo AJ, Simren M, Spiller R. Bowel disorders. Gastroenterology. 2016;150:1393–1407.e5. doi:10.1053/j.gastro.2016.02.031.
- Pimentel M, Saad RJ, Long MD, Rao SSC. ACG clinical guideline: small intestinal bacterial overgrowth. Am J Gastroenterol. 2020;115:165–178. doi:10.14309/ajg.0000000000000501.
- Shah ED, Riddle MS, Chang C, Pimentel M. Estimating the contribution of acute gastroenteritis to the overall prevalence of irritable bowel syndrome. J Neurogastroenterol Motil. 2012;18:200–4. doi:10.5056/jnm.2012.18.2.200.
- Villanueva-Millan MJ, Leite G, Wang J, Morales W, Parodi G, Pimentel ML, Barlow GM, Mathur R, Rezaie A, Sanchez M, et al. Methanogens and hydrogen sulfide producing bacteria guide distinct gut microbe profiles and irritable bowel syndrome subtypes. Am J Gastroenterol. 2022;117(12):2055–2066. doi:10.14309/ajg.0000000000001997.
- Klem F, Wadhwa A, Prokop LJ, Sundt WJ, Farrugia G, Camilleri M, Singh S, Grover M. Prevalence, risk factors, and outcomes of irritable bowel syndrome after infectious enteritis: a systematic review and meta-analysis. Gastroenterology. 2017;152:1042–1054.e1. doi:10.1053/j.gastro.2016.12.039.
- Takakura W, Kudaravalli P, Chatterjee C, Pimentel M, Riddle MS. Campylobacter infection and the link with irritable bowel syndrome: on the pathway towards a causal association. Pathog Dis. 2022;80:80. doi:10.1093/femspd/ftac003.
- Pimentel M, Chatterjee S, Chang C, Low K, Song Y, Liu C, Morales W, Ali L, Lezcano S, Conklin J, et al. A new rat model links two contemporary theories in irritable bowel syndrome. Dig Dis Sci. 2008;53(4):982–989. doi:10.1007/s10620-007-9977-z.
- Pokkunuri V, Pimentel M, Morales W, Jee S-R, Alpern J, Weitsman S, Marsh Z, Low K, Hwang L, Khoshini R, et al. Role of cytolethal distending toxin in altered stool form and bowel phenotypes in a rat model of post-infectious irritable bowel syndrome. J Neurogastroenterol Motil. 2012;18(4):434–442. doi:10.5056/jnm.2012.18.4.434.
- Pimentel M, Morales W, Pokkunuri V, Brikos C, Kim SM, Kim SE, Triantafyllou K, Weitsman S, Marsh Z, Marsh E, et al. Autoimmunity links vinculin to the pathophysiology of chronic functional bowel changes following Campylobacter jejuni infection in a rat model. Dig Dis Sci. 2015;60(5):1195–1205. doi:10.1007/s10620-014-3435-5.
- Pickett CL, Whitehouse CA. The cytolethal distending toxin family. Trends Microbiol. 1999;7(7):292–297. doi:10.1016/S0966-842X(99)01537-1.
- Morales W, Triantafyllou K, Parodi G, Weitsman S, Park SC, Rezaie A, Pichetshote N, Lin E, Pimentel M. Immunization with cytolethal distending toxin B produces autoantibodies to vinculin and small bowel bacterial changes in a rat model of postinfectious irritable bowel syndrome. Neurogastroenterol Motil. 2020;32:e13875. doi:10.1111/nmo.13875.
- Farzaei MH, Bahramsoltani R, Abdollahi M, Rahimi R. The role of visceral hypersensitivity in irritable bowel syndrome: pharmacological targets and novel treatments. J Neurogastroenterol Motil. 2016;22:558–574. doi:10.5056/jnm16001.
- Sikander A, Rana SV, Prasad KK. Role of serotonin in gastrointestinal motility and irritable bowel syndrome. Clin Chim Acta. 2009;403(1–2):47–55. doi:10.1016/j.cca.2009.01.028.
- Hyland NP, Quigley EM, Brint E. Microbiota-host interactions in irritable bowel syndrome: epithelial barrier, immune regulation and brain-gut interactions. World J Gastroenterol. 2014;20(27):8859–8866. doi:10.3748/wjg.v20.i27.8859.
- Bravo-Vazquez LA, Medina-Rios I, Marquez-Gallardo LD, Reyes-Muñoz J, Serrano-Cano FI, Pathak S, Banerjee A, Bandyopadhyay A, Duttaroy AK, Paul S, et al. Functional implications and clinical potential of MicroRNAs in irritable bowel syndrome: a concise review. Dig Dis Sci. 2023;68(1):38–53. doi:10.1007/s10620-022-07516-6.
- Leite G, Morales W, Weitsman S, Celly S, Parodi G, Mathur R, Barlow GM, Sedighi R, Millan MJV, Rezaie A, et al. The duodenal microbiome is altered in small intestinal bacterial overgrowth. Plos One. 2020;15(7):e0234906. doi:10.1371/journal.pone.0234906.
- Fernandez-Calleja JMS, Konstanti P, Swarts HJM, Bouwman LMS, Garcia-Campayo V, Billecke N, Oosting A, Smidt H, Keijer J, van Schothorst EM, et al. Non-invasive continuous real-time in vivo analysis of microbial hydrogen production shows adaptation to fermentable carbohydrates in mice. Sci Rep. 2018;8(1):15351. doi:10.1038/s41598-018-33619-0.
- Klapholz B, Brown NH. Talin - the master of integrin adhesions. J Cell Sci. 2017;130:2435–2446. doi:10.1242/jcs.190991.
- Parsanathan R, Jain SK. Hydrogen sulfide regulates circadian-clock genes in C2C12 myotubes and the muscle of high-fat-diet-fed mice. Arch Biochem Biophys. 2019;672:108054. doi:10.1016/j.abb.2019.07.019.
- Kim DS, Anantharam P, Padhi P, Thedens DR, Li G. Transcriptomic profile analysis of brain inferior colliculus following acute hydrogen sulfide exposure. Toxicology. 2020;430:152345. doi:10.1016/j.tox.2019.152345.
- Bravo-Vázquez LA, Medina-Ríos I, Márquez-Gallardo LD, Reyes-Muñoz J, Serrano-Cano FI, Pathak S, Banerjee A, Bandyopadhyay A, Duttaroy AK, Paul S, et al. Functional implications and clinical potential of MicroRNAs in irritable bowel syndrome: a concise review. Dig Dis Sci. 2022;68:38–53. doi:10.1007/s10620-022-07516-6.
- Singh R, Zogg H, Ro S. Role of microRnas in disorders of gut–brain interactions: clinical insights and therapeutic alternatives. J Pers Med. 2021;11:11. doi:10.3390/jpm11101021.
- Park C, Lee MY, Slivano OJ, Park PJ, Ha S, Berent RM, Fuchs R, Collins NC, Yu TJ, Syn H, Park J. Loss of serum response factor induces microRNA-mediated apoptosis in intestinal smooth muscle cells. Cell Death Dis 2015;6:e2011.
- Hou Q, Huang Y, Zhang C, Zhu S, Li P, Chen X, Hou Z, Liu F. MicroRNA-200a targets cannabinoid receptor 1 and serotonin transporter to increase visceral hyperalgesia in diarrhea-predominant irritable bowel syndrome rats. J Neurogastroenterol Motil. 2018;24:656–668. doi:10.5056/jnm18037.
- Chao G, Wang Y, Zhang S, Yang W, Ni Z, Zheng X. MicroRNA-29a increased the intestinal membrane permeability of colonic epithelial cells in irritable bowel syndrome rats. Oncotarget. 2017;8:85828–85837. doi:10.18632/oncotarget.20687.
- Nakata K, Sugi Y, Narabayashi H, Kobayakawa T, Nakanishi Y, Tsuda M, Hosono A, Kaminogawa S, Hanazawa S, Takahashi K, et al. Commensal microbiota-induced microRNA modulates intestinal epithelial permeability through the small GTPase ARF4. J Biol Chem. 2017;292(37):15426–15433. doi:10.1074/jbc.M117.788596.
- Mahurkar-Joshi S, Rankin CR, Videlock EJ, Soroosh A, Verma A, Khandadash A, Iliopoulos D, Pothoulakis C, Mayer EA, Chang L, et al. The colonic mucosal MicroRNAs, MicroRNA-219a-5p, and MicroRNA-338-3p are downregulated in irritable bowel syndrome and are associated with barrier function and MAPK signaling. Gastroenterology. 2021;160(7):2409–2422.e19. doi:10.1053/j.gastro.2021.02.040.
- Fourie NH, Peace RM, Abey SK, Sherwin LB, Rahim-Williams B, Smyser PA, Wiley JW, Henderson WA. Elevated circulating miR-150 and miR-342-3p in patients with irritable bowel syndrome. Exp Mol Pathol. 2014;96:422–5. doi:10.1016/j.yexmp.2014.04.009.
- Ye D, Guo S, Al-Sadi R, Ma TY. MicroRNA regulation of intestinal epithelial tight junction permeability. Gastroenterology. 2011;141:1323–33. doi:10.1053/j.gastro.2011.07.005.
- Zhu H, Xiao X, Shi Y, Wu Y, Huang Y, Li D, Xiong F, He G, Chai Y, Tang H, et al. Inhibition of miRNA‑29a regulates intestinal barrier function in diarrhea‑predominant irritable bowel syndrome by upregulating ZO‑1 and CLDN1. Exp Ther Med. 2020;20:155. doi:10.3892/etm.2020.9284.
- Fei L, Wang Y. microRNA-495 reduces visceral sensitivity in mice with diarrhea-predominant irritable bowel syndrome through suppression of the PI3K/AKT signaling pathway via PKIB. Iubmb Life. 2020;72(7):1468–1480. doi:10.1002/iub.2270.
- Zhang Y, Wu X, Wu J, Li S, Han S, Lin Z, Ding S, Jia X, Gong W. Decreased expression of microRNA-510 in intestinal tissue contributes to post-infectious irritable bowel syndrome via targeting PRDX1. Am J Transl Res. 2019;11:7385–7397.
- Tao W, Dong X, Kong G, Fang P, Huang X, Bo P. Elevated circulating hsa-miR-106b, hsa-miR-26a, and hsa-miR-29b in type 2 diabetes mellitus with diarrhea-predominant irritable bowel syndrome. Gastroenterol Res Pract. 2016;2016:1–9. doi:10.1155/2016/9256209.
- Guo J, Lu G, Chen L, Geng H, Wu X, Chen H, Li Y, Yuan M, Sun J, Pei L, et al. Regulation of serum microRNA expression by acupuncture in patients with diarrhea-predominant irritable bowel syndrome. Acupunct Med. 2022;40(1):34–42. doi:10.1177/09645284211027892.
- Gao J, Xiong T, Grabauskas G, Owyang C. Mucosal serotonin reuptake transporter expression in irritable bowel syndrome is modulated by gut microbiota via mast cell–prostaglandin E2. Gastroenterology. 2022;162(7):1962–1974.e6. doi:10.1053/j.gastro.2022.02.016.
- Singh P, Lembo A. Emerging role of the gut microbiome in irritable bowel syndrome. Gastroenterol Clin North Am. 2021;50(3):523–545. doi:10.1016/j.gtc.2021.03.003.
- Higashi T, Arnold TR, Stephenson RE, Dinshaw K, Miller A. Maintenance of the epithelial barrier and remodeling of cell-cell junctions during Cytokinesis. Curr Biol. 2016;26:1829–42. doi:10.1016/j.cub.2016.05.036.
- Goult BT, Zacharchenko T, Bate N, Tsang R, Hey F, Gingras AR, Elliott PR, Roberts GCK, Ballestrem C, Critchley DR, et al. RIAM and vinculin binding to talin are mutually exclusive and regulate adhesion assembly and turnover. J Biol Chem. 2013;288(12):8238–8249. doi:10.1074/jbc.M112.438119.
- Konishi S, Yano T, Tanaka H, Mizuno T, Kanoh H, Tsukita K, Namba T, Tamura A, Yonemura S, Gotoh S, et al. Vinculin is critical for the robustness of the epithelial cell sheet paracellular barrier for ions. Life Sci Alli. 2019;2:e201900414. doi:10.26508/lsa.201900414.
- Yao M, Qiu W, Liu R, Efremov AK, Cong P, Seddiki R, Payre M, Lim CT, Ladoux B, Mège R-M, et al. Force-dependent conformational switch of α-catenin controls vinculin binding. Nat Commun. 2014;5(1):4525. doi:10.1038/ncomms5525.
- Twiss F, Le Duc Q, Van Der Horst S, Tabdili H, Van Der Krogt G, Wang N, Rehmann H, Huveneers S, Leckband DE, De Rooij J, et al. Vinculin-dependent cadherin mechanosensing regulates efficient epithelial barrier formation. Biol Open. 2012;1(11):1128–1140. doi:10.1242/bio.20122428.
- Linsalata M, Riezzo G, D’Attoma B, Clemente C, Orlando A, Russo F. Noninvasive biomarkers of gut barrier function identify two subtypes of patients suffering from diarrhoea predominant-IBS: a case-control study. BMC Gastroenterol. 2018;18:167. doi:10.1186/s12876-018-0888-6.
- Hanning N, Edwinson AL, Ceuleers H, Peters SA, De Man JG, Hassett LC, De Winte BY, Grover M. Intestinal barrier dysfunction in irritable bowel syndrome: a systematic review. Therap Adv Gastroenterol. 2021;14:1756284821993586. doi:10.1177/1756284821993586.
- Shefa U, Kim MS, Jeong NY, Jung J. Antioxidant and cell-signaling functions of hydrogen sulfide in the central nervous System. Oxid Med Cell Longev. 2018;2018:1–17. doi:10.1155/2018/1873962.
- Koh SJ, Choi Y, Kim BG, Lee KL, Kim DW, Kim JH, Kim JW, Kim JS. Matricellular protein periostin mediates intestinal inflammation through the activation of nuclear factor κB signaling. Plos One. 2016;11:e0149652. doi:10.1371/journal.pone.0149652.
- Cui XF, Zhou WM, Yang Y, Zhou J, Li XL, Lin L, Zhang HJ. Epidermal growth factor upregulates serotonin transporter and its association with visceral hypersensitivity in irritable bowel syndrome. World J Gastroenterol. 2014;20:13521–9. doi:10.3748/wjg.v20.i37.13521.
- Crowell MD. Role of serotonin in the pathophysiology of the irritable bowel syndrome. Br J Pharmacol. 2004;141(8):1285–1293. doi:10.1038/sj.bjp.0705762.
- Pyleris E, Giamarellos-Bourboulis EJ, Tzivras D, Koussoulas V, Barbatzas C, Pimentel M. The prevalence of overgrowth by aerobic bacteria in the small intestine by small bowel culture: relationship with irritable bowel syndrome. Dig Dis Sci. 2012;57:1321–9. doi:10.1007/s10620-012-2033-7.
- Leite G, Rezaie A, Mathur R, Barlow GM, Rashid M, Hosseini A, Wang J, Parodi G, Villanueva-Millan MJ, Sanchez M, et al. Defining small intestinal bacterial overgrowth by culture and high throughput sequencing. Clin Gastroenterol Hepatol. 2023. doi:10.1016/j.cgh.2023.06.001.
- Chassaing B, Raja SM, Lewis JD, Srinivasan S, Gewirtz AT. Colonic microbiota encroachment correlates with dysglycemia in humans. Cell Mol Gastroenterol Hepatol. 2017;4:205–221. doi:10.1016/j.jcmgh.2017.04.001.
- Rolhion N, Chassaing B. When pathogenic bacteria meet the intestinal microbiota. Philos Trans R Soc Lond B Biol Sci. 2016;371:371. doi:10.1098/rstb.2015.0504.
- Yang W, Xu HW, Lu XR, Xu Q-F, Tao M-H, Dai Y-M. Overexpression of miR-122 impairs intestinal barrier function and aggravates acute pancreatitis by downregulating occludin expression. Biochem Genet. 2022;60:382–394. doi:10.1007/s10528-021-10106-2.
- Jingushi K, Kashiwagi Y, Ueda Y, Kitae K, Hase H, Nakata W, Fujita K, Uemura M, Nonomura N, Tsujikawa K, et al. High miR-122 expression promotes malignant phenotypes in ccRCC by targeting occludin. Int J Oncol. 2017;51(1):289–297. doi:10.3892/ijo.2017.4016.
- Liu L, Zhu M, Liu X, Fei L, Shen J, Chen D. miR-122-5p regulates the tight junction of the blood-testis barrier of mice via occludin: miR-122-5p can regulate the tight junction. Basic Clin Androl. 2021;31:7. doi:10.1186/s12610-021-00126-8.
- Barbara G, De Giorgio R, Stanghellini V, Cremon C, Corinaldesi R. A role for inflammation in irritable bowel syndrome? Gut. 2002;51 Suppl 1:i41–4. doi:10.1136/gut.51.suppl_1.i41.
- Barbara G, Stanghellini V, De Giorgio R, Cremon C, Cottrell GS, Santini D, Pasquinelli G, Morselli-Labate AM, Grady EF, Bunnett NW, et al. Activated mast cells in proximity to colonic nerves correlate with abdominal pain in irritable bowel syndrome. Gastroenterology. 2004;126(3):693–702. doi:10.1053/j.gastro.2003.11.055.
- Barbara G, Wang B, Stanghellini V, de Giorgio R, Cremon C, Di Nardo G, Trevisani M, Campi B, Geppetti P, Tonini M, et al. Mast cell-dependent excitation of visceral-nociceptive sensory neurons in irritable bowel syndrome. Gastroenterology. 2007;132(1):26–37. doi:10.1053/j.gastro.2006.11.039.
- Holzer P, Holzer-Petsche U. Tachykinin receptors in the gut: physiological and pathological implications. Curr Opin Pharmacol. 2001;1(6):583–590. doi:10.1016/S1471-4892(01)00100-X.
- Tack J, Drossman DA. What’s new in Rome IV? Neurogastroenterol Motil. 2017;29. doi:10.1111/nmo.13053.
- Steinhoff MS, von Mentzer B, Geppetti P, Pothoulakis C, Bunnett NW. Tachykinins and their receptors: contributions to physiological control and the mechanisms of disease. Physiol Rev. 2014;94:265–301. doi:10.1152/physrev.00031.2013.
- Fritz N, Berens S, Dong Y, Martínez C, Schmitteckert S, Houghton LA, Goebel-Stengel M, Wahl V, Kabisch M, Götze D, et al. The serotonin receptor 3E variant is a risk factor for female IBS-D. J Mol Med (Berl). 2022;100(11):1617–1627. doi:10.1007/s00109-022-02244-w.
- Mogilyansky E, Rigoutsos I. The miR-17/92 cluster: a comprehensive update on its genomics, genetics, functions and increasingly important and numerous roles in health and disease. Cell Death Differ. 2013;20(12):1603–1614. doi:10.1038/cdd.2013.125.
- Wu S, Yuan C, Liu S, Zhang Q, Yang Z, Sun F, Zhan S, Zhu S, Zhang S. Irritable bowel syndrome and long-term risk of cancer: a prospective cohort study among 0.5 million adults in UK biobank. Am J Gastroenterol. 2022;117:785–793. doi:10.14309/ajg.0000000000001674.
- Morales W, Rezaie A, Barlow G, Pimentel M. Second-generation biomarker testing for irritable bowel syndrome using plasma anti-CdtB and anti-vinculin levels. Dig Dis Sci. 2019;64:3115–3121. doi:10.1007/s10620-019-05684-6.
- Klindworth A, Pruesse E, Schweer T, Peplies J, Quast C, Horn M, Glöckner FO. Evaluation of general 16S ribosomal RNA gene PCR primers for classical and next-generation sequencing-based diversity studies. Nucleic Acids Res. 2013;41:e1. doi:10.1093/nar/gks808.
- Leite GGS, Morales W, Weitsman S, Celly S, Parodi G, Mathur R, Sedighi R, Barlow GM, Rezaie A, Pimentel M, et al. Optimizing microbiome sequencing for small intestinal aspirates: validation of novel techniques through the REIMAGINE study. BMC Microbiol. 2019;19(1):239. doi:10.1186/s12866-019-1617-1.
- Illumina. 16S metagenomic sequencing library preparation. San Diego, CA: Illumina; 2013. https://support.illumina.com/downloads/16s_metagenomic_sequencing_library_preparation.html.
- Qiagen. CLC Genomics Workbench 23.0.5 product manual. Aarhus, Denmark: Qiagen https://digitalinsights.qiagen.com/
- Lu Y, Zhou G, Ewald J, Pang Z, Shiri T, Xia J. MicrobiomeAnalyst 2.0: comprehensive statistical, functional and integrative analysis of microbiome data. Nucleic Acids Res. 2023;51:W310–W318. doi:10.1093/nar/gkad407.
- Martin M. Cutadapt removes adapter sequences from high-throughput sequencing reads. EMBnet Journal. 2011;17:3. doi:10.14806/ej.17.1.200.
- Andrews S. FastQC: a quality control tool for high throughput sequence data. 2010. http://www.bioinformatics.babraham.ac.uk/projects/fastqc
- Dobin A, Davis CA, Schlesinger F, Drenkow J, Zaleski C, Jha S, Batut P, Chaisson M, Gingeras TR. STAR: ultrafast universal RNA-seq aligner. Bioinformatics. 2013;29:15–21. doi:10.1093/bioinformatics/bts635.
- Anders S, Pyl PT, Huber W. Htseq–a Python framework to work with high-throughput sequencing data. Bioinformatics. 2015;31:166–9. doi:10.1093/bioinformatics/btu638.
- Love MI, Huber W, Anders S. Moderated estimation of fold change and dispersion for RNA-seq data with DESeq2. Genome Biol. 2014;15(12):550. doi:10.1186/s13059-014-0550-8.
- Alexa A, Rahnenfuhrer J. topGO: enrichment analysis for gene ontology. R package version 1.38.1. 2019.
- Mitchell AL, Attwood TK, Babbitt PC, Blum M, Bork P, Bridge A, Brown SD, Chang H-Y, El-Gebali S, Fraser MI, et al. InterPro in 2019: improving coverage, classification and access to protein sequence annotations. Nucleic Acids Res. 2019;47(D1):D351–D360. doi:10.1093/nar/gky1100.
- Geer LY, Marchler-Bauer A, Geer RC, Han L, He J, He S, Liu C, Shi W, Bryant SH. The NCBI BioSystems database. Nucleic Acids Res. 2010;38:D492–6. doi:10.1093/nar/gkp858.
- Subramanian A, Tamayo P, Mootha VK, Mukherjee S, Ebert BL, Gillette MA, Paulovich A, Pomeroy SL, Golub TR, Lander ES, et al. Gene set enrichment analysis: a knowledge-based approach for interpreting genome-wide expression profiles. Proc Natl Acad Sci USA. 2005;102(43):15545–15550. doi:10.1073/pnas.0506580102.
- Liberzon A, Subramanian A, Pinchback R, Thorvaldsdóttir H, Tamayo P, Mesirov JP. Molecular signatures database (MSigDB) 3.0. Bioinformatics. 2011;27:1739–40. doi:10.1093/bioinformatics/btr260.
- Fabregat A, Jupe S, Matthews L, Sidiropoulos K, Gillespie M, Garapati P, Haw R, Jassal B, Korninger F, May B, et al. The reactome pathway knowledgebase. Nucleic Acids Res. 2018;46(D1):D649–D655. doi:10.1093/nar/gkx1132.
- Slenter DN, Kutmon M, Hanspers K, Riutta A, Windsor J, Nunes N, Mélius J, Cirillo E, Coort SL, Digles D, et al. WikiPathways: a multifaceted pathway database bridging metabolomics to other omics research. Nucleic Acids Res. 2018;46(D1):D661–D667. doi:10.1093/nar/gkx1064.
- Robinson MD, Oshlack A. A scaling normalization method for differential expression analysis of RNA-seq data. Genome Biol. 2010;11(3):R25. doi:10.1186/gb-2010-11-3-r25.
- Ge SX, Jung D, Yao R, Valencia A. ShinyGO: a graphical gene-set enrichment tool for animals and plants. Bioinformatics. 2020;36(8):2628–2629. doi:10.1093/bioinformatics/btz931.
- Svoronos AA, Campbell SG, Engelman DM. MicroRNA function can be reversed by altering target gene expression levels. iScience. 2021;24:103208. doi:10.1016/j.isci.2021.103208.
- Salmena L, Poliseno L, Tay Y, Kats L, Pandolfi P. A ceRNA hypothesis: the Rosetta stone of a hidden RNA language? Cell. 2011;146:353–8. doi:10.1016/j.cell.2011.07.014.