
ABSTRACT
We developed MicroKPNN, a prior-knowledge guided interpretable neural network for microbiome-based human host phenotype prediction. The prior knowledge used in MicroKPNN includes the metabolic activities of different bacterial species, phylogenetic relationships, and bacterial community structure, all in a shallow neural network. Application of MicroKPNN to seven gut microbiome datasets (involving five different human diseases including inflammatory bowel disease, type 2 diabetes, liver cirrhosis, colorectal cancer, and obesity) shows that incorporation of the prior knowledge helped improve the microbiome-based host phenotype prediction. MicroKPNN outperformed fully connected neural network-based approaches in all seven cases, with the most improvement of accuracy in the prediction of type 2 diabetes. MicroKPNN outperformed a recently developed deep-learning based approach DeepMicro, which selects the best combination of autoencoder and machine learning approach to make predictions, in all of the seven cases. Importantly, we showed that MicroKPNN provides a way for interpretation of the predictive models. Using importance scores estimated for the hidden nodes, MicroKPNN could provide explanations for prior research findings by highlighting the roles of specific microbiome components in phenotype predictions. In addition, it may suggest potential future research directions for studying the impacts of microbiome on host health and diseases. MicroKPNN is publicly available at https://github.com/mgtools/MicroKPNN.
Introduction
The human gut microbiome plays key roles in human health and diseases. Perturbations of the gut microbiota structure are associated with a variety of human diseases including cancer and inflammatory bowel disease. Using microbial markers (genes, species, or pathways) that are differential between healthy individuals and patients, predictive models with promising accuracy have been built for predicting host phenotypes based on microbiome data.Citation1,Citation2 For example, gut microbiome composition was recently shown to be predictive of patient response to statins (the most common type of prescription drug which can lower cholesterol levels and reduce the risks of stroke and heart attack) and showed that Bacteroides-enriched individuals have a higher risk of statin-induced metabolic disruption.Citation3
Microbiome-based human host phenotype prediction has benefited from the recent advances in Machine Learning (ML) and Artificial Intelligence (AI) algorithms. SIAMCAT is a machine learning toolbox developed to address the issues related to ML algorithms in microbiome studies such as poor generalization.Citation4 Goallec et al.Citation2 showed that the prediction accuracy depended on the choice of ML algorithms and types of metagenomic data and presented a computational framework for inferring microbiome-derived features for host phenotype predictions. This paperCitation5 demonstrated the benefit of building multi-disease models to achieve accurate microbiome-based predictive models for human phenotype prediction.
Deep learning methods including various autoencoders were also exploited for learning the representation of quantitative microbiome profile in a lower dimensional latent space, which were then used for building predictive models for host disease prediction.Citation6 DeepMicroCitation6 took advantage of recently developed autoencoders, including shallow autoencoder (SAE), deep autoencoder (DAE), variational autoencoder (VAE), and convolutional autoencoder (CAE), to achieve a low-dimensional representation from high-dimensional microbiome profile. Various machine learning classification algorithms (SVM, random forest, and MLP) were then applied on the learned representation for prediction. DeepMicro was shown to perform well as tested on six different disease datasets. However, the results showed that the performance of the various autoencoders varied.
Considering that microbial species are phylogenetically related, there are a few attempts that tried to incorporate the phylogenetic relationship in the deep learning models for microbiome-based prediction. Ph-CNNCitation7 and PopPhy-CNNCitation8 are two of such approaches that share similar core ideas to represent species or OTU abundance profiles in 2D matrices such that the phylogenetic relationship among the species/OTUs are retained to some extent in the 2D matrices. These two approaches differ in how they achieve this goal. Ph-CNN uses the patristic distance between species/OTUs (computed from the tree) together with a sparsified version of multidimensional scaling to embed the phylogenetic tree in a Euclidean space. PopPhy-CNN prepares the 2D matrix representing the phylogenetic tree populated with the relative abundance of microbial taxa in a metagenomic sample, such that, for a given row, the children of the nodes from that row are selected and their abundances are placed in the subsequent row in the order that their parents appear, starting with the left-most column. EPCNNCitation9 is a more recent effort that uses an ensemble strategy utilizing different microbial features and taxonomic representation for microbiome-based prediction, aiming to reduce overfitting. EPCNN transforms input abundance profiles of known and unknown microbial organisms into matrices according to different taxonomic representations, which are then converted into grayscale images, and fed into a network containing multiple 2D convolutional and max pooling layers followed by fully connected layers.
Despite the success of applying deep-learning approaches to build microbiome-based predictors, the downside of these algorithms is the lack of interpretability due to their black-box nature. To overcome this issue, we designed a neural network architecture (MicroKPNN) that incorporates various microbial relationships (metabolic, phylogenetic, and community) in the model to improve the performance of microbiome-based prediction and interpretability of the models. Using this prior-knowledge guided neural network, we can examine which microbial relationship plays important roles in the prediction of host health status.
Our MicroKPNN is inspired by the KPNN approach,Citation10 a deep learning approach for interpretable deep learning and biological discovery and designed to predict human cell state from single-cell RNA-seq data in deep neural networks that are constructed based on biological knowledge. In KPNN, each node corresponds to a human protein or a gene, and each edge corresponds to a regulatory relationship that has been documented in biological databases. A notable difference between MicroKPNN and KPNN is that MicroKPNN uses a shallow neural network, with only one hidden layer, allowing a more straightforward interpretation of predictions and examination of the importance of prior knowledge and microbial relationship for prediction.
Gut microbes interact among themselves and with hosts. Various metabolic activities in the gut attribute to the interactions. The gut microbiota makes an important contribution to human metabolism by contributing enzymes that are not encoded by the human genome, for example, the breakdown of polysaccharides and polyphenols, and the synthesis of vitamins.Citation11 Gut microbes can also break down host-derived substrates such as mucins. Among microbial community members, competitive relationships may be formed if microbes compete for the same resources, and they may also form cooperation relationships via metabolic cross-feeding in a shared environment.Citation12,Citation13 Comparison of predicted metabolic-interactions and species co-occurrence patterns suggested that habitat-filtering shapes the gut microbiome.Citation12 Using literature mining, Sung et al.Citation14 curated an interspecies network of the human gut microbiota (called NJS16) comprising hundreds of microbial species and three human cell types metabolically interacting through >4,400 small-molecule transport (import or export) and macromolecule degradation events. Metabolic activities have been used for providing explanations for observed differential species/genes, for example; however, they have not been explicitly used in predictive models.
Microbial organisms form communities. Metagenomic co-occurrence has been widely applied in metagenomic studies to construct microbiome networks and better understand microbiome community structures.Citation15–17 We have recently inferred networks of microbial networks using metagenomic co-occurrence approach, taking advantage of the availability of many gut metagenomic sequencing datasets derived from healthy and diseased individuals, and recent methodology advances in network inference that can deal with sparse compositional data.Citation18 From the networks, communities of microbes were identified. In this paper, we ask if such community information can be utilized to improve microbiome-based host phenotype prediction.
We developed MicroKPNN, to incorporate metabolic activities and community information of gut microbes, in addition to their phylogenetic relationship, in constrained neural networks for microbiome-based prediction of host phenotype. We tested MicroKPNN on seven microbiome datasets derived from cohorts of individuals with different phenotypes and compared its performance with other approaches. We showed that it achieved comparable performance across all datasets with the state of the art phenotype predictors including deep learning approaches DeepMicro and EPCNN which involve much more complex network architectures. Remarkably, MicroKPNN achieved even better accuracy than the existing approaches for diseases including liver cirrhosis, inflammatory bowel disease (IBD), and obesity. We showed that due to the shallow nature of our models, and the fact that hidden nodes carry biological meanings, MicroKPNN provides interpretability that was missed by the existing deep learning approaches.
Results
MicroKPNN is based on a neural network, in which a hidden layer contains different groups of nodes, representing metabolites, taxa, communities, and fully connected hidden nodes (see Methods). It was applied to seven datasets associated with various diseases including Inflammatory Bowel Disease (IBD), Type 2 Diabetes (T2D), liver cirrhosis, colorectal cancer, and obesity (see and Methods). Below, we first show the results concerning the optimization of the Neural Network (NN) structure for the different diseases. We further compared MicroKPNN’s performance with existing approaches. Finally, we used case studies to demonstrate the interpretability of MicroKPNN.
Table 1. Summary of human gut microbiome datasets used for disease state prediction.
Optimization of the neural network structure for the different diseases
We used different combinations of taxonomic ranks and the number of hidden nodes to see which setting resulted in the most accurate predictions. The area under the receiver operating characteristics curve (AUC) was used for performance evaluation. summarizes the best performance of the MicroKPNN on the seven datasets and the corresponding configuration of the NN architecture. For example, the best NN predictor trained on EW-T2D contains 309 total nodes in the hidden layer, including 34 nodes representing different orders of the bacterial species, and 10 fully connected hidden nodes. shows the impacts of the different parameters on the performance of the prediction of T2D (EW-T2D). MicroKPNN gave an almost perfect prediction for cirrhosis as shown in , suggesting the significant differences in the bacterial composition of the cirrhosis patients compared to healthy controls.
Figure 1. Impacts of the hyperparameters on the MicroKPNN performance for the EW-T2D dataset.
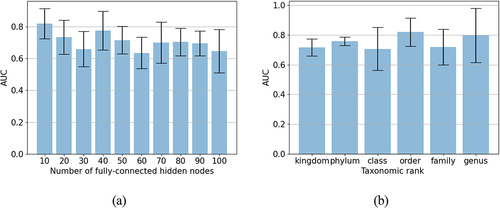
Table 2. Summary of best performing neural network architecture for each dataset and their average AUC.
also shows that different taxonomic ranks have different impacts on the performance of the predictors, depending on the diseases. For example, using taxonomic information at the order level gave the best performance for T2D prediction (EW-T2D), whereas for obesity, using genus in the hidden layer gave the best prediction comparing to other taxonomic ranks. Although there is no single taxonomic rank that performed the best across all different diseases, genus in general, gave a relatively good performance. shows the performance of MicroKPNN that uses genus together with 100 fully connected hidden nodes (referred as MicroKPNN-g100 in the table) on the various datasets.
Table 3. Comparison of MicroKPNN with different methods including NNs that are fully connected (fc-NN) in averaged AUC and standard deviation (in parenthesis).
We further tested the impact of the different groups of hidden nodes on the performance of MicroKPNN by dropping one group, so using only the other three groups of nodes to build the models. We observed performance degradation across datasets. For example, for colorectal cancer prediction, MicroKPNN’s performance dropped from AUC of 0.914 to 0.694 (without taxonomic nodes), 0.731 (without community nodes), and 0.688 (without metabolite nodes), and 0.761 (without fully connected hidden nodes), respectively. Supplementary Table S1 shows the details of the results.
Finally, Supplementary Table S2 shows the impacts of the other hyperparameters including the learning rate, dropout rate, and the lambda parameter (for L2 regularization) on the MicroKPNN’s performance. Overall, the comparison showed that the fine tuning of these parameters helped improve the prediction accuracy; however, their impacts (as measured in AUC) were moderate: there was no difference or the difference was very small on these datasets: IBD, C-T2D, Cirrhosis and Obesity-multi, whereas the impact was moderate on EW-T2D, Colorectal and Obesity datasets.
Comparison of MicroKPNN with fully connected NN and existing deep learning predictors
shows the comparison of MicroKPNN with the fully connected NN (without the guide of prior knowledge) and two existing state-of-the-art deep learning approaches for microbiome-based prediction (DeepMicro and EPCNN) in AUC. shows the comparison between MicroKPNN and DeepMicro in other metrics (MCC and AUC-PR), and Supplementary Table S3 shows the performance of conventional ML methods (SVM, RF and Elastic Net without using any autoencoders). For comparison, we also showed the model complexity in Supplementary Table S4. From these results, we observed that MicroKPNN achieved drastic performance improvements comparing to NN without constraining the network connection according to the prior knowledges (i.e., fully connected NN with the same number of nodes in the hidden layer as the corresponding MicroKPNN) on four out of the seven datasets: IBD, EW-T2D, Colorectal, and Obesity (the improvement on the T2D, Cirrhosis, and Obesity-multi dataset were modest). We note that the comparison of the two implementations of the fully connected NNs suggested that the fully connected MicroKPNN had better performance on five out of the seven cases; however, fully connected (keras) had better performance on IBD and EW-T2D.
Table 4. Comparison of MicroKPNN with DeepMicro in additional metrics (MCC and AUC-PR).
MicroKPNN outperformed DeepMicro and EPCNN, two of the most recent deep learning ML approaches, on six out of the seven datasets (IBD, EW-T2D, Cirrhosis, Colorectal, Obesity and Obesity-multi), and achieved worse but still good AUC on C-T2D dataset. MicroKPNN outperformed DeepMicro in all seven cases. We note DeepMicro tries different representation deep learning approaches and ML algorithms (RF, SVM and MLP) and reports the best AUCs. We also note that DeepMicro may either use species abundance or gene abundance as the input, and here we focus on comparison with DeepMicro using species abundance. EPCNN were based on predictors also trained using species abundances information, but there are differences: EPCNN uses both known and unknown species and the quantification was achieved using Micropro.Citation25 Both DeepMicro and EPCNN were based on complex deep learning models: DeepMicro used the various autoencoders (SAE, DAE, VAE, and CAE), and EPCNN used multiple convolution layers. By contrast, MicroKPNN’s model is a much simpler neural network with only one hidden layer (see Supplementary Table S4 for a comparison of the model complexity), and in combination with the use of nodes with different biological meanings in the hidden layer (which provide good interpretability of the models see below), we believe MicroKPNN’s performance is very encouraging.
MicroKPNN’s accuracy for the Obesity dataset is the lowest among all datasets; however, its AUC (0.728) is significantly greater than the AUCs achieved by other approaches, including DeepMicro using species abundance profile as the input (AUC = 0.674) (DeepMicro achieved an AUC of 0.650 when it used the gene profile instead of species profile as the input for prediction). The results suggest that the microbiome difference is more subtle between healthy controls and patients with obesity comparing to other phenotypes.
The predictor trained using datasets from multiple studies (Obesity-multi) achieved much more accurate predictions of obesity comparing to the predictor built from a single study (Obesity). We attribute the improvement (AUC of 0.891 vs 0.728) to using more datasets from multiple studies, among others (e.g., using a different approach for taxonomic assignment and quantification). It also suggests that when datasets from different studies become available, it is beneficial to include all of them to improve the accuracy of the predictive models and perhaps make the predictive models more generalizable. For comparison, DeepMicro’s average AUC is 0.763 on this dataset.
Finally, comparing to DeepMicro and fully connected NNs, MicroKPNN tends to have smaller standard deviation of AUC (MicroKPNN had smaller standard deviation than DeepMicro in six out of seven cases; see for details). Comparison of the model complexity (Supplementary Table S4) showed that MicroKPNN had significantly fewer parameters comparing to the fully connected neural networks, a result of the design of MicroKPNN. In addition, MicroKPNN had significantly fewer parameters than DeepMicro for most of the datasets (exceptions are C-T2D and Obesity-multi). For example, the predictive models for IBD contained about 48k, 258k and 230k parameters using MicroKPNN, DeepMicro, and fully connected NN, respectively.
Impacts of the sample size on MicroKPNN’s performance
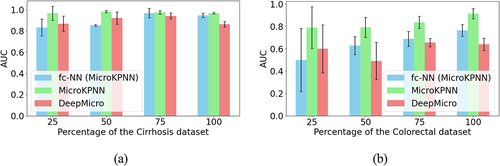
We carried out downsampling experiments to show how sample sizes impacted the different predictive models. shows the results of three methods (MicroKPNN, DeepMicro and the fully connected NN) when different numbers of samples were used (25%, 50%, 75% of the total samples for each dataset) for training and testing (using the same 60:20:20 splitting). For Cirrhosis prediction, the results showed that all three methods tend to give less accurate predictions with higher standard deviation when fewer samples were used; however, even when only 25% of the samples were used (232 × 25% = 58 samples), all methods still achieved reasonable results with AUC > 0.8. By contrast, for colorectal cancer prediction, since the original dataset only had 121 samples, we observed that all methods had significant decrease in their performances when only 50% or 25% of the samples were used. Among the three methods, MicroKPNN had the least drop of its performance and still achieved reasonable results (average AUC = 0.791; standard deviation = 0.090) when 50% of the samples were used. When only 25% of the samples were used, the average AUC achieved by MicroKPNN was still reasonable (average AUC = 0.790); however, the standard deviation was increased significantly (0.186) comparing to the cases when more samples were used. Combining all the results, we considered that MicroKPNN would give reasonable results (AUC and standard deviation) when roughly 60 samples were available.
Figure 2. Impacts of the downsampling of samples on the different approaches for selected datasets.
Interpretability of MicroKPNN
We used the node weights as measures of the importance of the corresponding nodes (metabolic activity, taxonomic rank, community of species, and fully connected hidden nodes) and therefore to provide an explanation of the impacts of the inputs (the species) on the prediction. By examining the importance scores of the hidden nodes, we could compare the contribution of the different groups of nodes to the prediction. shows the boxplots of the importance scores of the most important nodes in each group for the different diseases. The comparison shows that the different groups of hidden nodes contributed differentially to the prediction of different diseases. The metabolite nodes had significant contributions to the prediction of some diseases, though to a different extent in different datasets. The notable example is cirrhosis prediction, in which the metabolite nodes contribute obviously more than the community and taxon nodes to the performance (see ). The importance scores of the individual nodes in the hidden layer also provide a way for suggesting biologically meaningful explanations to the microbiome-based predictors. Supplementary Figure S1 shows the importance scores of the hidden nodes for microbiome-based host phenotype predictions for cirrhosis and obesity. Here, we focused on the obesity prediction (trained using the Obesity-multi dataset) as an example to demonstrate the application, considering that this dataset has the most number of samples for training. We tried two different ways to estimate the importance scores of the hidden nodes, using the edge weights (our method) and the differential node weights as in KPNN,Citation10 in which the node weights on the real datasets were normalized by the weights computed from the control inputs, simulated inputs assuming all nodes are equally important. lists the top five taxa and metabolic activities that were predicted by MicroKPNN according to the edge weights. It shows that the two approaches (edge weights and different node weights) gave relatively consistent estimates of the importance of the nodes (i.e., they resulted in similar in-group ranks and overall ranks). The results also suggested that comparison of importance scores of the hidden nodes across different groups (e.g. a metabolic activity versus a taxon) need to be cautiously done due to their network connectivity differences (notice the discrepancy of the in-group and overall ranks of the metabolic activities).
Figure 3. Contributions of the different groups of hidden nodes to the prediction as measured by importance scores. (a) IBD; (b) EW-T2D; (c) C-T2D; (d) obesity; (e) cirrhosis; (f) colorectal cancer. The boxes in different colors with whiskers show the distribution of the importance scores of the hidden nodes in different groups.
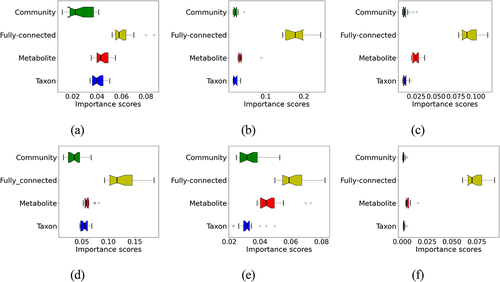
Table 5. Ranks of taxonomic groups (orders) and metabolic activities that are potentially important for microbiome-based obesity prediction.
Three of the five top metabolic activities revealed by MicroKPNN () were reported previously to be associated with obesity, including decreased nitrogen disposal (ammonia formation) in obese,Citation26 acetate’s modulation of body weight through different mechanisms,Citation27 and altered lactate metabolism in obesity microbiota.Citation28 It is well known that bacteria produce intermediate fermentation products including lactate, but these are normally detected at low levels in feces from healthy individuals due to extensive utilization of them by other bacteria.Citation11,Citation29 Among the taxa that were predicted to be important for obesity prediction, Pseudomonadales order was the top one predicted by MicroKPNN, and significant increase in Pseudomonadales order was found in obese adult subjects.Citation30
Discussion
MicroKPNN uses a relatively simple architecture compared to approaches including DeepMicro, EPCNN and fully connected NNs, but by leveraging on prior knowledge of microbial species, it provides promising predictions of host phenotype based on microbiome composition as shown on all seven datasets. Comparison of the importance scores of different prior knowledge showed that the metabolic activities had the largest impact on the performance of predictions. The difference between the relative importance scores of the hidden nodes with that of the fully connected nodes indicates the knowledge gap between the microbial species and their interaction with human hosts. For colorectal cancer, it was mostly the fully connected nodes that contributed to the prediction, indicating that although the predictor has a good AUC of 0.914, the existing knowledge about the metabolic potential and bacterial interactions has limited value for interpreting the prediction of colorectal cancer based on the microbiome.
We note that in KPNN, the importance scores of the nodes (input nodes and hidden nodes) are normalized by (i.e., subtracted from) the importance scores of the nodes when control inputs (simulated inputs assuming all nodes are equally important) were used in training, to adjust for the impacts of uneven connections between the nodes. In KPNN, the connections between the nodes represent the regulatory relationship among the proteins/genes, and some hidden nodes have drastically more incoming links than others. We compared such a subtraction approach with our importance scores computed from actual data for the interpretation and our results showed these two methods gave consistent importance scores. We consider that the network bias is less of a problem for our microbiome-based predictions compared to KPNN. In the MicroKPNN network, the connections between the input nodes and the hidden nodes with meanings (community, metabolites, and taxon) are all very sparse, with one link from each input node to a taxon node, one link from an input node to a community node (one node belongs to one community), and a small number of links from each input node to a metabolite node. Therefore, we believe the comparison of the importance scores of the nodes especially within each group provides some useful information for interpretation, but cautious are still desired. On the other hand, the fully connected hidden nodes have more incoming links compared to other groups of hidden groups, so the importance scores (based on edge weights) of these hidden nodes as shown in could be overestimated.
Our results showed that there was no single combination of taxonomic rank and the number of fully connected hidden nodes that achieved best performance across all the datasets/diseases. On one hand, this potentially reduces the generalization capability of our predictive models. However, on other hand, it could reveal biological factors that are important for such predictions and they could be different for different diseases/cohorts.
The predictive models we built in this work are based on species abundance. It has been shown (including our own work) that using bacterial genes typically (not always) results in better predictive models.Citation2,Citation31 Nevertheless, our knowledge-primed MicroKPNN’s was able to fill in some of the gaps between species-based and gene-based predictions. For example, among the seven datasets that we tested, DeepMicro using gene markers as the inputs significantly outperformed DeepMicro based on species abundance for IBD prediction (AUC = 0.955 vs AUC = 0.873) and Cirrhosis (AUC = 0.940 vs AUC = 0.888).Citation6 MicroKPNN achieved comparable performance as DeepMicro using gene markers for IBD prediction, with AUC = 0.954 and even outperformed DeepMicro using gene markers for cirrhosis prediction (AUC = 0.969). A future direction of our work is to expand MicroKPNN so that it can take gene abundance as the input for microbiome-based prediction. We anticipate that more complex architecture will need to be adopted to incorporate the prior knowledge, for example, multiple layers of hidden nodes to capture the hierarchical relationship of the genes.
Methods
Collection of the human gut metagenomic samples
We first used the same six datasets as those used for developing ML models including MetAML,Citation32 DeepMicroCitation6 and EPCNN.Citation9 summarizes the six datasets and the diseases they represent. For fair comparison, we used the species profile abundance data downloaded from the DeepMicroCitation6 GitHub repository at https://github.com/minoh0201/DeepMicro. The species abundance profiles for these six datasets were estimated by MetaPhlAn2.Citation33 The species-level relative abundance profile consists of real values in [0,100] representing the percentages of the species in the total observed species for a sample (the numbers sum up to 100%) for each sample.
In addition, we used metagenomic datasets associated with obesity from 15 studies in an attempt to showcase the application of our tool (this collection is referred to as Obesity-multi in ). The metagenome datasets were downloaded from NCBI SRA and were analyzed using the Kraken+Bracken approachCitation34 to derive taxonomic assignments and quantification. See more details of the datasets and data processing in.Citation18 The list of datasets and their abundance profiles are available in the MicroKPNN github repository (see Implementation below).
MicroKPNN adopted the normalization of the abundance profiles that is used by KPNN, i.e., the abundances of the species were log transformed and then normalized for abundances to a maximum value of one and a minimum value of zero. Log normalization can be particularly useful when dealing with skewed or highly variable microbiome data.Citation35 This approach helps to mitigate the impact of extreme values and achieve a more balanced distribution of feature values. Our results showed that such a normalization resulted in good performance, and Supplementary Table S4 shows a comparison of the performance of MicroKPNN when the original relative abundance was used and when a different normalization method was used.
Network structure
The main idea of MicroKPNN is to use prior knowledge to constrain the links between the nodes in the neural network, similar to the knowledge-primed neural networks (KPNN) method.Citation10 Different from KPNN, MicroKPNN is a neural network that is constructed according to the prior knowledge of the bacterial species to improve host phenotype prediction using microbiome data. In MicroKPNN, hidden nodes have biological meanings, such as taxa, and every edge has a relation interpretation. This network offers insights into not only the importance of individual microbial species and the consequent impact of the microbiota on the host but also the importance of taxonomic and metabolic variations relevant to host phenotypes.
Specifically, MicroKPNN uses a neural network that has three layers (see ): the input layer, one hidden layer, and the output layer. Our results (see Results) show that such a shallow network does not sacrifice good performance compared to the deep learning approaches that have been developed for microbiome-based prediction. The input layer is species abundance derived from human gut microbiome samples. The hidden layer includes four different groups of nodes (shown in different colors in ):
Figure 4. The neural network structure used in MicroKPNN. It is composed of three layers (shown on the left). In the input layer, each node is a species, and the hidden layer includes nodes of four different groups: metabolites (red), taxa (blue), communities (green), and fully connected hidden nodes (gray). The links between the input nodes and the nodes in the hidden layer represent different biological meanings (shown on the right).
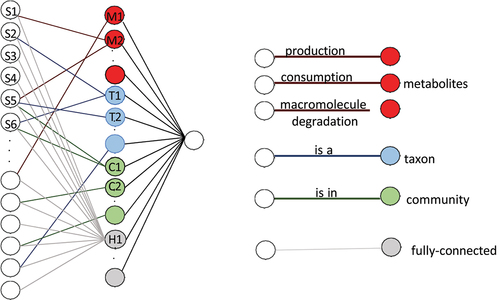
Metabolites. This part of the network architecture encompasses the relationships among gut microbial species and chemical compounds. Since microbial species have different metabolic capabilities with some being the producers of certain metabolites and others being the consumers of certain metabolites, each metabolite may be represented as two nodes in the hidden layer. One node for the metabolite has edges coming from the producer species in the input layer, whereas the other node has edges coming from the consumer species. For example, there are two nodes of L-lactate in the hidden layer (L-lactate consumption and L-lactate production), and there are edges connecting the producers (such as Bacteroides ovatus) with L-lactate production, and there are edges connecting the consumers (such as Acetobacter pasteurianus) with L-lactate consumption. In addition, many bacterial species can degrade macromolecules including mucin (mucus glycoprotein) and cellulose, and edges will be added to connect the bacterial species and the corresponding macromolecules in the hidden layer. For example, many microbes including Bacteroides fragilis can degrade mucin and utilize it as a nutrient source for growthCitation36,Citation37 and therefore edges will be created connecting the mucin-degraders and mucin.
Taxa. MicroKPNN uses a much simpler approach for encoding the phylogenetic relationship as compared to the previous deep-learning approaches that use phylogenetic information (such as Ph-CNN). The NCBI hierarchical taxonomyCitation38 is used to encode the taxonomic relationship. For example, if Bacteroides (a genus) is a node in the hidden layer, all the species in the input layer that belong to this genus will have an edge to this hidden node. MicroKPNN will try different taxonomic ranks including genus, order, class, and phylum (a hyperparameter in the model), and the rank that results in the best performance will be selected.
Communities. Each node represents a community, and all species that are part of the community have an edge connecting to the node. The communities were computationally inferred using the Leiden algorithmCitation39 from a species co-occurrence network.Citation18
Fully connected hidden nodes. Unlike the nodes in the above three groups that have corresponding biological meanings, these fully connected (unknown) nodes are added to alleviate the potential problem of losing information due to incomplete prior knowledge. This part of the network is fully connected, i.e., there is a link between every input node and every hidden node in this group. The number of fully connected hidden nodes is another hyperparameter in our model.
Given an input (and the taxonomic rank and the number of fully connected hidden nodes), MicroKPNN will dynamically create the corresponding network according to the species composition found in the input. For example, a particular metabolite will be included as a hidden node, if at least one of the species included in the input can produce or consume the metabolite, and corresponding edges will be added between the species and the hidden node; similarly, a particular community will be included in the hidden layer, if at least one of its component member is found in the input.
Implementation
We adapted KPNN for the training and application of the neural network for microbiome-based host phenotype prediction. KPNN workflow was implemented in python (3.7.13), using TensorFlow for NN training. Here are the settings for training in KPNN: edge weights randomly initialized, a sigmoid activation function for all hidden and output nodes, and a weighted cross-entropy with L2 regularization as the loss function. We added Python scripts that can be used to prepare the network constraints to KPNN for microbiome applications. The network constraints are encoded using a list of edges between the species in the input layer and the nodes in the hidden layer: metabolic edges are created according to the NJS16 metabolic network,Citation14 community edges are inferred based on the network file (in the standard gml format) of microbial communities,Citation18 and the taxonomic edges are created according to the NCBI taxonomy. For clarity, we called our adopted version of KPNN for microbiome-based prediction as MicroKPNN, which is available as a GitHub repository at https://github.com/mgtools/MicroKPNN.
Fully connected neural networks without using prior knowledge
To show the importance of including the prior knowledge as the constraints for prediction in MicroKPNN, we also implemented fully connected neural networks (fc-NNs) without using the prior knowledge for comparison. We used two implementations of fully connected NNs. The first one is fc-NN (keras), our implementation of NN using the Keras library.Citation40 The second one is fc-NN (MicroKPNN), MicroKPNN including only the fully connected nodes in the hidden layer. We note the difference between the two implementations is that the latter has extra processes including early stopping and dropout that are inherited from KPNN. For fair comparison, in fully connected neural networks, the number of hidden nodes is set to be the same as the total number of hidden nodes (including the hidden nodes with biological meanings and the fully connected hidden nodes) in the best performing setting of MicroKPNN for each dataset, resulting in a consistent number of hidden nodes across MicroKPNN and fully connected NNs for each prediction.
Training, evaluation, and interpretation
For each dataset, we split data into training, validation, and test sets in the ratio of 6:2:2 with a given random partition seed, keeping the ratio between classes in both training and test set to be the same as that of the given dataset. This procedure was repeated five times by changing the random partition seed at the beginning of the training and testing procedure for model selection and evaluation (accuracy and standard deviation). Note that the test set was withheld from training the model to avoid overestimation of the performance. There are two hyperparameters that are unique to MicroKPNN, the taxonomic rank and the number of fully connected hidden nodes (the number of metabolite nodes and the number of community nodes are fixed). We tested the following taxonomic ranks: kingdom, phylum, class, order, family, or genus. For fully connected hidden nodes, we tried 10, 20, 30, 40, 50, 60, 70, 80, 90 and 100 for each dataset. In total, we considered 60 different combinations of taxonomic rank and number of hidden nodes. The combination that resulted in the best performance (on the test set) will be selected, similarly to DeepMicro (which considered different combinations of autocoders and ML approaches). We note that MicroKPNN also inherited from KPNN other hyperparameters including learning rate, L2 regularization, and the two hyperparameter (minimum percent improvement on the validation set error required to save a model, and number of allowed failed learning epochs) for early stopping. These hyperparameters were chosen based on the performance on the training and validation sets. Here are the possible values for MicroKPNN to choose from: the learning rate (0.0001, 0.001, 0.01, 0.1, 0.5, 1), the lambda parameter for the L2 regularization (0.001, 0.01, 0.1, 0.2, 1), and the dropout rate of the hidden nodes (0, 0.1, 0.2, 0.3, 0.4).
The area under the receiver operating characteristics curve (AUC) was used for performance evaluation. Additional metrics include AUC-PR (the area under the precision-recall curve) and MCC (Matthews Correlation Coefficient). MCC is high only if the prediction obtained good results in all of the four confusion matrix categories (true positives, false negatives, true negatives, and false positives).
The predictive models once trained were analyzed to calculate node weights as a reflection of node importance for the predictions. KPNN applied small perturbations to each hidden node separately and measured changes in network output, thus quantifying the importance of each node to the output of the network. Because the sign of the resulting node weights is largely arbitrary, KPNN uses the absolute value of the node weights as a measure of the importance of each node in the trained KPNNs. Similarly in MicroKPNN, we used the absolute value of the outgoing edge weights to quantify the importance of associated nodes in the hidden layer. We used the average of the importance scores from 50 repeated runs to quantify the importance of the nodes. In addition, we used the differential node weights as in KPNNCitation10 to quantify the importance scores, and compared the results of using these two different important scores.
supp.docx
Download MS Word (79.6 KB)Disclosure statement
No potential conflict of interest was reported by the author(s).
Data availability statement
MicroKPNN is available as an open source repository at https://github.com/mgtools/MicroKPNN.
Supplementary material
Supplemental data for this article can be accessed online at https://doi.org/10.1080/19490976.2024.2302076
Additional information
Funding
References
- Qin N, Yang F, Li A, Prifti E, Chen Y, Shao L, Guo J, Le Chatelier E, Yao J, Wu L. et al. Alterations of the human gut microbiome in liver cirrhosis. Nature. 2014;513(7516):59–14. doi:10.1038/nature13568.
- Le Goallec A, Tierney BT, Luber JM, Cofer EM, Kostic AD, Patel CJ, Segata N. A systematic machine learning and data type comparison yields metagenomic predictors of infant age, sex, breastfeeding, antibiotic usage, country of origin, and delivery type. PLoS Comput Biol. 2020;16(5):e1007895. doi:10.1371/journal.pcbi.1007895.
- Wilmanski T, Kornilov SA, Diener C, Conomos MP, Lovejoy JC, Sebastiani P, Orwoll ES, Hood L, Price ND, Rappaport N. et al. Heterogeneity in statin responses explained by variation in the human gut microbiome. Med. 2022;3(6):388–405.e6. doi:10.1016/j.medj.2022.04.007.
- Wirbel J, Zych K, Essex M, Karcher N, Kartal E, Salazar G, Bork P, Sunagawa S, Zeller G. Microbiome meta-analysis and cross-disease comparison enabled by the SIAMCAT machine learning toolbox. Genome Biol. 2021;22(1):1–27. doi:10.1186/s13059-021-02306-1.
- Su Q, Liu Q, Lau RI, Zhang J, Xu Z, Yeoh YK, Leung TWH, Tang W, Zhang L, Liang JQY. et al. Faecal microbiome-based machine learning for multi-class disease diagnosis. Nat Commun. 2022;13(1):1–8. doi:10.1038/s41467-022-34405-3.
- Oh M, Zhang L. DeepMicro: deep representation learning for disease prediction based on microbiome data. Sci Rep. 2020;10(1):1–9. doi:10.1038/s41598-020-63159-5.
- Fioravanti D, Giarratano Y, Maggio V, Agostinelli C, Chierici M, Jurman G, Furlanello C. Phylogenetic convolutional neural networks in metagenomics. BMC Bioinform. 2018;19(S2):1–13. doi:10.1186/s12859-018-2033-5.
- Reiman D, Metwally AA, Sun J, Dai Y. PopPhy-CNN: a phylogenetic tree embedded architecture for convolutional neural networks to predict host phenotype from metagenomic data. IEEE J Biomed Health Inform. 2020;24(10):2993–3001. doi:10.1109/JBHI.2020.2993761.
- Chen X, Zhu Z, Zhang W, Wang Y, Wang F, Yang J, Wong KC. Human disease prediction from microbiome data by multiple feature fusion and deep learning. Iscience. 2022;25(4):104081. doi:10.1016/j.isci.2022.104081.
- Fortelny N, Bock C. Knowledge-primed neural networks enable biologically interpretable deep learning on single-cell sequencing data. Genome Biol. 2020;21(1):1–36. doi:10.1186/s13059-020-02100-5.
- Rowland I, Gibson G, Heinken A, Scott K, Swann J, Thiele I, Tuohy K. Gut microbiota functions: metabolism of nutrients and other food components. Eur J Nutr. 2018;57(1):1–24. doi:10.1007/s00394-017-1445-8.
- Levy R, Borenstein E. Metabolic modeling of species interaction in the human microbiome elucidates community-level assembly rules. Proc Natl Acad Sci USA. 2013;110(31):12804–12809. doi:10.1073/pnas.1300926110.
- Lam TJ, Stamboulian M, Han W, Ye Y, Ouzounis CA. Model-based and phylogenetically adjusted quantification of metabolic interaction between microbial species. PloS Comput Biol. 2020;16(10):e1007951. doi:10.1371/journal.pcbi.1007951.
- Sung J, Kim S, Cabatbat JJT, Jang S, Jin YS, Jung GY, Chia N, Kim PJ. Global metabolic interaction network of the human gut microbiota for context- specific community-scale analysis. Nat Commun. 2017;8(1):1–12. doi:10.1038/ncomms15393.
- Matchado MS, Lauber M, Reitmeier S, Kacprowski T, Baumbach J, Haller D, List M. Network analysis methods for studying microbial communities: a mini review. Comput Struct Biotechnol J. 2021;19:2687–2698. doi:10.1016/j.csbj.2021.05.001.
- Jiang D, Armour CR, Hu C, Mei M, Tian C, Sharpton TJ, Jiang Y. Microbiome multi-omics network analysis: statistical considerations, limitations, and opportunities. Front Genet. 2019;10:995. doi:10.3389/fgene.2019.00995.
- Parente E, Zotta T, Ricciardi A. A review of methods for the inference and experimental confirmation of microbial association networks in cheese. Int J Food Microbiol. 2022;368:109618. doi:10.1016/j.ijfoodmicro.2022.109618.
- Lam TJ, Ye Y. Meta-analysis of microbiome association networks reveal patterns of dysbiosis in diseased microbiomes. Sci Rep. 2022;12(1):17482. doi:10.1038/s41598-022-22541-1.
- Qin J, Li R, Raes J, Arumugam M, Burgdorf KS, Manichanh C, Nielsen T, Pons N, Levenez F, Yamada T. A human gut microbial gene catalogue established by metagenomic sequencing. Nature. 2010;464(7285):59–65. doi:10.1038/nature08821.
- Karlsson FH, Tremaroli V, Nookaew I, Bergström G, Behre CJ, Fagerberg B, Nielsen J, Bäckhed F. Gut metagenome in European women with normal, impaired and diabetic glucose control. Nature. 2013;498(7452):99–103. doi:10.1038/nature12198.
- Qin J, Li Y, Cai Z, Li S, Zhu J, Zhang F, Liang S, Zhang W, Guan Y, Shen D, et al. A metagenome-wide association study of gut microbiota in type 2 diabetes. 2012;7418. doi:10.1038/nature11450.
- Qin N, Yang F, Li A, Prifti E, Chen Y, Shao L, Guo J, Le Chatelier E, Yao J, Wu L, et al. Alterations of the human gut microbiome in liver cirrhosis. Nature. 2014;513:59–64.
- Zeller G, Tap J, Voigt AY, Sunagawa S, Kultima JR, Costea PI, Amiot A, Böhm J, Brunetti F, Habermann N, et al. Potential of fecal microbiota for early-stage detection of colorectal cancer. Molecul Systs Biol. 2014;10(11). doi:10.15252/msb.20145645.
- Le Chatelier E, Nielsen T, Qin J, Prifti E, Hildebrand F, Falony G, Almeida M, Arumugam M, Batto JM, Kennedy S. Richness of human gut microbiome correlates with metabolic markers. Nature. 2013;500(7464):541–546. doi:10.1038/nature12506.
- Zhu Z, Ren J, Michail S, Sun F. MicroPro: using metagenomic unmapped reads to provide insights into human microbiota and disease associations. Genome Biol. 2019;20(1):1–13. doi:10.1186/s13059-019-1773-5.
- Alemany M. The problem of nitrogen disposal in the obese. Nutr Res Rev. 2012;25(1):18–28. doi:10.1017/S0954422411000163.
- Martínez-Cuesta MC, Del Campo R, Garriga-García M, Peláez C, Requena T. Taxo- nomic characterization and short-chain fatty acids production of the obese microbiota. Front Cell Infect Microbiol. 2021;11:598093. doi:10.3389/fcimb.2021.598093.
- Lovejoy J, Newby F, Gebhart S, DiGirolamo M. Insulin resistance in obesity is associated with elevated basal lactate levels and diminished lactate appearance following intravenous glucose and insulin. Metabol. 1992;41(1):22–27. doi:10.1016/0026-0495(92)90185-D.
- Bjerrum JT, Wang Y, Hao F, Coskun M, Ludwig C, Günther U, Nielsen OH. Metabonomics of human fecal extracts characterize ulcerative colitis, Crohn’s disease and healthy individuals. Metabolomic. 2015;11(1):122–133. doi:10.1007/s11306-014-0677-3.
- Nardelli C, Granata I, D’Argenio V, Tramontano S, Compare D, Guarracino MR, Nardone G, Pilone V, Sacchetti L. Characterization of the duodenal mucosal microbiome in obese adult sub- jects by 16S rRNA sequencing. Microorgans. 2020;8(4):485. doi:10.3390/microorganisms8040485.
- Han W, Tang H, Ye Y. Locality-sensitive hashing-based k-mer clustering for identifi- cation of differential microbial markers related to host phenotype. J Comput Biol. 2022;29(7):738–751. doi:10.1089/cmb.2021.0640.
- Pasolli E, Truong DT, Malik F, Waldron L, Segata N, Eisen JA. Machine learning meta-analysis of large metagenomic datasets: tools and biological insights. PLoS Comput Biol. 2016;12(7):e1004977. doi:10.1371/journal.pcbi.1004977.
- Truong DT, Franzosa EA, Tickle TL, Scholz M, Weingart G, Pasolli E, Tett A, Huttenhower C, Segata N. MetaPhlAn2 for enhanced metagenomic taxonomic profiling. Nat Methods. 2015;12(10):902–903. doi:10.1038/nmeth.3589.
- Lu J, Breitwieser FP, Thielen P, Salzberg SL. Bracken: estimating species abundance in metagenomics data. PeerJ Comput Sci. 2017;3:e104. doi:10.7717/peerj-cs.104.
- Lin H, Peddada SD. Analysis of microbial compositions: a review of normalization and differential abundance analysis. NPJ Biofilms Microbio. 2020;6(1):60. doi:10.1038/s41522-020-00160-w.
- Glover JS, Ticer TD, Engevik MA. Characterizing the mucin-degrading capacity of the human gut microbiota. Sci Rep. 2022;12(1):8456. doi:10.1038/s41598-022-11819-z.
- Huang JY, Lee SM, Mazmanian SK. The human commensal Bacteroides fragilis binds intestinal mucin. Anaerobe. 2011;17(4):137–141. doi:10.1016/j.anaerobe.2011.05.017.
- Federhen S. The NCBI taxonomy database. Nucleic Acids Res. 2012;40(D1):D136–D143. doi:10.1093/nar/gkr1178.
- Traag VA, Waltman L, Van Eck NJ. From Louvain to Leiden: guaranteeing well- connected communities. Sci Rep. 2019;9(1):1–12. doi:10.1038/s41598-019-41695-z.
- Chollet F. Keras. 2015. https://github.com/fchollet/keras.