
ABSTRACT
The gut microbiota (GM) and its metabolites affect the host nervous system and are involved in the pathogeneses of various neurological diseases. However, the specific GM alterations under pathogenetic pressure and their contributions to the “microbiota – metabolite – brain axis” in Alzheimer’s disease (AD) remain unclear. Here, we investigated the GM and the fecal, serum, cortical metabolomes in APP/PS1 and wild-type (WT) mice, revealing distinct hub bacteria in AD mice within scale-free GM networks shared by both groups. Moreover, we identified diverse peripheral – central metabolic landscapes between AD and WT mice that featured bile acids (e.g. deoxycholic and isodeoxycholic acid) and unsaturated fatty acids (e.g. 11Z-eicosenoic and palmitoleic acid). Machine-learning models revealed the relationships between the differential/hub bacteria and these metabolic signatures from the periphery to the brain. Notably, AD-enriched Dubosiella affected AD occurrence via cortical palmitoleic acid and vice versa. Considering the transgenic background of the AD mice, we propose that Dubosiella enrichment impedes AD progression via the synthesis of palmitoleic acid, which has protective properties against inflammation and metabolic disorders. We identified another association involving fecal deoxycholic acid-mediated interactions between the AD hub bacteria Erysipelatoclostridium and AD occurrence, which was corroborated by the correlation between deoxycholate levels and cognitive scores in humans. Overall, this study elucidated the GM network alterations, contributions of the GM to peripheral – central metabolic landscapes, and mediatory roles of metabolites between the GM and AD occurrence, thus revealing the critical roles of bacteria in AD pathogenesis and gut – brain communications under pathogenetic pressure.
Introduction
The gut microbiota (GM) is a micro-ecosystem comprising microorganisms that compete and cooperate.Citation1 The GM produces various metabolites that provide energy for its constituents and the host. GM-derived metabolites can modulate the host’s immune and neural activities. Conversely, the GM can also be regulated by the host’s brain functions and metabolic activities. Such bidirectional connections between the GM and brain constitute the “GM – metabolite – brain axis”.Citation2 Numerous studies have revealed the effects of certain microorganisms and their specific metabolites on brain functions as well as strong correlations between the GM and the pathogeneses of neurological diseases such as Parkinson’s disease, depression, and Alzheimer’s disease (AD).Citation3–6 However, neither the alterations of GM-associated metabolic landscapes under pathogenetic pressure nor the feedback regulatory mechanisms that underlie the GM – metabolite – brain axis are fully understood.
AD is a progressive neurodegenerative disorder characterized by cognitive impairment, psycho-behavioral abnormalities, and reduced social abilities. Patients with AD account for an estimated 60–80% of dementia cases, and 11.3% of people aged ≥ 65 are living with AD.Citation7 Existing AD treatments have very limited efficacy owing to the incomplete understanding of the disease’s pathological mechanisms. Among the molecular and cellular processes involved in AD pathogenesis, the extracellular aggregation of amyloid-beta (Aβ), hyperphosphorylation of tau protein (which form neurofibrillary tangles), and mitochondrial metabolic disorders are strongly correlated with AD progression.Citation8 However, recent studies indicate an intimate association between the GM and AD pathogenesis, suggesting that peripheral organs are involved in AD progression.Citation9 GM dysbiosis can result in the secretion of toxic metabolites that invade the systemic circulation where they induce the differentiation and accumulation of peripheral immune cells, promoting their infiltration into the brain.Citation10,Citation11 In contrast, unsaturated fatty acids are important dietary nutrients that may prevent or reduce the risks of mental disorders, such as anxiety, depression, and mild cognitive impairment.Citation12,Citation13 Supplementation with ω-3 polyunsaturated fatty acids, especially docosahexaenoic acid (DHA), is beneficial for cognitive functions and may protect neuronal health through its downstream product, neuroprotectin D1.Citation14 Certain GM-derived short-chain fatty acids (SCFAs) can promote astrocyte – neuron glutamate – glutamine shuttling and alleviate cognitive and spatial memory deficits in AD mice.Citation15 In addition, several metabolomics studies on AD report associations between blood metabolites and brain functions.Citation16–18 For example, as essential metabolites produced by the liver and metabolized by GM, bile acids exhibit aberrant levels in serum and brain samples from patients with AD. Moreover, the altered bile acid profiles are associated with amyloid, tau, and cognitive changes in patients with AD.Citation19–21 In addition, bile acids can cross the blood – brain barrier and regulate neurological functions through their receptors.Citation18 Nevertheless, as the blood serves as a reservoir for metabolic substances from multiple peripheral organs, it remains challenging to ascertain the origin(s) of metabolic changes in the blood and elucidate how changes in the GM specifically contribute to metabolic alterations of the gut, blood, and brain.
Complex network analysis has emerged as a valuable tool for investigating the topological features of ecological networks. Network analysis has been used to reveal microbial relationships and assess the controllability of micro-ecosystems in marine, groundwater, and soil environments.Citation22–24 Accordingly, in the present study, we used complex network analysis to identify the hub bacteria of GM networks and investigate GM modulation and intervention.Citation25 Meanwhile, mediation analysis is a robust approach for discerning the causality between independent and dependent variables through mediators; this strategy is widely applied in clinical medicine to identify risk factors or early indicators for critical diseases (e.g., cancers).Citation26,Citation27 Accordingly, in this study, we adopted mediation analysis to decipher the intricate connections between GM alterations and disease occurrence via the mediation of metabolites and thereby enhance our understanding of the adaptive and feedback mechanisms of the GM in response to host pathogenetic factors.
Hence, in this study, we comprehensively investigated AD pathogenesis and GM feedback mechanisms from the perspective of the GM – metabolite – brain axis. Accordingly, we employed a complex network approach to identify the hub bacteria and topological features of the GM networks, adopted a neural network approach to characterize the GM-associated metabolic landscapes from the periphery to the brain in AD model mice (i.e., APP/PS1 mice), and used mediation analysis to unveil the critical roles of the gut bacteria in facilitating “gut – brain communication” mediated by metabolites.
Results
Distinct gut microbiota networks in Alzheimer’s disease and wild-type mice
To investigate the influence of GM – host interactions on the GM features that underlie the genetic backgrounds of neurological disorders, we performed 16S rRNA sequencing on collected mouse feces and compared the GM characteristics between the AD and wild-type (WT) mice (Supplementary Table S1). Rarefaction and accumulation curves demonstrated that there were sufficient data for all samples (Supplementary Figure S1). Based on the Aitchison distances, principal coordinates analysis (PCoA) demonstrated partial sample overlap between the AD and WT mice; the Shannon and Chao1 indices indicated no statistical differences between the AD and WT mice in terms of bacterial diversity or richness (). However, the AD mice exhibited robust alterations to GM composition compared to the WT mice, and the WT mice exhibited greater individual GM diversity (Padj < .001, ). We further determined the differentially abundant bacterial taxa between the AD and WT mice based on the normalized GM data (Supplementary Figure S2). Compared to the WT mice, the AD mice had significantly higher levels of bacteria, including Turicibacter (Padj < .001), Dubosiella (Padj < .001), and Akkermansia (Padj = .014) ( and Supplementary Table S2). In contrast, the levels of bacteria, including Enterobacter (Padj <0.001), Oscillibacter (Padj < .001), and Clostridia UCG-014 (Padj < .001), were significantly lower in the AD mice than in the WT mice ( and Supplementary Table S2). Considering the consistent rearing conditions of both mouse groups, these results suggest that specific pathogenetic genes (i.e., APP and PSEN1) in the AD mice stress bacterial homeostasis and thereby affect GM composition.
Figure 1. Characteristics of the gut microbiota in the Alzheimer’s disease and wild-type mice. (a) Principal coordinates analysis (PCoA) and bacterial diversity in the Alzheimer’s disease (AD, red) and wild-type (WT, blue) mice. Each dot indicates a sample, and ellipses in PCoA contain samples with 90% confidence intervals for the groups. The Shannon and Chao1 indices for the AD and WT mice are displayed to the right and top of the PCoA plot, respectively. (b) comparison of gut microbiota (GM) similarity between the AD and WT mice. The Aitchison distances with normalized GM abundances were calculated to quantify the GM similarity among samples. Red and blue circles indicate sample distances in the AD and WT groups, respectively; yellow circles indicate the sample distances between the AD and WT mice. (c) differentially enriched genera between the AD (red) and WT (blue) mice. Asterisks indicate adjusted P-values with the global test in ANCOM-BC. (d) GM co-occurrence networks in the AD and WT mice. In the networks, each node indicates a genus and node size indicates its relative abundance. Node colors represent the taxonomical assignments at the phylum level, and the hub bacteria are labeled for the GM networks. Pink and green edges indicate positive and negative correlations, respectively; n and l indicate numbers of nodes and edges, respectively. (e) distributions of degrees in the bacterial co-occurrence networks of the AD and WT mice. (f) topological characteristics of the GM co-occurrence networks in the AD (red) and WT (blue) mice. Global test: NS, not significant; *p < .05; ***p < .001.
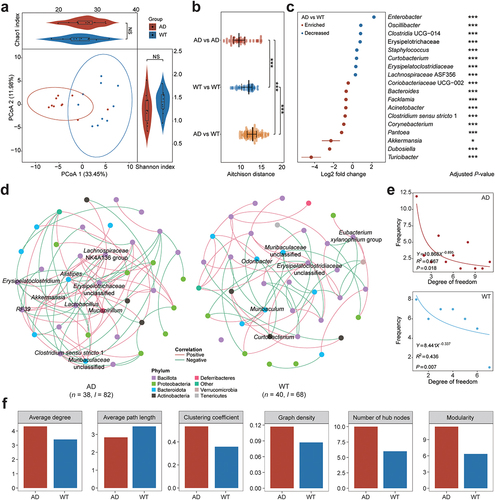
Because the GM is a micro-ecosystem that involves complex interactions, investigating the bacterial co-occurrence networks may help elucidate how GM interactions are modulated in AD transgenic mouse models (). SparCC correlation analysis showed that the distributions of node degree conformed to a power-law distribution in both the AD (R2 = 0.667, p = 0.018) and WT mice (R2 = 0.436, p = .007), indicating the feature of scale-free networks for the GM (). However, compared to the WT mice, the AD mice exhibited a larger bacterial network, as reflected by more nodes and edges as well as a higher clustering coefficient and graph density (). Further analysis of the bacterial networks revealed 10 hub bacterial taxa in the AD mice (i.e., Erysipelatoclostridium, Alistipes, Akkermansia, RF39, Lactobacillus, Mucispirillum, Clostridium sensu stricto 1, Erysipelotrichaceae undefined, Lachnospiraceae NK4A136 group, and Muribaculaceae unclassified) and 6 hub bacterial taxa in the WT mice (i.e., Curtobacterium, Odoribacter, Eubacterium xylanophilum group, Muribaculum, Muribaculaceae unclassified, and Erysipelatoclostridiaceae unclassified) (). Notably, Akkermansia was both an enriched and hub bacterial genus in the AD mice. Given that Akkermansia provide neuroprotective effects via SCFA secretion and neuroinflammation reduction,Citation28 they might play a compensatory role in restoring GM homeostasis in the AD mice under pathogenetic stress. Accordingly, these results provide clues as to how GM balance can be regained in neurological disorders via the regulation of hub bacteria and improve our understanding of peripheral – central bidirectional communication.
Potential impacts of gut microbiota alterations on the host nervous system
As the characteristics of the GM and host are correlated via their functions, we compared the functional distributions of the GM between the AD and WT mice using PICRUSt2 software (Supplementary Table S3). Among the 1,621 predicted functional items, we detected 112 differential pathways between the AD and WT mice, ranging from amino acid metabolism to vitamin biosynthesis (). Notably, the GM in the AD mice exhibited significantly lower tryptophan synthase (Padj = .033, ), which involves serotonin production and is crucial for neuroprotection.Citation29 In addition, the GM in the AD mice exhibited downregulated vitamin metabolism capacity, including quinolinate synthase (Padj = .033), GTP cyclohydrolase II (Padj = .040), and methylenetetrahydrofolate reductase NADPH (Padj = .033) (). These results collectively suggest that the alterations to the GM under neuropathological conditions might be involved in the progression of neurological diseases via the regulation of neuroactive gut metabolites.
Figure 2. Comparison of gut microbial functions between the Alzheimer’s disease and wild-type mice. (a) heatmap of the differentially enriched gut microbiota (GM) metabolic pathways. Red and blue squares indicate the normalized abundances of the metabolic pathways. Top: dendrograms showing the clustering results of the samples based on the Euclidean distances of metabolic pathways. Red and blue squares indicate the Alzheimer’s disease (AD) and wild-type (WT) mice, respectively. Right: metabolic pathways involving amino acid metabolism (blue), fatty acid metabolism (red), vitamin synthase (green), and energy metabolism (purple). (b) differentially enriched neuroactive functions in the AD (red) and WT (blue) mice with (left) mean proportions of functional items and (right) 95% confidence intervals in the enriched group. (c) correlations between bacterial genera and differential neuroactive functions. Left: yellow circles indicate significant correlations between specific bacterial genera and neuroactive functions from the gut – brain module database. Right: red and blue circles indicate enriched/hub bacterial genera in the AD and WT mice, respectively.
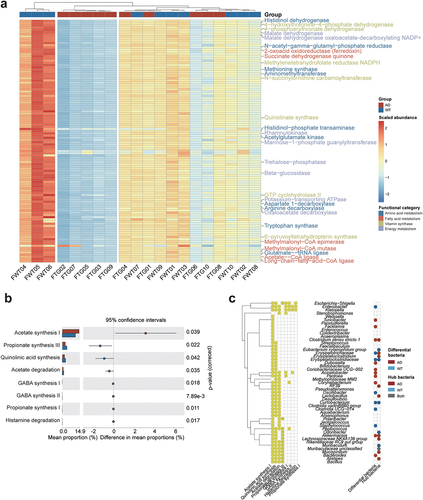
We further investigated the GM functions in relation to the nervous system and explored the corresponding bacteria by using the gut – brain modules (GBMs) reported for neurological disorders (e.g., depression). Notably, the GM in the AD mice exhibited enhanced acetate synthesis (Padj = .039, ), indicating elevated levels of acetate in the gut; of note, GM-derived acetate is an essential SCFA that can modulate microglial maturation and Aβ phagocytosis in an AD mouse model.Citation30 Meanwhile, the functional modules related to the synthesis of GABA (γ-aminobutyric acid) (Padj <0.05) and propionate (Padj = .011) were lower in the GM in the AD mice than that in the WT mice (). By detecting the host bacteria of the GBMs, we found that Akkermansia, a hub and enriched bacterial genus in the AD mice, participate in acetate and propionate synthesis; meanwhile, Enterobacter, which were enriched in the WT mice, are involved in GABA synthesis (). These GM functional prediction results indicate that the GM alterations in the AD mice play both deteriorative and compensatory roles. Therefore, we subsequently investigated the interactions between the GM and nervous system by examining metabolites.
Fecal, serum, and cortical metabolomic differences in Alzheimer’s disease mice
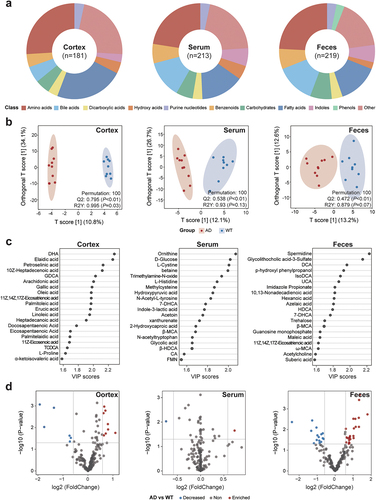
To confirm our functional findings detailed above and explore the landscapes of the neurometabolic changes under normal and neurodegenerative conditions, we used UHPLC-QTRAP-MS to quantify 346 targeted metabolites (e.g., major metabolites in amino acids, fatty acids, bile acids, indoles, and carbohydrates) in the fecal, serum, and cortical samples from the AD and WT mice (Supplementary Table S4). We observed a descending trend in the numbers of detectable metabolites from the peripheral to the central tissues: fecal, serum, and cortical samples contained 219, 213, and 181 metabolites, respectively (). This suggests that the intestinal mucosal barrier and blood – brain barrier impede metabolite transport from the peripheral organ(s) to the central nervous system (CNS).Citation31 Orthogonal projections to latent structures discriminant analysis (OPLS-DA) revealed distinct metabolic landscapes in the AD and WT mice based on normalized metabolomic data ( and Supplementary Figure S3). The OPLS-DA model based on the cortical metabolome had the greatest predictive performance (Q2 = 0.795, p < .01) followed by the serum metabolome (Q2 = 0.538, p < .01) and the fecal metabolome (Q2 = 0.472, p < .01). We subsequently selected the top 20 metabolites that were crucial to differentiate the AD and WT mice with respect to the cortical, serum, or fecal samples based on the variable importance in projection (VIP) values of the metabolites in the OPLS-DA models (). We also detected the differentially enriched metabolites between the AD and WT mice in different tissues ( and Supplementary Table S5). Upon combining the results of the OPLS-DA and differential analyses (), the top 20 metabolites crucial for the OPLS-DA models were also differentially enriched in the AD and WT mice, suggesting that they play important roles in AD progression or neuroprotection. In addition, these crucial and differentially enriched metabolites exhibited tissue-specific characteristics: most of those in the cortex are ω-3 polyunsaturated fatty acids, such as DHA and 11Z,14Z,17Z-eicosatrienoic acid; most of those in serum are amino acids, such as N-acetyl-l-tyrosine and l-cystine; and most of those in feces are bile acids, such as deoxycholic acid (DCA) and isodeoxycholic acid (IsoDCA). Given that the GM participates in the metabolism of bile acids, which are critical for synaptic plasticity and inflammatory responses in hosts,Citation32 we subsequently investigated the peripheral – central communications involving the GM – bile acid – unsaturated fatty acid axis in hosts under the pathogenetic stress of AD.
Figure 3. Characteristics of the fecal, serum, and cortical metabolomes in the Alzheimer’s disease and wild-type mice. (a) compositions of the fecal, serum, and cortical metabolomes in the Alzheimer’s disease (AD) and wild-type (WT) mice. The metabolites are classified and indicated by different colors. Arc lengths indicate the proportions of the classifications. (b) orthogonal projections to latent structures discriminant analysis (OPLS-DA) plots based on the fecal, serum, and cortical metabolomes. Red and blue dots indicate samples from the AD and WT mice, respectively. Ellipses contain samples with 90% confidence intervals for the groups. The Q2 and R2Y scores for the OPLS-DA models are shown on the lower-right corners of the plots. (c) the top 20 metabolites contributing to the OPLS-DA models constructed for different tissues were selected, and their variable importance in projection (VIP) scores are indicated by horizontal coordinates. (d) differentially enriched metabolites between the AD and WT mice. Each dot represents a metabolite. Metabolites enriched in the AD and WT mice are indicated in red and blue, respectively. The horizontal gray line represents −log10(0.05), and the vertical gray lines indicate log2(0.67) and log2(1.5), respectively.
Associations between the gut microbiota and crucial metabolites in feces, serum, and cortical tissues
To integrate the GM and metabolomic data, we determined the associations between gut bacteria and the concentrations of metabolites in the feces, serum, and cortical tissues by constructing shallow neural networks with MMvec software ( and Supplementary Figure S4). Interestingly, Lactobacillus, Odoribacter, Alistipes, and Muribaculaceae unclassified were significantly associated with the metabolites across different tissues (). Within the microbe – metabolite networks, the differentially enriched genera, such as Dubosiella and Akkermansia, significantly influenced the concentration of 11Z,14Z,17Z-eicosatrienoic acid, an unsaturated fatty acid that was elevated in the cortical tissues of AD mice (Padj = .044, and Supplementary Table S6). Notably, we observed similar robust associations between the enriched 11Z,14Z,17Z-eicosatrienoic acid level in the AD mice and the differentially abundant bacterial genera in feces, indicating their potential roles in AD (). Furthermore, the elevated levels of bile acids (e.g., DCA, IsoDCA, and hyodeoxycholic acid [HDCA]) in AD mouse feces were also associated with the differentially abundant genera ().
Figure 4. Associations between gut bacteria and metabolites in the feces, serum, and cortical tissues. (a) Contributions of the gut microbiota (GM) to the levels of metabolites in different sample types. Points and arrows in emperor biplots indicate metabolites and bacterial genera, respectively. The top six bacterial genera that contributed to the metabolite levels were retained. Arrows pointing in the same direction as the metabolites indicate the co-occurrence of bacterial genera and metabolites. Arrows with small angles between them indicate the occurrence of bacterial genera; different colored points indicate their classifications. (b) associations of differentially enriched bacterial genera with the key metabolites in different sample types. (c) associations of the hub bacteria with the key metabolites in different sample types. For the plots in b and c, circles and hexagons indicate bacteria and metabolites, respectively. The differential/hub bacteria in the Alzheimer’s disease (AD) and wild-type (WT) mice are indicated in red and blue, respectively. Line thickness suggests the conditional probability of the interactions between the bacteria and metabolites. DHA: 4Z,7Z,10Z,13Z,16Z,19Z-docosahexaenoic acid; FMN: riboflavin-5-monophosphate; UCA: ursocholic acid; HDCA: hyodeoxycholic acid; IsoDCA: isodeoxycholic acid; MCA: omega-muricholic acid; CA: cholic acid; TCDCA: taurochenodeoxycholic acid; 7-DHCA: 7-dehydrocholic acid; UDCA: ursodeoxycholic acid; GDCA: glycodeoxycholic acid.
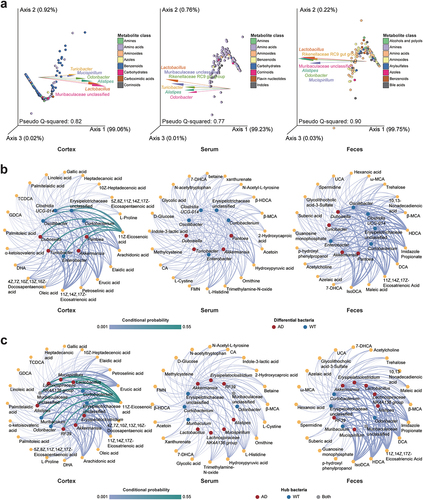
We also determined the associations between the hub bacteria and metabolites crucial for differentiating the AD and WT mice ( and Supplementary Table S6). Compared to the differentially enriched bacteria, the hub bacteria exhibited greater differences to the contributions of different metabolites. The hub bacterial taxa in AD mice, such as Alistipes, Akkermansia, and Erysipelatoclostridium, were associated with the concentrations of 11Z-eicosenoic acid and 11Z,14Z,17Z-eicosatrienoic acid, which are unsaturated fatty acids that were elevated in the cortex in the AD mice (). In the microbe – fecal metabolite network, 11Z,14Z,17Z-eicosatrienoic acid, which was also enriched in the feces of the AD mice, was again associated with the AD hub bacteria (). In addition, DCA, IsoDCA, and HDCA, which are secondary bile acids whose levels were elevated in the feces of the AD mice, were associated to the levels of hub genera (). Meanwhile, we observed sparse associations between the hub gut bacteria and serum crucial metabolites (). These findings highlight the influence of specific hub bacteria on the levels of distinct metabolites, particularly bile acids and unsaturated fatty acids within the peripheral and central tissues of mice. They also demonstrate how integrating GM and metabolomic data can yield potential bacterial and metabolic candidates for investigating the pathogenesis and compensatory mechanisms of AD.
Fecal and cortical metabolites mediate the impacts of the gut microbiota on Alzheimer’s disease
To unravel the relationships among the feces, serum, and cortical tissues, we selected the metabolites identified in the OPLS-DA models (i.e., VIP > 1) and confirmed their presence in each sample type (). Among the metabolites shared among all sample types, DCA, IsoDCA, and HDCA were elevated in both the serum and feces of the AD mice, which corresponds to the significant contributions from the differentially enriched and hub bacteria in the AD mice as stated above (). In addition, as a neuroprotective metabolite, the level of 11Z,14Z,17Z-eicosatrienoic acidCitation33 was elevated in both the fecal and cortical samples from the AD mice, suggesting a potential gastrointestinal tract – brain interaction (). Notably, TMAO (trimethylamine-N-oxide), which is an important GM metabolite and biomarker of cardiovascular diseases,Citation34 was enriched and depleted in the cortex and serum in the AD mice, respectively (). Thus, these findings indicate that studying the metabolic connectome offers valuable insights into the communication between peripheral and central tissues. Specifically, the inconsistencies in the changes of the same metabolites across sample types in the AD mice motivated us to investigate the causal relationship between GM and metabolite alterations under the pathogenetic stress of AD.
Figure 5. Mediatory effects of metabolites between gut bacteria and Alzheimer’s disease occurrence. (a) venn diagrams of the common and specific metabolites among the feces, serum, and cortical tissues. Metabolites contributed to the orthogonal projections to latent structures discriminant analysis (OPLS-DA) models were selected according to sampling site (i.e., variable importance in projection [VIP] score > 1). (b) mediatory effects of metabolites between the gut microbiota (GM) and Alzheimer’s disease (AD) occurrence. Dubosiella causally affects AD occurrence via cortical palmitoleic acid, while Erysipelatoclostridium causally affects AD occurrence via fecal deoxycholic acid (DCA). (c) mixed linear models between the metabolites and GM. In the AD mice, Dubosiella and palmitoleic acid exhibited a significant linear relationship, while Erysipelatoclostridium exhibited a significant linear association with DCA. (d) dynamic changes of palmitoleic acid and DCA from the peripheral to central tissues, respectively. Wilcoxon rank sum test: *p < .05, **p < .01, ***p < .001.
![Figure 5. Mediatory effects of metabolites between gut bacteria and Alzheimer’s disease occurrence. (a) venn diagrams of the common and specific metabolites among the feces, serum, and cortical tissues. Metabolites contributed to the orthogonal projections to latent structures discriminant analysis (OPLS-DA) models were selected according to sampling site (i.e., variable importance in projection [VIP] score > 1). (b) mediatory effects of metabolites between the gut microbiota (GM) and Alzheimer’s disease (AD) occurrence. Dubosiella causally affects AD occurrence via cortical palmitoleic acid, while Erysipelatoclostridium causally affects AD occurrence via fecal deoxycholic acid (DCA). (c) mixed linear models between the metabolites and GM. In the AD mice, Dubosiella and palmitoleic acid exhibited a significant linear relationship, while Erysipelatoclostridium exhibited a significant linear association with DCA. (d) dynamic changes of palmitoleic acid and DCA from the peripheral to central tissues, respectively. Wilcoxon rank sum test: *p < .05, **p < .01, ***p < .001.](/cms/asset/a8af6e46-ed80-4f92-b41c-03a84af752c6/kgmi_a_2302310_f0005_oc.jpg)
To further investigate the roles of GM, fecal, serum, and cortical metabolites in the occurrence of AD, we performed bidirectional mediation analysis with reference to the contributions of the GM to crucial metabolites (). Dubosiella, which were enriched in the AD mice, affected the occurrence of AD via cortical palmitoleic acid (23%, Pmediated = 0.040) and themselves (77%, Pdirected < .001, ). Conversely, the impact of AD occurrence on the abundance of Dubosiella was also apparent (Pinv.total.effect < .001, ). Considering the transgenic background of AD mice, we speculated that gut bacteria are altered under pathogenetic pressure and subsequently influence AD progression via their metabolite secretion. In addition, Erysipelatoclostridium, which were hub bacteria in the AD mice, affected AD occurrence through both the mediation effect of fecal DCA (23%, Pmediated = .020) and themselves (77%, Pdirected < .001); meanwhile, the impact of AD occurrence on the abundance of Erysipelatoclostridium was limited (Pinv.total.effect = .180) (). The mixed linear model showed that in the AD mice, cortical palmitoleic acid level was positively correlated with the abundance of Dubosiella (R2 = 0.43, p = 0.023) and fecal DCA was positively correlated with the abundance of Erysipelatoclostridium (R2 = 0.37, p = .038) (). By tracing the palmitoleic acid and DCA from the peripheral to the central tissues, we identified a significant decrease of DCA in both the AD and WT mice (). Previous studies demonstrate the potent anti-inflammatory activity of palmitoleic acid and its inhibitory effects on Akt and JNK phosphorylation.Citation35,Citation36 In addition, DCA and its derivatives may affect blood – brain barrier permeability and modulate brain functions through bile acid receptors.Citation19 Thus, these results offer valuable insights for targeting palmitoleic acid and DCA from peripheral organs to the CNS to induce a protective effect against inflammation or promote bile acid – brain signaling in preclinical studies. Furthermore, these findings elucidate the mediatory roles of fecal and cortical metabolites in the relationship between the GM and the occurrence of AD, offering valuable insights for exploring the mechanisms that underlie the gut – brain axis.
Associations between targeted metabolites and cognitive functions in humans
Furthermore, we investigated the associations between the identified metabolites and cognitive functions in humans using publicly accessible data ().Citation37 Notably, the level of deoxycholate (a derivative of DCA) was correlated with Mini-Mental State Examination (MMSE) score (R2 = 0.03, p = 0.026), indicating that DCA has a potential cognitive-enhancing effect in humans. Furthermore, deoxycholate level was correlated with insulin level (R2 = 0.16, p < 0.001), although we did not observe a significant correlation between insulin and cognitive functions in humans (Supplementary Figure S5). These relationships corroborate our findings from the AD mice, highlighting the important role of bacteria-derived DCA in facilitating peripheral – central communication. Given that the AD-enriched/hub bacteria Akkermansia participate in acetate synthesis, we investigated the relationships between SCFAs and cognitive functions in humans. We observed significant associations between MMSE score and various SCFA derivatives, including 5-hydroxyindoleacetate (R2 = 0.09, p < 0.001), 4-hydroxyphenylacetate (R2 = 0.02, p = 0.043), and 3-hydroxy-2-ethylpropionate (R2 = 0.03, p = 0.042), suggesting that SCFAs positively impact cognitive functions in hosts (Supplementary Figure S6).
Figure 6. Relationships between deoxycholate and cognitive functions in humans. (a – d) regression models showing the relationships between deoxycholate (a derivative of deoxycholic acid [DCA]) and ADCS-ADL, ADAS-Cog, MMSE score, and serum insulin, respectively. ADCS-ADL: AD cooperative study–activities of daily Living; ADAS-Cog: AD assessment scale-cognitive Subscale; MMSE: mini-mental state examination.
![Figure 6. Relationships between deoxycholate and cognitive functions in humans. (a – d) regression models showing the relationships between deoxycholate (a derivative of deoxycholic acid [DCA]) and ADCS-ADL, ADAS-Cog, MMSE score, and serum insulin, respectively. ADCS-ADL: AD cooperative study–activities of daily Living; ADAS-Cog: AD assessment scale-cognitive Subscale; MMSE: mini-mental state examination.](/cms/asset/7722b928-d6a9-49e4-900a-fd4e331771f9/kgmi_a_2302310_f0006_oc.jpg)
To decipher the connections between the observed metabolites and CNS cells, we collected the public-accessible single-cell RNA (scRNA) data from both the WT mice and normal control (NC) humansCitation38,Citation39 and detected the expression levels of metabolite-related genes in different cell types (Supplementary Figure S7). The metabolite-related genes mentioned here refer to the enzymes in the synthesis and metabolic pathways of the target metabolites retrieved from the literature as well as the target proteins of the metabolites. We observed differential expression levels of palmitoleic acid- and DCA-related signaling molecules among different cell types in the cortex of both WT mice and normal control (NC) humans (Supplementary Figure S7b,d). The expression of NTRK2, which is modulated by palmitoleic acid and participates in the TrkB pathway,Citation40 was highest in astrocytes in both the WT mice and HC humans (Supplementary Figure S7b,d). However, the lowest expression of NTRK2 existed in different cell types of WT mice and HC humans: its lowest expression was in excitatory neurons of WT mice but in microglia of HC humans (Supplementary Figure S7b,d). Meanwhile, the expression of RAC1, which is co-effected with DCA and affects blood – brain barrier permeability,Citation19 was highest in microglia and lowest in inhibitory neurons (Supplementary Figure S7b). In the NC humans, RAC1 was highest in endothelial cells and lowest in astrocytes (Supplementary Figure S7d). These findings not only demonstrate the differential potential impacts of the target metabolites on different CNS cell types, and exhibit different expression pattern of the metabolite-related genes in different cell types between human and mice.
Discussion
In this study, we conducted a comprehensive multi-omics integrative analysis to investigate the potential associations between the GM and peripheral – central metabolomic landscapes under the pathogenetic pressure of AD. Our findings revealed notable differences in the hub bacteria between the AD and WT mice, suggesting distinct trends in the stability and controllability of the gut microecology.Citation41,Citation42 In addition, the GM variations were strongly correlated with the alterations of the fecal, serum, and cortical metabolomes in the AD mice. These findings provide valuable insights into the roles of the GM in the pathogenic mechanisms that underlie AD, warranting further exploration and investigation.
Previous studies have detected differences in the GM between WT mice and various mouse models of AD.Citation43–45 For 5XFAD mice, some studies report higher levels of Bacteroidetes and lower levels of Firmicutes compared to WT mice,Citation43 whereas other studies report higher levels of Proteobacteria and lower levels of Actinobacteria.Citation45 Such inconsistent GM alterations have also been reported in studies involving the APP/PS1 mouse model of AD: some studies report increased Rikenellaceae and decreased Akkermansia in APP/PS1 mice, whereas we observed increased Akkermansia and decreased Oscillibacter. Nevertheless, many studies using germ-free mice or fecal microbiota transplantation have confirmed the involvement of the GM in AD development or cognitive improvement.Citation46,Citation47 Therefore, it is essential to explore the robust AD-related GM signals across different mouse models and studies to facilitate the investigation of the GM in AD pathogenesis. Accordingly, in the present study, we not only detected the differential composition of the GM between the AD and WT mice, but also determined the hub bacteria of the GM of these groups using complex network analysis. By combining the findings from these two strategies, we detected robust bacterial signals in AD progression. For example, Akkermansia was both an enriched and hub bacterial genus in the AD mice. Hence, these bacterial signals reflect the GM alterations in 9-month-old APP/PS1 mice and indicate their important roles in maintaining the microbial community.
Previous studies have investigated the metabolomic features of individuals with AD and revealed the differential levels of bile acids and unsaturated fatty acids in individuals with AD compared to normal controls, emphasizing their important roles in AD pathogenesis.Citation21,Citation48 However, there is still a need to investigate the connections between these metabolites and the GM as well as the “microbiota – metabolite – brain axis” during AD progression.Citation21,Citation49 To dissect how the GM affects the levels of metabolites from peripheral to central tissues and which bacteria and metabolites participate in AD progression, we constructed microbiota – metabolomic networks spanning the feces to the cortex and explored the causal relationships between the specific bacteria and AD occurrence. Notably, we found bidirectional interactions between the GM and AD occurrence mediated by palmitoleic acid and DCA. Thus, the results elucidate the intact connections among the GM, metabolites, and AD occurrence, extending our knowledge of the microbiota – metabolite – brain axis in AD.
One key finding of the present study is the palmitoleic acid-mediated involvement of Dubosiella in the pathogenesis of AD. Palmitoleic acid is a 16-carbon monounsaturated fatty acid known for its metabolic regulatory functions and potential to alleviate various metabolic disorders, such as obesity, hyperlipidemia, hyperglycemia, and inflammation.Citation50–52 Our results suggest that the elevated levels of palmitoleic acid and other unsaturated fatty acids in the AD mice may serve as a compensatory mechanism to counteract inflammatory damage to neuronal cells during AD progression. As an enriched bacterial genus in AD mice, Dubosiella exhibit anti-aging effects, including reducing oxidative stress, improving endothelial function, and reshaping the GM.Citation53 Furthermore, Dubosiella significantly contribute to palmitoleic acid level in the cortex. Interestingly, we found that the abundance of Dubosiella is concurrently influenced by AD pathogenetic pressure. Considering the transgenic background of the AD mice, we hypothesize that Dubosiella are enriched within the GM under the pressure of AD-related pathogenetic alterations, which leads to an increase in palmitoleic acid level, thereby counteracting the damaging effects of AD pathological factors on brain function. Nevertheless, further experimental validation is required to confirm this compensatory mechanism.
Mediation analysis also revealed the DCA-mediated role of the GM bacterial genus Erysipelatoclostridium in the occurrence of AD. Erysipelatoclostridium are inflammation-associated microbes,Citation54 and as a hub bacterial taxon in the AD mice, they contributed significantly to DCA synthesis in the gut. Therefore, we hypothesize that after alterations of the microbial niche in the AD mice, Erysipelatoclostridium become a hub bacterial taxon within the GM and contribute to the increased gut DCA synthesis. Moreover, the positive correlation between deoxycholate and cognitive function in patients with AD indicates that DCA has a protective role against damage to brain function. However, a previous study reports cytotoxic effects of DCA.Citation20 Therefore, the precise role of DCA in neuromodulation requires further exploration.
Our findings also reveal the crucial role of metabolites in mediating the interaction between the GM and AD occurrence. We identified two key types of metabolites – bile acids and unsaturated fatty acids – as well as critical gut bacterial taxa, such as Dubosiella and Erysipelatoclostridium. Given the important roles of these metabolites in immune modulation and neuroprotection, such as regulating Treg cell generation, preventing infections, and acting as acetylcholinesterase inhibitors,Citation55–57 we hypothesize that some gut microbes become enriched or act as hub bacteria under genetic and environmental pressures during the development of AD. These bacteria then extensively synthesize protective metabolites to counteract inflammatory damage to neuronal cells, thereby protecting the host via compensatory mechanisms. While these findings provide promising avenues for AD interventions, additional research is required to better understand the functionalities of the bacteria and metabolites reported herein in CNS cells.
In this study, we employed complex network, shallow neural network, and mediation effect analysis using multi-omics data. Nevertheless, this study has some limitations. First, while our bioinformatics-based approach greatly enhances the efficiency of screening target microbiota and metabolites, further biological experiments are needed to confirm their roles in AD. Second, the associations between the GM and metabolites may vary among host species. To explore how the GM influences AD progression via the metabolome in humans, subsequent omics studies should analyze fecal and blood samples from patients with AD and control subjects. Nevertheless, the complex network strategies employed in the present study are powerful tools for exploring key bacteria and their interactions within microbial communities, thereby aiding the identification of crucial nodes within GM networks. Furthermore, the use of shallow neural networks and mediation effect analysis can elucidate the bidirectional communication mechanisms between the GM and CNS via metabolites. Thus, our findings provide important insights into the pathogenic mechanisms and compensatory effects in AD and have significant potential for clinical applications.
In summary, there are three key findings of our study. First, we explored the hub bacteria in both WT and AD mice using a complex network strategy. The results provide clues as to how GM balance can be restored in neurological disorders via the regulation of hub bacteria. Second, we characterized the GM-associated metabolic landscapes from the periphery to the cortex using a neural network approach, improving our understanding of the microbiota – metabolite – brain axis. Third, we investigated the causal relationships between the GM and metabolite alterations under the pathogenetic stress of AD using mediation effect analysis, yielding valuable insights into the mechanisms that underlie the gut – brain axis. Although previous studies have explored the GM or metabolic profiles in both animal models of AD and patients with AD,Citation21,Citation44,Citation45,Citation48 few reports describe the alterations of GM-associated metabolic landscapes from peripheral to central tissues or the regulatory mechanisms of the GM – metabolite – brain axis under the pathogenetic pressure of AD. Meanwhile, our study systematically delineated the microbiota-driven metabolic alterations from the periphery to the cortex by integrating the microbiome and metabolome, thereby deciphering the bidirectional GM – host communication via metabolites. Thus, these findings reveal the adaptive and feedback mechanisms of the GM in response to host pathogenetic factors and provide new directions for developing interventions and treatments for AD that target gut – brain communication.
Methods
Mouse rearing and tissue harvesting
All animal procedures were approved by the Institutional Animal Care and Use Committee of the Shenzhen Institute of Advanced Technology, Chinese Academy of Sciences, in accordance with the National Care and Use of Laboratory Animals Guidelines (China). The APPswe/PSEN1dE9 (APP/PS1) mouse model was generated based on the amyloid cascade hypothesisCitation58 and harbors the human mutations identified in patients with familial AD.Citation59 This mouse model of AD is widely used to study neurodegenerative phenotypes, such as cognitive decline, synaptic failure, immune dysfunction, and altered metabolism.Citation60–63 Therefore, it is an ideal model to study the alterations of the GM under AD pathogenetic pressure and how they affect peripheral to central metabolism. APP/PS1 mice exhibit the first signs of Aβ plaque deposition in the cortex at 4 months of age, which gradually spreads to the hippocampus and broader areas in the cortex by 6 months of age.Citation64 At 9 months of age, Aβ plaque loads become abundant in these mice and are associated with apparent memory and cognitive deficits.Citation60,Citation65 Monitoring the amyloid load in cortical brain regions by positron emission tomography (PET) is often used to predict the rate of cognitive decline in clinical studies.Citation66 Therefore, it is of interest to investigate the cortical metabolomic profile in AD and explore its relationship with peripheral metabolism. The double-transgenic mice incorporate a chimeric human/murine APP construct bearing the Swedish double mutation and the exon-9-deleted PSEN1 mutation (APPSwe + PSEN1dE9). These mice were generated by co-injection of transgenes, resulting in chromosomal co-localization and co-segregation of APP and PSEN1. The APP/PS1 mice were maintained as double hemizygotes through crossings with WT siblings. Previous studies show sex differences in the GM composition and that estrogen can mediate GM alterations and influence metabolism in mice.Citation67,Citation68 In addition, some studies demonstrate that GM manipulation by antibiotic treatment can attenuate AD pathology in male mice but not female mice.Citation69,Citation70 To avoid the variation caused by sex differences and hormone fluctuations, we used only male mice in this study.
We purchased the male APP/PS1 double-transgenic mice (B6C3-Tg [APPswe, PSEN1dE9] 85Dbo/J; stock number 2010–0001) and their age-matched WT littermates from the Nanjing Biomedical Research Institute (Nanjing University, China). We segregated the mice according to genotype after weaning at 4 weeks of age (3–4 animals per cage, 3 cages per group) to avoid potential sharing of microbiota between groups owing to the coprophagic nature of mice.Citation71,Citation72 Animals had free access to sterilized water and standard chow, and were housed in a room with a 12-h light – dark cycle at 24°C. Fresh stool samples were harvested from individual male mice at 9 months old (n = 10 per group), instantly frozen, and stored at − 80°C for further analysis. Blood samples were collected and allowed to coagulate at room temperature before centrifuged for 10 minutes at 2,000 × g at 4°C. Serum was then collected and stored at − 80°C. After decapitation, the entire mouse brain was rapidly removed and transferred to cold saline. The cortex was then dissected from each hemisphere on ice, snap-frozen, and stored at − 80°C.
Metabolite isolation
For the fecal samples, we added 160 μL extraction solvent (methanol – acetonitrile – water = 2:2:1) to 20 mg feces together with stable-isotope internal standards. We then vortexed the solution for 2 min at 4°C, incubated it for 20 min on ice, and centrifuged it for 20 min at 14,000 rpm at 4°C. We used a 96-well protein precipitation plate to collect the supernatant liquid and dried it in a vacuum centrifuge at 4°C for targeted metabolomic detection.
For the serum samples, we added 80 μL methanol – acetonitrile mixture (1:1) and stable-isotope internal standards to 10-μL serum samples. After adequate vortexing, we centrifuged the solution for 20 min at 14,000 rpm at 4°C. We subsequently collected the supernatant and dried it with a vacuum centrifuge at 4°C.
For the cortical tissues, we also added 160 μL extraction solvent and stable-isotope internal standards to 10-mg samples. Then, we homogenized the mixture (24 × 2, 6.0 M/S, 60 s, twice) using FastPrep-24 homogenizer (MP Biomedicals, Santa Ana, CA, USA) and sonicated it twice for 30 min at 4°C. After centrifuging the mixture at 14,000 rpm for 20 min at 4°C, we collected the supernatant liquid and dried the metabolites with a vacuum centrifuge at 4°C.
Targeted metabolomic examination
We dissolved the isolated metabolites with 10 μL acetonitrile and water (1:1). We then vortexed the solution, centrifuged it for 15 min at 14,000 rpm and 4°C, and collected the supernatant liquid for target metabolite examination. In this study, we adopted ultra-high-performance liquid chromatography coupled to triple-quadrupole linear ion-trap tandem mass spectrometry (UHPLC-QTRAP-MS/MS) to measure 346 targeted metabolites in samples (Shanghai Applied Protein Technology, Shanghai, China). In brief, we used an Agilent 1290 Infinity II Multisampler (Agilent Technologies, Santa Clara, CA, USA) to pump the prepared samples through HILIC (temperature: 35°C, flow rate: 0.3 mL/min, sample volume: 2 μL) and C18 (temperature: 40°C, flow rate: 0.4 mL/min, sample volume: 2 μL) columns for metabolite separation and signal recording. We then examined the metabolites with the QTRAP 6500 mass spectrometry system (SCIEX, Framingham, MA, USA) under a multi-reaction monitoring model (sheath and dry gas temperature: 350°C, sheath and dry gas flow: 11 and 10 L/min, respectively).
We used MultiQuant Software (version 3.0.2) to isolate the raw peak intensities of the targeted metabolites from the output data according to their retention times and calculated the quantities of the targeted metabolites based on the peak intensity ratios between the targeted metabolites and internal standards.
DNA extraction and 16S rRNA sequencing
In this study, we adopted the CTAB (cetyltrimethylammonium bromide) method for DNA extraction. For each sample, we weighed 20 mg mouse feces, mixed them with 400 μL CTAB buffer (2%), and then incubated the solution for 1 h at 65°C. During the incubation, the solution was vortexed at 10-min intervals. We then added 400 μL chloroform and isoamyl alcohol (24:1) and vortexed the solution for 2 min. After centrifuging the solution for 10 min at 12,000 rpm, we transferred the supernatant liquid to a new PCR tube and added another 350 μL chloroform – isoamyl alcohol mixture. Repeating the process of vortexing and centrifuging, we mixed the supernatant liquid with an equal volume of isopropanol and stored the solution for 2 h at − 20°C. We then we centrifuged the mixture for 10 min at 15,000 rpm, removed the supernatant liquid, and obtained the DNA precipitate.
We diluted the DNA to 1 ng/μL solution with sterile water and amplified the 16S rRNA V3–V4 regions using 338F (5′-ACTCCTACGGGAGGCAGCAG-3′) and 806 R (5′-GGACTACHVGGGTWTCTAAT-3′) primers with Phusion High-Fidelity PCR Master Mix (New England Biolabs, Boston, MA, USA). We then purified the PCR products using an AxyPrep DNA Gel Extraction Kit (Axygen, New York, NY, USA). Next, we used a NEBNext Ultra DNA Library Prep Kit (New England Biolabs, Boston, MA, USA) to construct the libraries and committed the products to the MiSeq platform (Illumina, San Diego, CA, USA) for 300-nt paired-end sequencing after library quality assessment (Qubit 2.0 Fluorometer, Thermo Fisher Scientific, Waltham, MA, USA).
Taxonomical and functional annotation
We filtered the reads from the raw data when they contained more than 10 low-quality (i.e., <Q30) bases or 15 bases of adapter sequences. We then performed taxonomical annotation with the filtered reads using QIIME2 software (version 2021.11.0).Citation73 First, we connected the high-quality paired-end reads into tags using the VSEARCH function.Citation74 Second, we detected the amplicon sequence variants (ASVs) for all samples using Deblur software (version 2021.11). Third, we applied the sklearn-based taxonomy classifier and trained the Silva database (version 13-8-99) for taxonomical annotation.Citation75 Next, using the “vegan” package in R, we evaluated the data volume for the samples with the rarefaction curve function (bootstrap = 500, Supplementary Figure S1). Using PICRUSt2 software (version 2.3.0), we predicted the microbial functions based on the ASVs and obtained the distributions of KEGG Orthology and metabolic pathways for all samples based on the ASVs and taxonomic profiling.Citation76
Gut – brain function prediction
Based on previously published GBMs, we analyzed the neurological-related bacterial functions.Citation77 First, we collected the KEGG Orthology (KO) list for each GBM and retained non-redundant KOs. Second, we calculated the GBM abundances in the samples based on the KEGG Orthology distributions. Finally, we identified the genera that contained the KOs and GBMs through the ASVs and taxonomic profiling.
Bacterial co-occurrence network construction and topological analyses
To construct bacterial co-occurrence networks, we detected the correlation coefficients between the genera for each group with SparCC software,Citation78 calculated the P-values for the correlations (permutation = 100), and retained the relationships with r < −0.4 or r > 0.4 (p < 0.05). We plotted the bacterial co-occurrence networks using Gephi (version 0.9.2).Citation79 Based on the correlation matrix, we analyzed the topological features of the co-occurrence network, including the average degree, average path length, clustering coefficient, graph density, and connectance using the “igraph” package in R.Citation80 In the GM network, we designated the bacteria and their associations as nodes and links for the networks. Moreover, we detected the degree distributions by fitting a linear trend for each network and defined the nodes whose degree exceeded the third quartile among all nodes as the hub bacteria for the co-occurrence networks.
Construction of machine learning models of the gut microbiota and metabolomes in hosts
To investigate the associations between gut microbiota on host metabolites, we utilized MMvec software to establish shallow neural networks linking the normalized GM (Supplementary Figure S2) and the metabolites in feces, serum, and cortical tissues (Supplementary Figure S3).Citation81 First, we transformed the GM and metabolite data into BIOM format using the QIIME2 software (version 2020.06.0).Citation73 Next, we constructed multiple shallow neural networks with varying parameters (i.e., epochs and batch size) and assessed model performance based on training loss curves and cross-validation statistics (Supplementary Figure S4). We subsequently assessed the predictive accuracy of the models based on Q Citation2 scores and examined the relationships of different genera to metabolite levels in distinct tissues.
Mediation effect analysis
To infer the impacts of the GM on AD occurrence, we adopted bidirectional mediation analysis to determine whether fecal, serum, and cortical metabolites meditate the GM and AD phenotypes.Citation82 First, we constructed mixed linear models between the gut bacteria and metabolites using the “lme4” package in R as follows: metabolites ~ bacteria + (metabolites | groups).Citation83 We then constructed logistic regression models between the groups and metabolites with Probit regression using the glm function in R as follows: groups ~ metabolites + bacteria. Based on these 2 models, we detected the mediation impacts of metabolites between the variables (i.e., bacteria) and the outcomes (i.e., AD or WT group) using the “mediation” package in R.Citation84
scRNA data collection and analysis
We collected the public accessible scRNA data from previous study.Citation38,Citation39 With the collected scRNA data, we performed quality control and gene clustering by using “Seurat” (version 5.0.0) package from R.Citation85 We removed the genes if they were unexpressed across all cells or fewer than three cells. In addition, we excluded abnormal cells based on deviations in their feature count, number of expressed features, or percentage of mitochondrial genes, ensuring these metrics remained within the range of 2.5% to 97.5%. Then, we normalized the counts of unique molecular identifiers and identified variable features with SCTransform (variable.features.n = 3000). With the identified variable features, we further performed principal component analysis (npcs = 100) and selected the top 50 principal components for downstream analysis. We identified clusters within samples with FindNeighbors and FindClusters (resolution = 1.1), and removed doublets according to the recommendations of 10× Genomics with DoubletFinder (version 2.0.3).Citation86 All cells passing initial quality control were integrated using Harmony (version 1.1.0).Citation87 To determine the optimal number of harmony components, we calculated the percentage of the standard deviation explained by each harmony component followed by the cumulative summation of these percentages. Next, we filtered the number of harmony components based on the following criteria: (1) the cumulative percentage exceeded 90%, and individual components explained at least 5% of the variance; (2) the detection of points where the percentage difference between adjacent harmony components was greater than 0.1%. The smaller value passing the two criteria was chosen as the ultimate number of harmony components. The integrated data were further visualized via uniform manifold approximation and projection.
Statistics
Given the compositional feature of the GM, we performed centered log-ratio transformation for GM normalization before other inferential statistics.Citation88 Then, we determined the bacterial diversity by calculating the Shannon and Chao1 indices using the “vegan” package in R.Citation89 To detect the general features of the GM, we performed PCoA on all samples on the basis of Atchison distances using the “vegan” package in R. After filtering the taxonomical features present in less than three samples, we performed differential analysis between the AD and WT groups by adopting the global test in ANCOM-BC software (version 2.4.0).Citation90 To detect differentially enriched GBMs between groups, we used STAMP software (version 2.1.3) with a 2-tailed Welch’s t-test (p < .05).Citation91 For the metabolomic data, we performed log2 transformation after internal sample standardization. With the normalized metabolite annotation results, we performed OPLS-DA to detect the differences between different groups and obtained the VIP values for the metabolites using the “ropls” package in R (permutation = 100). We also applied Welch’s t-test to determine differentially enriched metabolites between groups and defined the metabolites with both p < .05 and VIP > 1.5 as being significantly crucial for AD occurrence. We adopted the EVenn tool to detect the shared and unique metabolites (i.e., VIP > 1) across different tissues.Citation92 After determining the contributions of the GM to metabolites from the MMvec software, we visualized their relationships with Cytoscape software (version 3.8.0).Citation93 We adjusted for multiple statistical tests using the Benjamini – Hochberg method (adjusted p < .05) and plotted the results using the “ggplot2” package in R.
Author contributions
Y.J.C, Y.H.L, and Y.C conceived of the project, designed the experiments, and wrote the manuscript. Y.J.C. and Y.Y.F performed the experiments. Y.J.C, Y.H.L, S.C., L.C, Y.W.C, and Y.C analyzed the data. All authors reviewed the manuscript.
Supplementary Figure 4.tif
Download TIFF Image (618.3 KB)Supplementary Table 2.xlsx
Download MS Excel (20 KB)Supplementary Table 1.xlsx
Download MS Excel (25.1 KB)Supplementary Table 5.csv
Download Comma-Separated Values File (49.1 KB)Supplementary Figure 5.tif
Download TIFF Image (928 KB)Supplementary Table 6.csv
Download Comma-Separated Values File (219.1 KB)Supplementary Figure 2.tif
Download TIFF Image (425.1 KB)Supplementary Figure 1.tif
Download TIFF Image (943.3 KB)Supplementary Table 4.xls
Download MS Excel (353.5 KB)Supplementary Figure 6.tiff
Download TIFF Image (958.3 KB)Supplementary Table 3.xlsx
Download MS Excel (136.1 KB)Supplementary Figure 3.tif
Download TIFF Image (830.9 KB)Supplementary Figure 7.tiff
Download TIFF Image (592.5 KB)Acknowledgments
We thank the members of the Chen Laboratory for their helpful discussions and insights.
Disclosure statement
No potential conflict of interest was reported by the author(s).
Data availability statement
The dataset supporting the conclusions of this article is available in the NCBI Sequence Read Archive repository under BioProject accession number PRJNA815698 (https://dataview.ncbi.nlm.nih.gov/object/PRJNA815698?reviewer=4daauib1h4drvj8v5lfbc2rmhh). The code for the complex network-based gut microbiota modeling algorithm is publicly available at GitHub (https://github.com/liyinhu/GM_network_modeling). To acquire any other study information or data for reasonable uses, please kindly message the e-mail for correspondence.
Supplementary material
Supplemental data for this article can be accessed online at https://doi.org/10.1080/19490976.2024.2302310
Additional information
Funding
References
- Coyte KZ, Rakoff-Nahoum S. Understanding competition and cooperation within the mammalian gut microbiome. Curr Biol. 2019;29(11):R538–22. doi:10.1016/j.cub.2019.04.017.
- Liu Z, Dai X, Zhang H, Shi R, Hui Y, Jin X, Zhang W, Wang L, Wang Q, Wang D. et al. Gut microbiota mediates intermittent-fasting alleviation of diabetes-induced cognitive impairment. Nat Commun. 2020;11(1):855. doi:10.1038/s41467-020-14676-4.
- Strandwitz P, Kim KH, Terekhova D, Liu JK, Sharma A, Levering J, McDonald D, Dietrich D, Ramadhar TR, Lekbua A. et al. GABA-modulating bacteria of the human gut microbiota. Nat Microbiol. 2019;4(3):396–403. doi:10.1038/s41564-018-0307-3.
- Cattaneo A, Cattane N, Galluzzi S, Provasi S, Lopizzo N, Festari C, Ferrari C, Guerra UP, Paghera B, Muscio C. et al. Association of brain amyloidosis with pro-inflammatory gut bacterial taxa and peripheral inflammation markers in cognitively impaired elderly. Neurobiol Aging. 2017;49:60–8. doi:10.1016/j.neurobiolaging.2016.08.019.
- Zhuang ZQ, Shen LL, Li WW, Fu X, Zeng F, Gui L, Lü Y, Cai M, Zhu C, Tan Y-L. et al. Gut microbiota is altered in patients with Alzheimer’s disease. J Alzheimers Dis. 2018;63(4):1337–46. doi:10.3233/JAD-180176.
- Nishiwaki H, Ito M, Ishida T, Hamaguchi T, Maeda T, Kashihara K, Tsuboi Y, Ueyama J, Shimamura T, Mori H. et al. Meta-analysis of gut dysbiosis in Parkinson’s disease. Mov Disord. 2020;35(9):1626–35. doi:10.1002/mds.28119.
- 2021 Alzheimer’s disease facts and figures. Alzheimers Dement. 2021;17(3):327–406. doi:10.1002/alz.12328.
- John A, Reddy PH. Synaptic basis of Alzheimer’s disease: focus on synaptic amyloid beta, P-tau and mitochondria. Ageing Res Rev. 2021;65:101208. doi:10.1016/j.arr.2020.101208.
- Li B, He Y, Ma J, Huang P, Du J, Cao L, Wang Y, Xiao Q, Tang H, Chen S. et al. Mild cognitive impairment has similar alterations as Alzheimer’s disease in gut microbiota. Alzheimers Dement. 2019;15(10):1357–66. doi:10.1016/j.jalz.2019.07.002.
- Hyland NP, Cryan JF. Microbe-host interactions: influence of the gut microbiota on the enteric nervous system. Dev Biol. 2016;417(2):182–7. doi:10.1016/j.ydbio.2016.06.027.
- Doifode T, VV G, RJS G, Bhatti G, Collodel A, PE S, Forlenza OV, Barichello T. The impact of the microbiota-gut-brain axis on Alzheimer’s disease pathophysiology. Pharmacol Res. 2021;164:105314. doi:10.1016/j.phrs.2020.105314.
- Gao X, Su X, Han X, Wen H, Cheng C, Zhang S, Li W, Cai J, Zheng L, Ma J. et al. Unsaturated fatty acids in mental disorders: an umbrella review of meta-analyses. Adv Nutr. 2022;13(6):2217–2236. doi:10.1093/advances/nmac084.
- Canhada S, Castro K, Perry IS, Luft VC. Omega-3 fatty acids’ supplementation in Alzheimer’s disease: a systematic review. Nutr Neurosci. 2018;21(8):529–38. doi:10.1080/1028415X.2017.1321813.
- Welty FK. Omega-3 fatty acids and cognitive function. Curr Opin Lipidol. 2023;34(1):12–21. doi:10.1097/MOL.0000000000000862.
- Sun Y, Zhang H, Zhang X, Wang W, Chen Y, Cai Z, Wang, Q, Wang, J, Shi, Y. Promotion of astrocyte-neuron glutamate-glutamine shuttle by SCFA contributes to the alleviation of Alzheimer’s disease. Redox Biol. 2023;62:102690. doi:10.1016/j.redox.2023.102690.
- Varma VR, Oommen AM, Varma S, Casanova R, An Y, Andrews RM, O’Brien R, Pletnikova O, Troncoso JC, Toledo J. et al. Brain and blood metabolite signatures of pathology and progression in Alzheimer disease: a targeted metabolomics study. PLoS Med. 2018;15(1):e1002482. doi:10.1371/journal.pmed.1002482.
- van der Lee SJ, Teunissen CE, Pool R, Shipley MJ, Teumer A, Chouraki V, Melo van Lent D, Tynkkynen J, Fischer K, Hernesniemi J. et al. Circulating metabolites and general cognitive ability and dementia: evidence from 11 cohort studies. Alzheimer’s & Dementia. 2018;14(6):707–722. doi:10.1016/j.jalz.2017.11.012.
- Huo Z, Yu L, Yang J, Zhu Y, Bennett DA, Zhao J. Brain and blood metabolome for Alzheimer’s dementia: findings from a targeted metabolomics analysis. Neurobiol Aging. 2020;86:123–33. doi:10.1016/j.neurobiolaging.2019.10.014.
- Mulak A. Bile acids as key modulators of the brain-gut-microbiota axis in Alzheimer’s disease. J Alzheimers Dis. 2021;84(2):461–77. doi:10.3233/JAD-210608.
- MahmoudianDehkordi S, Arnold M, Nho K, Ahmad S, Jia W, Xie G, Louie G, Kueider‐Paisley A, Moseley MA, Thompson JW. et al. Altered bile acid profile associates with cognitive impairment in Alzheimer’s disease—an emerging role for gut microbiome. Alzheimers Dement. 2019;15(1):76–92. doi:10.1016/j.jalz.2018.07.217.
- Baloni P, Funk CC, Yan J, Yurkovich JT, Kueider-Paisley A, Nho K, Heinken A, Jia W, Mahmoudiandehkordi S, Louie G. et al. Metabolic Network Analysis reveals altered bile acid synthesis and metabolism in Alzheimer’s disease. Cell Rep Med. 2020;1(8):100138. doi:10.1016/j.xcrm.2020.100138.
- Liu B, Yao J, Ma B, Chen Z, Zhao C, Zhu X, Li M, Cao Y, Pang W, Li H. et al. Microbial community profiles in soils adjacent to mining and smelting areas: contrasting potentially toxic metals and co-occurrence patterns. Chemosphere. 2021;282:130992. doi:10.1016/j.chemosphere.2021.130992.
- Song P, Xiao Y, Ren ZJ, Brooks JP, Lu L, Zhou B, Zhou Y, Freguia S, Liu Z, Zhang N. et al. Electrochemical biofilm control by reconstructing microbial community in agricultural water distribution systems. J Hazard Mater. 2021;403:123616. doi:10.1016/j.jhazmat.2020.123616.
- Hurwitz BL, Westveld AH, Brum JR, Sullivan MB. Modeling ecological drivers in marine viral communities using comparative metagenomics and network analyses. Proc Natl Acad Sci U S A. 2014;111(29):10714–9. doi:10.1073/pnas.1319778111.
- Li Y, Chen Y, Fan Y, Chen Y, Chen Y. Dynamic network modeling of gut microbiota during Alzheimer’s disease progression in mice. Gut Microbes. 2023;15(1):2172672. doi:10.1080/19490976.2023.2172672.
- Charalambous A, Giannakopoulou M, Bozas E, Paikousis L. Parallel and serial mediation analysis between pain, anxiety, depression, fatigue and nausea, vomiting and retching within a randomised controlled trial in patients with breast and prostate cancer. BMJ Open. 2019;9(1):e026809. doi:10.1136/bmjopen-2018-026809.
- Klumparendt A, Nelson J, Barenbrugge J, Ehring T. Associations between childhood maltreatment and adult depression: a mediation analysis. Bmc Psychiatry. 2019;19(1):36. doi:10.1186/s12888-019-2016-8.
- Nishiwaki H, Hamaguchi T, Ito M, Ishida T, Maeda T, Kashihara K, Tsuboi Y, Ueyama J, Shimamura T, Mori H. et al. Short-chain fatty acid-producing gut microbiota is decreased in Parkinson’s disease but not in rapid-eye-movement sleep behavior disorder. mSystems. 2020;5(6). doi:10.1128/mSystems.00797-20.
- Gao K, Mu CL, Farzi A, Zhu WY. Tryptophan metabolism: a link between the gut microbiota and brain. Adv Nutr. 2020;11(3):709–723. doi:10.1093/advances/nmz127.
- Erny D, Dokalis N, Mezo C, Castoldi A, Mossad O, Staszewski O, Frosch M, Villa M, Fuchs V, Mayer A. et al. Microbiota-derived acetate enables the metabolic fitness of the brain innate immune system during health and disease. Cell Metab. 2021;33(11):2260–76 e7. doi:10.1016/j.cmet.2021.10.010.
- Parker A, Fonseca S, Carding SR. Gut microbes and metabolites as modulators of blood-brain barrier integrity and brain health. Gut Microbes. 2020;11(2):135–57. doi:10.1080/19490976.2019.1638722.
- Jena PK, Sheng L, Di Lucente J, Jin LW, Maezawa I, Wan YY. Dysregulated bile acid synthesis and dysbiosis are implicated in western diet–induced systemic inflammation, microglial activation, and reduced neuroplasticity. FASEB J. 2018;32(5):2866–2877. doi:10.1096/fj.201700984RR.
- Wang L, Luo G, Zhang LF, Geng HX. Neuroprotective effects of epoxyeicosatrienoic acids. Prostaglandins Other Lipid Mediat. 2018;138:9–14. doi:10.1016/j.prostaglandins.2018.07.002.
- Koeth RA, Wang Z, Levison BS, Buffa JA, Org E, Sheehy BT, Britt EB, Fu X, Wu Y, Li L. et al. Intestinal microbiota metabolism of L-carnitine, a nutrient in red meat, promotes atherosclerosis. Nat Med. 2013;19(5):576–85. doi:10.1038/nm.3145.
- Tsai YW, Lu CH, Chang RC, Hsu YP, Ho LT, Shih KC. Palmitoleic acid ameliorates palmitic acid-induced proinflammation in J774A.1 macrophages via TLR4-dependent and TNF-alpha-independent signallings. Prostaglandins Leukot Essent Fatty Acids. 2021;169:102270. doi:10.1016/j.plefa.2021.102270.
- Okami H, Kawaharada R, Yoshizaki H, Toriumi A, Tsutsumi S, Nakamura A. Maternal n-7 unsaturated fatty acids protect the fetal brain from neuronal degeneration in an intrauterine hyperglycemic animal model. Nutrients. 2023;15(15):15. doi:10.3390/nu15153434.
- Yulug B, Altay O, Li X, Hanoglu L, Cankaya S, Lam S, Velioglu HA, Yang H, Coskun E, Idil E. et al. Combined metabolic activators improve cognitive functions in Alzheimer’s disease patients: a randomised, double-blinded, placebo-controlled phase-II trial. Transl Neurodegener. 2023;12(1):4. doi:10.1186/s40035-023-00336-2.
- Lau SF, Cao H, Fu AKY, Ip NY. Single-nucleus transcriptome analysis reveals dysregulation of angiogenic endothelial cells and neuroprotective glia in Alzheimer’s disease. Proc Natl Acad Sci U S A. 2020;117(41):25800–9. doi:10.1073/pnas.2008762117.
- Zhou Y, Song WM, Andhey PS, Swain A, Levy T, Miller KR, Poliani PL, Cominelli M, Grover S, Gilfillan S. et al. Human and mouse single-nucleus transcriptomics reveal TREM2-dependent and TREM2-independent cellular responses in Alzheimer’s disease. Nat Med. 2020;26(1):131–42. doi:10.1038/s41591-019-0695-9.
- Suzuki S, Hongli Q, Okada A, Kasama T, Ohta K, Warita K, Tanaka K, Miki T, Takeuchi Y. BDNF-dependent accumulation of palmitoleic acid in CNS neurons. Cell Mol Neurobiol. 2012;32(8):1367–1373. doi:10.1007/s10571-012-9863-x.
- Allesina S, Tang S. Stability criteria for complex ecosystems. Nature. 2012;483(7388):205–8. doi:10.1038/nature10832.
- Liu YY, Slotine JJ, Barabasi AL. Controllability of complex networks. Nature. 2011;473(7346):167–73. doi:10.1038/nature10011.
- Shukla PK, Delotterie DF, Xiao J, Pierre JF, Rao R, McDonald MP, Khan MM. Alterations in the gut-microbial-inflammasome-brain axis in a mouse model of Alzheimer’s disease. Cells. 2021;10(4):10. doi:10.3390/cells10040779.
- Harach T, Marungruang N, Duthilleul N, Cheatham V, Mc Coy KD, Frisoni G, Neher JJ, Fåk F, Jucker M, Lasser T. et al. Reduction of abeta amyloid pathology in APPPS1 transgenic mice in the absence of gut microbiota. Sci Rep. 2017;7(1):41802. doi:10.1038/srep41802.
- Kameno K, Hasegawa Y, Hayashi K, Takemoto Y, Uchikawa H, Mukasa A, Kim-Mitsuyama S. Loss of body weight in old 5xFAD mice and the alteration of gut microbiota composition. Exp Gerontol. 2022;166:111885. doi:10.1016/j.exger.2022.111885.
- Kim N, Jeon SH, Ju IG, Gee MS, Do J, Oh MS, Lee JK. Transplantation of gut microbiota derived from Alzheimer’s disease mouse model impairs memory function and neurogenesis in C57BL/6 mice. Brain Behav Immun. 2021;98:357–365. doi:10.1016/j.bbi.2021.09.002.
- Elangovan S, Borody TJ, Holsinger RMD. Fecal microbiota transplantation reduces pathology and improves cognition in a mouse model of Alzheimer’s disease. Cells. 2022;12(1):12. doi:10.3390/cells12010119.
- Jasbi P, Shi X, Chu P, Elliott N, Hudson H, Jones D, Serrano G, Chow B, Beach TG, Liu L. et al. Metabolic profiling of neocortical tissue discriminates Alzheimer’s disease from mild cognitive impairment, high pathology controls, and normal controls. J Proteome Res. 2021;20(9):4303–17. doi:10.1021/acs.jproteome.1c00290.
- Chen C, Liao J, Xia Y, Liu X, Jones R, Haran J, McCormick B, Sampson TR, Alam A, Ye K. et al. Gut microbiota regulate Alzheimer’s disease pathologies and cognitive disorders via PUFA-associated neuroinflammation. Gut. 2022;71(11):2233–52. doi:10.1136/gutjnl-2021-326269.
- Simao JJ, Cruz MM, Abdala FM, Bolsoni-Lopes A, Armelin-Correa L, Alonso-Vale MIC. Palmitoleic acid acts on adipose-derived stromal cells and promotes anti-hypertrophic and anti-inflammatory effects in obese mice. Pharm (Basel). 2022;15(10):15. doi:10.3390/ph15101194.
- Yang ZH, Pryor M, Noguchi A, Sampson M, Johnson B, Pryor M, Donkor K, Amar M, Remaley AT. Dietary palmitoleic acid attenuates atherosclerosis progression and hyperlipidemia in low-density lipoprotein receptor-deficient mice. Mol Nutr Food Res. 2019;63(12):e1900120. doi:10.1002/mnfr.201900120.
- Guo X, Jiang XF, Chen KY, Liang QJ, Zhang SX, Zheng J, Ma X, Jiang H, Wu H, Tong Q. et al. The role of palmitoleic acid in regulating hepatic gluconeogenesis through SIRT3 in obese mice. Nutrients. 2022;14(7):14. doi:10.3390/nu14071482.
- Liu TH, Wang J, Zhang CY, Zhao L, Sheng YY, Tao GS. Gut microbial characteristical comparison reveals potential anti-aging function of Dubosiella newyorkensis in mice. Front Endocrinol (Lausanne). 2023;14:1133167. doi:10.3389/fendo.2023.1133167.
- Zhuge AX, Li SJ, Lou PC, Wu WR, Wang KC, Yuan Y, Xia J, Li B, Li L. Longitudinal 16S rRNA sequencing reveals relationships among alterations of gut microbiota and nonalcoholic fatty liver disease progression in mice. Microbiol Spectr. 2022;10(3):10. doi:10.1128/spectrum.00047-22.
- Campbell C, McKenney PT, Konstantinovsky D, Isaeva OI, Schizas M, Verter J, Mai C, Jin W-B, Guo C-J, Violante S. et al. Bacterial metabolism of bile acids promotes generation of peripheral regulatory T cells. Nature. 2020;581(7809):475–9. doi:10.1038/s41586-020-2193-0.
- Sato Y, Atarashi K, Plichta DR, Arai Y, Sasajima S, Kearney SM, Suda W, Takeshita K, Sasaki T, Okamoto S. et al. Novel bile acid biosynthetic pathways are enriched in the microbiome of centenarians. Nature. 2021;599(7885):458–464. doi:10.1038/s41586-021-03832-5.
- Zamroziewicz MK, Paul EJ, Zwilling CE, Barbey AK. Determinants of fluid intelligence in healthy aging: Omega-3 polyunsaturated fatty acid status and frontoparietal cortex structure. Nutr Neurosci. 2018;21(8):570–9. doi:10.1080/1028415X.2017.1324357.
- Hardy JA, Higgins GA. Alzheimer’s disease: the amyloid cascade hypothesis. Sci. 1992;256:184–5. doi:10.1126/science.1566067.
- Jankowsky JL, Zheng H. Practical considerations for choosing a mouse model of Alzheimer’s disease. Mol Neurodegener. 2017;12(1):89. doi:10.1186/s13024-017-0231-7.
- Hulshof LA, Frajmund LA, van Nuijs D, van der Heijden DCN, Middeldorp J, Hol EM. Both male and female APPswe/PSEN1dE9 mice are impaired in spatial memory and cognitive flexibility at 9 months of age. Neurobiol Aging. 2022;113:28–38. doi:10.1016/j.neurobiolaging.2021.12.009.
- Krivinko JM, Erickson SL, MacDonald ML, Garver ME, Sweet RA. Fingolimod mitigates synaptic deficits and psychosis-like behavior in APP/PSEN1 mice. Alzheimers Dement (N Y). 2022;8(1):e12324. doi:10.1002/trc2.12324.
- Altendorfer B, Unger MS, Poupardin R, Hoog A, Asslaber D, Gratz IK, Mrowetz H, Benedetti A, de Sousa DMB, Greil R. et al. Transcriptomic profiling identifies CD8+ T cells in the brain of aged and Alzheimer’s disease transgenic mice as tissue-resident memory T cells. J Immunol. 2022;209(7):1272–1285. doi:10.4049/jimmunol.2100737.
- Andersen JV, Christensen SK, Aldana BI, Nissen JD, Tanila H, Waagepetersen HS. Alterations in cerebral cortical glucose and glutamine metabolism precedes amyloid plaques in the APPswe/PSEN1dE9 mouse model of Alzheimer’s disease. Neurochem Res. 2017;42(6):1589–98. doi:10.1007/s11064-016-2070-2.
- Jackson HM, Soto I, Graham LC, Carter GW, Howell GR. Clustering of transcriptional profiles identifies changes to insulin signaling as an early event in a mouse model of Alzheimer’s disease. Bmc Genom. 2013;14(1):831. doi:10.1186/1471-2164-14-831.
- Jankowsky JL, Fadale DJ, Anderson J, Xu GM, Gonzales V, Jenkins NA, Copeland NG, Lee MK, Younkin LH, Wagner SL. et al. Mutant presenilins specifically elevate the levels of the 42 residue β-amyloid peptide in vivo: evidence for augmentation of a 42-specific γ secretase. Hum Mol Genet. 2004;13(2):159–170. doi:10.1093/hmg/ddh019.
- Pemberton HG, Collij LE, Heeman F, Bollack A, Shekari M, Salvado G, Alves IL, Garcia DV, Battle M, Buckley C. et al. Quantification of amyloid PET for future clinical use: a state-of-the-art review. Eur J Nucl Med Mol Imaging. 2022;49(10):3508–28. doi:10.1007/s00259-022-05784-y.
- Markle JG, Frank DN, Mortin-Toth S, Robertson CE, Feazel LM, Rolle-Kampczyk U, von Bergen M, McCoy KD, Macpherson AJ, Danska JS. et al. Sex differences in the gut microbiome drive hormone-dependent regulation of autoimmunity. Sci. 2013;339(6123):1084–8. doi:10.1126/science.1233521.
- Kaliannan K, Robertson RC, Murphy K, Stanton C, Kang C, Wang B, Hao L, Bhan AK, Kang JX. Estrogen-mediated gut microbiome alterations influence sexual dimorphism in metabolic syndrome in mice. Microbiome. 2018;6(1):205. doi:10.1186/s40168-018-0587-0.
- Minter MR, Zhang C, Leone V, Ringus DL, Zhang X, Oyler-Castrillo P, Musch MW, Liao F, Ward JF, Holtzman DM. et al. Antibiotic-induced perturbations in gut microbial diversity influences neuro-inflammation and amyloidosis in a murine model of Alzheimer’s disease. Sci Rep. 2016;6(1):30028. doi:10.1038/srep30028.
- Dodiya HB, Kuntz T, Shaik SM, Baufeld C, Leibowitz J, Zhang X, Gottel N, Zhang X, Butovsky O, Gilbert JA. et al. Sex-specific effects of microbiome perturbations on cerebral Aβ amyloidosis and microglia phenotypes. J Exp Med. 2019;216(7):1542–1560. doi:10.1084/jem.20182386.
- Kong G, Cao KL, Judd LM, Li S, Renoir T, Hannan AJ. Microbiome profiling reveals gut dysbiosis in a transgenic mouse model of Huntington’s disease. Neurobiol Dis. 2020;135:104268. doi:10.1016/j.nbd.2018.09.001.
- Gubert C, Kong G, Uzungil V, Zeleznikow-Johnston AM, Burrows EL, Renoir T, Hannan AJ. Microbiome profiling reveals gut dysbiosis in the metabotropic glutamate receptor 5 knockout mouse model of schizophrenia. Front Cell Dev Biol. 2020;8:582320. doi:10.3389/fcell.2020.582320.
- Bolyen E, Rideout JR, Dillon MR, Bokulich NA, Abnet CC, Al-Ghalith GA, Alexander H, Alm EJ, Arumugam M, Asnicar F. et al. Reproducible, interactive, scalable and extensible microbiome data science using QIIME 2. Nat Biotechnol. 2019;37(8):852–7. doi:10.1038/s41587-019-0209-9.
- Rognes T, Flouri T, Nichols B, Quince C, Mahe F. VSEARCH: a versatile open source tool for metagenomics. PeerJ. 2016;4:e2584. doi:10.7717/peerj.2584.
- Quast C, Pruesse E, Yilmaz P, Gerken J, Schweer T, Yarza P, Peplies J, Glöckner FO. The SILVA ribosomal RNA gene database project: improved data processing and web-based tools. Nucleic Acids Res. 2013;41(D1):D590–6. doi:10.1093/nar/gks1219.
- Douglas GM, Maffei VJ, Zaneveld JR, Yurgel SN, Brown JR, Taylor CM, Huttenhower C, Langille MGI. PICRUSt2 for prediction of metagenome functions. Nat Biotechnol. 2020;38(6):685–688. doi:10.1038/s41587-020-0548-6.
- Valles-Colomer M, Falony G, Darzi Y, Tigchelaar EF, Wang J, Tito RY, Schiweck C, Kurilshikov A, Joossens M, Wijmenga C. et al. The neuroactive potential of the human gut microbiota in quality of life and depression. Nat Microbiol. 2019;4(4):623–32. doi:10.1038/s41564-018-0337-x.
- Friedman J, Alm EJ, von Mering C. Inferring correlation networks from genomic survey data. PLoS Comput Biol. 2012;8(9):e1002687. doi:10.1371/journal.pcbi.1002687.
- Bastian M, Heymann S, Jacomy M. Gephi: an open source software for exploring and manipulating networks. Proceedings of the International AAAI Conference on Web and Social Media, San Jose, California, USA. 2009. doi:10.1609/icwsm.v3i1.13937.
- Csardi G, Nepusz T. The igraph software package for complex network research. Int J Complex Syst. 2006;1695:1–9.
- Morton JT, Aksenov AA, Nothias LF, Foulds JR, Quinn RA, Badri MH, Swenson TL, Van Goethem MW, Northen TR, Vazquez-Baeza Y. et al. Learning representations of microbe–metabolite interactions. Nat Methods. 2019;16(12):1306–1314. doi:10.1038/s41592-019-0616-3.
- Lv BM, Quan Y, Zhang HY. Causal Inference in Microbiome Medicine: Principles and Applications. Trends Microbiol. 2021;29(8):736–46. doi:10.1016/j.tim.2021.03.015.
- Bates D, Machler M, Bolker BM, Walker SC. Fitting linear mixed-effects models using lme4. J Stat Softw. 2015;67(1):1–48. doi:10.18637/jss.v067.i01.
- Imai K, Keele L, Tingley D, Yamamoto T. Causal Mediation Analysis Using R. Adv Soc Sci Res Using R. 2010;196:129–154.
- Hao Y, Stuart T, Kowalski MH, Choudhary S, Hoffman P, Hartman A, Srivastava A, Molla G, Madad S, Fernandez-Granda C. et al. Dictionary learning for integrative, multimodal and scalable single-cell analysis. Nat Biotechnol. 2023. doi:10.1038/s41587-023-01767-y.
- McGinnis CS, Murrow LM, ZJ G. DoubletFinder: doublet detection in single-cell RNA sequencing data using artificial nearest neighbors. Cell Syst. 2019;8(4):329–37 e4. doi:10.1016/j.cels.2019.03.003.
- Korsunsky I, Millard N, Fan J, Slowikowski K, Zhang F, Wei K, Baglaenko Y, Brenner M, Loh P-R, Raychaudhuri S. et al. Fast, sensitive and accurate integration of single-cell data with Harmony. Nat Methods. 2019;16(12):1289–96. doi:10.1038/s41592-019-0619-0.
- Aitchison J. The statistical-analysis of compositional data. J Roy Stat Soc B. 1982;44(2):139–177. doi:10.1111/j.2517-6161.1982.tb01195.x.
- Dixon P. VEGAN, a package of R functions for community ecology. J Veg Sci. 2003;14(6):927–930. doi:10.1111/j.1654-1103.2003.tb02228.x.
- Lin H, Peddada SD. Analysis of compositions of microbiomes with bias correction. Nat Commun. 2020;11(1):3514. doi:10.1038/s41467-020-17041-7.
- Parks DH, Tyson GW, Hugenholtz P, Beiko RG. STAMP: statistical analysis of taxonomic and functional profiles. Bioinformatics. 2014;30(21):3123–4. doi:10.1093/bioinformatics/btu494.
- Chen T, Zhang H, Liu Y, Liu YX, Huang L. Evenn: easy to create repeatable and editable venn diagrams and venn networks online. J Genet Genomics. 2021;48(9):863–866. doi:10.1016/j.jgg.2021.07.007.
- Shannon P, Markiel A, Ozier O, Baliga NS, Wang JT, Ramage D, Amin N, Schwikowski B, Ideker T. Cytoscape: a software environment for integrated models of biomolecular interaction networks. Genome Res. 2003;13(11):2498–2504. doi:10.1101/gr.1239303.