
ABSTRACT
Constructing synthetic microbial consortia is a challenging task but holds enormous potential for various applications. Our previous droplet-based microfluidic approach allowed for the isolation of bacteria that could utilize metabolites from an engineered bacterium BsS-RS06551 with anti-obesity potential, facilitating the construction of synthetic microbial consortia. Here, we identified a strain of Bifidobacterium pseudocatenulatum JJ3 that interacted with BsS-RS06551, and in vitro coculture showed that BsS-RS06551 was likely to interact with JJ3 through five dipeptides. Pathway analysis revealed that the vitamin B6 metabolism pathway was enriched in the coculture of BsS-RS06551 and JJ3 compared with the individual culture of BsS-RS06551. Additionally, we confirmed that the administration of JJ3 significantly alleviated obesity and related disorders in mice fed a high-fat diet. Notably, continuous ingestion of the synthetic microbial consortium comprising BsS-RS06551 and JJ3 not only exhibited a more pronounced impact on alleviating obesity compared to the individual administration of BsS-RS06551 or JJ3 but also enriched the population of Bifidobacterium longum and perturbed the vitamin B6 metabolism pathway in the gut. Synthetic microbial consortia represent a promising frontier for synthetic biology, and our strategy provides guidance for constructing and applying such consortia.
Introduction
Synthetic microbial consortia refer to groups of microorganisms that have been designed and engineered to work together toward a common goal.Citation1 These consortia have the potential to perform complicated tasks that are challenging or impossible for individual populations because of their sophisticated metabolic capabilities and robustness.Citation2 Designing synthetic microbial consortia involves selecting and engineering microorganisms with complementary metabolic capabilities, as well as optimizing interactions between different species.Citation3 However, designing synthetic microbial consortia is a complex and challenging process that requires a deep understanding of the metabolic capabilities and interactions of different microorganisms, as well as the development of synthetic biology tools to engineer and control their behaviors.Citation4,Citation5 Additionally, optimizing interactions between different microorganisms in synthetic microbial consortia is crucial for achieving the desired function or task.Citation6 Strategies such as spatial organization, metabolic cross-feeding, and communication between microorganisms are essential for effective optimization, but can be technically challenging to develop and implement.Citation7,Citation8
Previously, we successfully engineered a butyrate-producing bacterium, BsS-RS06551, on a Bacillus subtilis host and demonstrated its potential anti-obesity effects in mice.Citation9 Additionally, we developed a droplet-based microfluidic (DBM) approach to isolate and enrich gut bacteria capable of utilizing metabolites produced by BsS-RS06551.Citation10 This strategy can help identify microorganisms that interact with BsS-RS06551 and aid in the construction of synthetic microbial consortia.
In this study, we employed our previous DBM approach using medium plates containing metabolites produced by BsS-RS06551 to obtain Bifidobacterium pseudocatenulatum JJ3 bacteria. We then evaluated the potential of JJ3 in inhibiting obesity and related disorders in mice fed a high-fat diet. In vitro coculture of BsS-RS06551 and JJ3 confirmed that BsS-RS06551 promoted the growth of JJ3. Moreover, we evaluated the effectiveness of BsS-RS06551, JJ3, and a synthetic microbial consortium in ob/ob mice, a model of spontaneous obesity. To elucidate the underlying mechanisms of the gut microbiota and its metabolites in the mouse intervention strategies, we employed both microbiota sequencing and untargeted metabolomics analyses.
Results
Identification of suitable isolates for a synthetic microbial consortium
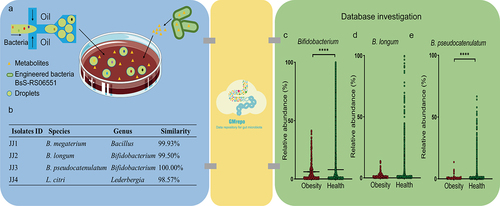
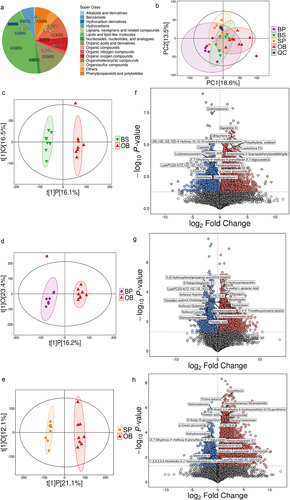
We employed a DBM approach using medium plates containing metabolites produced by BsS-RS06551 to obtain four representative isolates (). By utilizing the GMrepo database, a curated database of consistently annotated human gut metagenomes,Citation11 we identified the most suitable isolates to construct a synthetic microbial consortium that improves obesity. Interestingly, we observed that at the genus level, the relative abundance of Bifidobacterium was significantly higher in the healthy cohort than in the obese cohort (p < .0001; ). Based on this observation, we identified two candidate species: B. longum and B. pseudocatenulatum. Our analysis revealed that while B. longum was present in both the healthy and obese cohorts at similar levels (), B. pseudocatenulatum showed a significant decrease in relative abundance in obese patients compared to healthy individuals. Specifically, B. pseudocatenulatum had a relative abundance of 1.34314% and a frequency of occurrence of 43.4% (7066/16282) in the healthy cohort, while in the obese cohort, its relative abundance was only 0.63427% and the frequency of occurrence was 19.747% (187/947). The observed difference was statistically significant (p < .0001, ). Leveraging this finding, we constructed synthetic microbial consortia by exploiting the cross-feeding interactions between the isolated B. pseudocatenulatum JJ3 and BsS-RS06551. To demonstrate the efficacy of this approach, we first investigated the ability of isolated JJ3 to alleviate obesity and related disorders.
Figure 1. The workflow for isolating potential anti-obesity species interacting with BsS-RS06551. (a) A schematic showing the enrichment and isolation of the bacteria interacting with BsS-RS06551 using a previously constructed DBM approach. (b) The result of the obtained species. (c) The relative abundance of Bifidobacterium between healthy and obese cohorts. The relative abundance of B. longum (d) and B. pseudocatenulatum (e) between healthy and obese cohorts. *p <.0001.
B. pseudocatenulatum JJ3 improved obesity in HFD-induced mice
To evaluate the effects of B. pseudocatenulatum JJ3 on obesity and metabolic disorders, three groups of mice were treated with the following regimens for ten weeks: a normal diet (C) group with PBS, a high-fat diet (HFD) group with PBS, and a high-fat diet group with 2 × 10⁹ CFU freshly prepared live B. pseudocatenulatum JJ3 (HBP) (). First, we observed a significant inhibitory effect of oral gavage of JJ3 on weight gain in mice on a high-fat diet after ten weeks compared to the PBS-treated HFD group (p <.0001; ). Additionally, oral gavage of JJ3 (HBP) for ten weeks resulted in a 6.03-gram reduction in HFD-induced weight gain (). We also found that the HBP group showed a significant reduction in food intake per mouse per day (p <.0001; ), which corresponded to a significant reduction in the weight of the mesenteric, epididymal, and perirenal fat deposits (). Furthermore, the size of adipocytes in the mesenteric adipose tissue of JJ3-treated mice was decreased (Fig. S1, S2).
Figure 2. The effect of B. pseudocatenulatum JJ3 on high-fat diet induced obesity. (a) Experimental design. (b) Body weight change curve. (c) Cumulative weight gain. (d) Daily food intake per mouse. (e) Mesenteric, epididymal and perirenal fat weight at the end of the 10-week period. (f) Fasting glucose. (g) Fasting insulin. (h) Insulin resistance index (HOMA-IR). (i) Blood glucose curve and mean area under the curve (AUC) measured during an insulin tolerance test (ITT). (j) Blood glucose curve and mean AUC measured during an oral glucose tolerance test (OGTT). (k) Liver weight. (l) Hematoxylin and eosin (H&E) staining and oil red O staining of and livers. The scale bar is 100 µm. (m) Serum total bile acids (TBA) levels. (n) Serum alanine transaminase (ALT) levels. (o) Serum aspartate transaminase (AST) levels. (p) Serum physiological indexes. TG: triglyceride levels; TC: total cholesterol levels; LDL: low-density lipoprotein levels; HDL: high-density lipoprotein levels. *p <.05; **p <.01; ***p <.001; ****p <.0001.
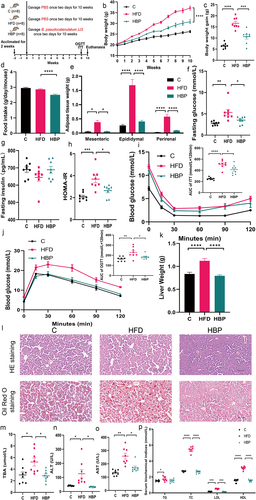
To examine the effect of JJ3 on HFD-induced obesity-related insulin resistance, we measured fasting plasma glucose and fasting plasma insulin levels in mice, and assessed the homeostasis model assessment of insulin resistance (HOMA-IR). As shown in , compared with the HFD group, the fasting blood glucose levels of the mice in the control and HBP groups were significantly decreased (p < .01), indicating that JJ3 could improve the abnormal blood glucose levels caused by the high-fat diet. However, fasting plasma insulin levels of the HFD group were lower than those of the control and HBP groups. (). JJ3 significantly decreased HOMA-IR (p < .05; ). Next, the glucose tolerance and insulin resistance of the mice in each group were further tested. We found that after insulin injection, blood glucose decreased rapidly in both the HFD-fed mice and the HBP mice but increased slowly in the HBP mice. The AUC of the ITT of the HFD group was also significantly larger than that of the HBP group (p < .05; ). In addition, the results of the OGTT showed that the glucose tolerance of HFD-fed mice decreased, and the body’s ability to consume glucose decreased. After exogenous administration of glucose, blood glucose increased relatively rapidly and decreased slowly. Excitingly, oral JJ3 could significantly improve glucose tolerance. The AUC of the OGTT of the HFD group was also significantly larger than that of the HBP group (p <.05; ).
The HFD-induced mice often developed hepatic steatosis.Citation12 Therefore, we further assessed biochemical markers of liver function and histopathological changes in liver tissue among the three groups. Unsurprisingly, compared to the control group, the HFD group showed a significant increase in liver weight (p <.0001). However, the liver weight in the HBP group was decreased to 70.8% of that in the HFD group (). Furthermore, JJ3 treatment apparently reduced macrosteatosis and hepatocyte ballooning, as indicated by the H&E and Oil Red O staining results of liver sections. (). We also measured serum total bile acid (TBA) levels, serum alanine transaminase (ALT) levels and serum aspartate transaminase (AST) levels, which are related to liver function. The results showed that the levels of TBA, ALT and AST in HBP mice were significantly lower than those in HFD-fed mice (p < .05; ). Obviously, the livers of HFD-induced mice were severely damaged, and the red fat droplets indicated that the liver had accumulated an abundance of fat. Finally, we measured the serum biochemical indices of all mice, which are shown in and include total cholesterol (TC), triglyceride (TG), low-density lipoprotein (LDL), and high-density lipoprotein (HDL) levels. JJ3 effectively improved blood dyslipidemia by reducing the concentrations of TC, TG, LDL and HDL. Specifically, the results showed that the levels of TG, LDL and HDL in HBP mice were significantly lower than those in HFD-fed mice (p <.0001). In summary, our study suggested that B. pseudocatenulatum JJ3 inhibited weight gain and alleviated metabolic disorders in HFD-induced mice.
Coculture of BsS-RS06551 and JJ3
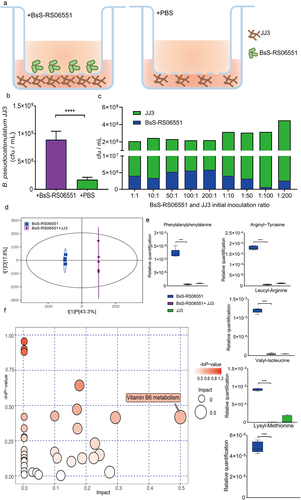
We further confirmed that BsS-RS06551 significantly promoted the growth of B. pseudocatenulatum JJ3 using a Transwell system (p <.0001; ). According to the GMrepo database, in a healthy cohort, the relative abundance of Bacillus subtilis, the original species of BsS-RS06551, is 0.02%, while the relative abundance of B. pseudocatenulatum is 1.34%. These data indicate that the abundance ratio of the two is 1:67. Then, an in vitro mixed culture of BsS-RS06551 and JJ3 was performed. In the mixed-culture, the results were consistent with the database, and the abundance of JJ3 was dominant after 24 hours of culture, regardless of the initial inoculum ratio of the two bacteria. The ratio of BsS-RS06551 to JJ3 was approximately 1:119 (). We compared the metabolites in the fermentation broths and found that the metabolites of the two fermentation broths differed significantly (). Interestingly, we found that the levels of five dipeptides in the mixed culture of BsS-RS06551 and JJ3 were significantly lower compared to the culture of BsS-RS06551 alone (p <.001; ). The results showed that JJ3 could utilize five dipeptides produced by BsS-RS06551. In addition, metabolic pathway analysis revealed that the vitamin B6 metabolism pathway was enriched in the coculture of BsS-RS06551 and JJ3 compared with the individual culture of BsS-RS06551 ().
Figure 3. Co-culture of BsS-RS06551 and JJ3. (a) A schematic diagram of the co-culture setup. (b) The abundance of JJ3 under co-culture conditions with or without BsS-RS06551. (c) The abundance of BsS-RS06551 and JJ3 after mixed culture in vitro. (d) The scatter plot of the OPLS-DA model. (e) Relative quantification of five dipeptides. (f) Pathway analyses of differentially metabolites in the co-culture of BsS-RS06551 and JJ3 compared with the individual culture of BsS-RS06551. *p <.0001.
The synthetic microbial consortium alleviated obesity and related disorders in ob/ob mice better than BsS-RS06551 or JJ3 alone
The health benefits of many commensal bacteria have been elucidated, suggesting the potential to form well-defined commensal microbial consortia for disease treatment.Citation13 As both BsS-RS06551 and B. pseudocatenulatum JJ3 alleviate obesity, assembling these well-characterized strains into a synthetic microbial consortium to reestablish health benefits is an attractive strategy. We explored the effect of the microbial consortium consisting of JJ3 and the engineered bacterium BsS-RS06551 on obesity and related disorders in ob/ob mice. According to the GMrepo database, the relative abundance ratio of B. subtilis, the original species of BsS-RS06551 and B. pseudocatenulatum in the healthy cohort, is 1:67. After 24 hours of coculture, the ratio of BsS-RS06551 to B. pseudocatenulatum JJ3 was approximately 1:119. Therefore, ob/ob mice were gavaged daily with PBS (OB), BsS-RS06551 (BS), JJ3 (BP), or the microbial consortium using BsS-RS06551 and JJ3 in a 1:100 ratio (SP) for a period of 6 weeks, with C57BL/6J (C57) mice as the control. Fresh cultures of all bacteria were prepared for each treatment group ().
Figure 4. The microbial consortium attenuated obesity and related disorders in ob/ob mice. (a) Experimental design. (b) Changes in the body weight of ob/ob mice over 6 weeks. (c) Body weight gain. (d) LEE’s index. (e) Weekly food intake per mouse. (f) Weights of different white adipose tissues (mesenteric, epididymal and perirenal fat). (g) Fasting glucose. (h) Fasting insulin. (i) HOMA-IR. (j) Blood glucose curve and mean AUC measured during an ITT. (k) Blood glucose curve and mean AUC measured during an OGTT. (l) H&E staining and oil red O staining of and livers. The scale bar is 100 µm. (m) Liver weights. (n) Serum TBA levels. (o) Serum ALT levels. (p) Serum alkaline phosphatase (ALP) levels. (q) Serum AST levels. (r) Serum physiological and biochemical indices. *p <.05; **p <.01; ***p <.001; ****p <.0001.
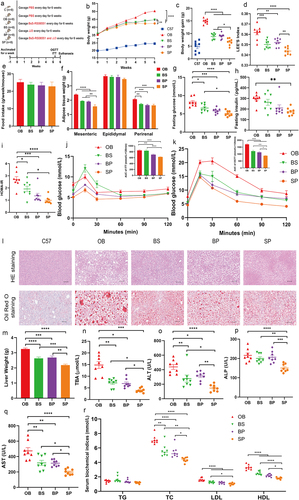
Compared to the PBS-treated ob/ob group, all live bacteria-treated ob/ob groups showed a significant reduction in weight gain (p < .0001). In particular, the effect of the SP treatment (synthetic microbial consortium-treated group) on obesity suppression was significantly better than that of the BS (BsS-RS06551-treated group) and BP (JJ3-treated group) treatments (p <.01) (). The results showed that gavaging the microbial consortium decreased the weight gain of ob/ob mice by 8.2 grams (). The LEE’s index was most substantially improved in the SP group (). The weekly food intake per mouse in the SP group was minimal (). Weight loss corresponded to a significant reduction in the weight of white adipose tissues. Treatment with the microbial consortium improved the fat composition better than that with BsS-RS06551 or JJ3 treatment alone (). Therefore, we measured the size of adipocytes in the mesenteric adipose tissue and found that the microbial consortium significantly increased the proportion of small adipocytes (Fig. S3a, b; S4).
Next, we measured fasting glucose and fasting insulin levels in mice to assess the effect of the microbial consortium on obesity-associated insulin resistance. The levels of fasting blood glucose and insulin were both higher in the OB group (PBS-treated group) than in the other groups (). The results indicated that the SP treatment inhibited the increase in HOMA-IR more effectively than the BP and BS treatments (). In addition, the mice in the SP group showed significantly lower AUC values in the ITT () and OGTT () compared to those in the OB, BS, and BP groups. The microbial consortium administration exhibited the most significant improvement in hyperglycemia and insulin resistance in ob/ob mice. H&E and Oil Red O staining were performed to detect histopathological changes (). The obvious red results indicated excess fat accumulation in the livers of ob/ob mice, whereas supplementation with BsS-RS06551, JJ3 or the microbial consortium attenuated hepatic steatosis and fat accumulation. Significantly lower liver weights were observed in the BS (p <.0001), BP (p <.001), and SP (p <.0001) groups compared to the OB group. The liver weights of the SP group were lower than those of the BS (p <.001) and BP (p <.01) groups (). The levels of total bile acid (TBA), alanine aminotransferase (ALT), alkaline phosphatase (ALP), and aspartate aminotransferase (AST) in serum were significantly decreased after the microbial consortium intervention compared to the BS, BP, and OB groups ().
The results of the serum biochemical indices of the mice are shown in , including the total cholesterol (TC), triglyceride (TG), high-density lipoprotein (HDL), and low-density lipoprotein (LDL) analyses. Specifically, ob/ob mice administered BsS-RS06551, JJ3, or the microbial consortium showed significantly lower levels of TC, LDL, and HDL than those of ob/ob mice, but no significant difference was observed in TG levels. Additionally, no signs of inflammation were observed histologically in the jejunum of mice treated with live bacteria, which was supported by measurements of the relative expression of pro-inflammatory markers. There were no deleterious effects on gut barrier markers (i.e., tight-junction proteins). Therefore, we confirmed that the bacterial treatment was well tolerated by the mice (Fig. S3c, d).
The synthetic microbial consortium enriched B. longum
A total of 3216 unique sequences were obtained from 32 samples, indicating that the number of species had reached saturation and covered most of the species (Fig. S5a). Significant differences were observed in the richness (indicated by the observed_otus, chao1, and dominance indices), diversity (indicated by the Shannon and Simpson indices), and uniformity (indicated by the pielou_e index) between the OB group and the other groups (). Moreover, the gut microbiota structure in the bacteria-treated ob/ob mice (the BP, BS, and SP groups) showed significant differences compared to that of PBS-treated ob/ob mice (the OB group), as evidenced by the principal coordinate analysis (PCoA). However, there were no significant differences in either the alpha-diversity or beta-diversity among the BP, BS, and SP groups. Compared with the single-bacteria treatment of BsS-RS06551 or JJ3, the synthetic microbial consortium more significantly altered the gut microbiota profile of ob/ob mice at the genus level (Fig. S5b). Hierarchical clustering analysis was performed on the top 50 genera based on relative abundance in the samples of the three intervention groups, which intuitively reflected the differences at the genus level between the synthetic microbial consortium intervention (SP) and the single-bacteria interventions (BS or BP) ().
Figure 5. The synthetic microbial consortium modulated the gut microbiota of ob/ob mice. (a) Alpha diversity analysis. (b) Principal Co-ordinates analysis (PCoA) based on Bray_Curtis distance. (c) The top 50 relative abundance genera. (d) The ternary plot among the BS, BP and SP groups. (e) Ecological network among differential bacteria in BS, BP and SP groups. (f) The correlation analysis between obesity-related metabolic indicators and differential bacteria. *p <.05; **p <.01.
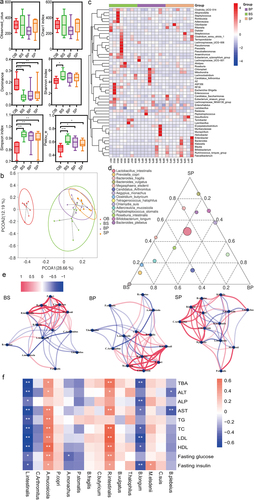
At the species level, our analysis revealed that the synthetic microbial consortium significantly increased the abundance of several bacterial species, including Lactobacillus intestinalis, Bifidobacterium longum, Aegypius monachus, Bacteroides plebeius, Bacteroides fragilis and Bacteroides vulgatus. In contrast, the BS group was mainly dominated by Megasphaera elsdenii, Clostridium butyricum, Adlercreutzia mucosicola, Chlamydia suis and Roseburia intestinalis, while Candidatus Arthromitus and Peptostreptococcus stomatis were more abundant in the BP group (). The interaction among microbes may contribute to obesity improvement. By analyzing the ecological networks of bacteria, we observed that the cooccurrence and coexcluding interactions among bacteria were significantly different in mice treated with BsS-RS06551, JJ3, and a synthetic microbial consortium (). We conducted a correlation analysis between obesity-related metabolic indicators and differential bacteria, which revealed negative correlations between the abundance of B. longum and metabolic indicators such as TBA, AST, ALP, ALT, TC, TG, HDL, LDL, fasting glucose, and fasting insulin (). Although there were no significant differences in the alpha diversity and beta diversity among the ob/ob mice treated with BsS-RS06551, JJ3, and a synthetic microbial consortium, we observed the importance of B. longum as a microbial species that is negatively associated with obesity-related physiological and biochemical indicators in mice. These findings suggest that the anti-obesity effect of the synthetic microbial consortium was superior to that of BsS-RS06551 and JJ3, possibly due to the enrichment of B. longum.
The synthetic microbial consortium altered gut microbiota-related metabolites in the cecal contents
Metabolites in the gut are closely related to the gut microbiota; therefore, we analyzed the cecal contents from mice after different bacterial gavage interventions using untargeted metabolomics analysis to determine the metabolic changes associated with the gut microbiota. This analysis was performed using an Ultra High Performance Liquid Chromatography-Orbitrap Exploris-Mass Spectrometry (UHPLC-OE-MS). The identified metabolites were predominantly lipids and lipid-like molecules (43.689%), organic acids and derivatives (15.042%), organoheterocyclic compounds (11.413%), phenylpropanoids and polyketides (7.559%), and organic oxygen compounds (6.727%) (). Principal component analysis (PCA) revealed clear separation of all groups (). The quality control (QC) sample, composed of an equal aliquot of all test samples, exhibited a distinct clustering effect, indicating that the sample analysis sequence was stable and reproducible. We next conducted supervised orthogonal projections to latent structures-discriminant analysis (OPLS-DA) to distinguish differences more accurately between the bacterial treatment groups and the model group. OPLS-DA showed that the metabolite profiles of mice gavaged with BsS-RS06551, JJ3, and the synthetic microbial consortium were all different from those of the model group (). To avoid overfitting, we conducted a test with 200 permutations to assess the validity of the discriminant models (Fig. S6a-c).
Figure 6. Analysis of metabolites and pathways under different interventions. (a) Differential metabolite classification and proportion. (b) PCA models of all groups. OPLS-DA models for groups BS vs OB (c), BP vs OB (d), SP vs OB (e). Volcano plots for groups BS vs OB (f), BP vs OB (g), SP vs OB (h).
We employed the variable importance in the projection (VIP) >1 and Student’s t test (p <.05) to screen the differentially expressed metabolites. Volcano plots were generated to highlight 294 metabolites that were differentially expressed (205 upregulated and 89 downregulated in the BS group) between the OB group and the BS group (). We identified 332 metabolites (238 upregulated and 94 downregulated in the BP group) that displayed significant differences in abundance between the OB group and the BP group (). Additionally, 504 differential metabolites (462 upregulated and 42 downregulated in the SP group) were identified between the OB group and the SP group (). Based on the metabolites analysis, we found that the synthetic microbial consortium of BsS-RS06551 and JJ3 more significantly altered the metabolite profiles of the ob/ob mice than BsS-RS06551 or JJ3 alone.
The synthetic microbial consortium perturbed the vitamin B6 metabolism pathway
The impact of the synthetic microbial consortium on the intestinal metabolite profile was found to differ from that of the single bacterial strains (BsS-RS06551 or JJ3) alone, as shown in Fig. S6d-g. Metabolic pathway analysis was performed to compare the effectiveness of the synthetic microbial consortium to that of single bacterial interventions. The results indicated that the differential pathways between the synthetic microbial consortium-treated mice and the BsS-RS06551-treated mice were mainly related to vitamin B6 metabolism; phenylalanine, tyrosine and tryptophan biosynthesis; histidine metabolism; and phenylalanine metabolism (). On the other hand, the main differential pathways between the synthetic microbial consortium-treated mice and the JJ3-treated mice were associated with vitamin B6 metabolism, cysteine and methionine metabolism, and histidine metabolism (). In contrast to the OB group, intervention in the SP group notably perturbed the vitamin B6 metabolic pathway as well (). In our pathway analyses, we observed an enrichment of the vitamin B6 metabolism pathway. Notably, this pathway was also enriched in the coculture of BsS-RS06551 and JJ3 in vitro compared to the individual culture of BsS-RS06551 (). These findings suggest the importance of the vitamin B6 metabolism pathway in the anti-obesity effect of the synthetic microbial consortium compared to single bacterial interventions.
Figure 7. Effects of the synthetic microbial consortium on metabolite and pathway interventions. Pathway analyses for groups SP vs BS (a), SP vs BP (b), SP vs OB (c). (d) Heatmap of differential metabolites involved in enriched metabolic pathways. (e) The correlation analysis between obesity-related metabolic indicators and differential metabolites. (f) Differential metabolites correlation analysis. Linear association between pyridoxal 5’-phosphate (g), pyridoxamine (h), 4-pyridoxic acid (i) and B. longum. *p <.05; **p <.01.
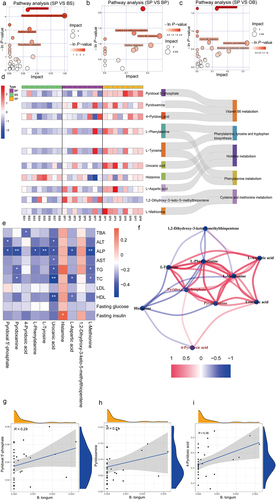
The differential metabolites involved in the enriched metabolic pathways mainly belonged to vitamin B6 and amino acids and their derivatives. The semiquantification results showed that the synthetic microbial consortium increased most of the contents of differentially expressed metabolites. Oral administration of the synthetic microbial consortium increased the levels of pyridoxal 5’-phosphate, pyridoxamine and 4-pyridoxic acid in the gut of ob/ob mice compared to the other groups of ob/ob mice (). Furthermore, the levels of L-phenylalanine, L-tyrosine, urocanic acid, L-aspartic acid and L-methionine were most abundant in the mice in the SP group. Deficiency of these products that require vitamin B6 to participate in metabolism might impact obesity in different ways.Citation14,Citation15 Specifically, in addition to histamine and 1,2-dihydroxy-3-keto-5-methylthiopentene, vitamin B6 and amino acids and their derivatives were negatively correlated with indicators of metabolic disorders ().
We noted that pyridoxal 5’-phosphate, pyridoxamine, and 4-pyridoxic acid, which serve as coenzymes in numerous enzymatic reactions involved in amino acid metabolism,Citation16 were significantly elevated. The metabolite correlation network showed a significant positive correlation between pyridoxal 5’-phosphate, pyridoxamine, 4-pyridoxic acid, and several amino acids and their derivatives, including L-phenylalanine, L-tyrosine, urocanic acid, L-aspartic acid, and L-methionine (). We further confirmed that the abundance of B. longum was positively correlated with the quantification of pyridoxal 5’-phosphate, pyridoxamine and 4-pyridoxic acid (). It is worth mentioning that the synthetic microbial consortium significantly enriched B. longum.
Discussion
With a DBM approach, we isolated B. pseudocatenulatum JJ3 from the feces of a healthy volunteer using medium containing the metabolites of BsS-RS06551. After confirming the ability of B. pseudocatenulatum JJ3 to improve obesity, we constructed a synthetic microbial consortium utilizing BsS-RS06551 and JJ3 to investigate their potential impact on obesity. Through coculture and mixed liquid coculture, we confirmed that BsS-RS06551 promoted the growth of JJ3 and found that the promoting effect was closely related to five dipeptides produced by BsS-RS06551. Importantly, the vitamin B6 metabolism pathway appeared to be the key pathway underlying the differences observed between the coculture of BsS-RS06551 and JJ3 and the single BsS-RS06551 culture. Our results confirm that supplementation with the engineered bacterium BsS-RS06551, JJ3 and the synthetic microbial consortium significantly inhibited body weight gain and fat accumulation in ob/ob mice, while ameliorating related metabolic disorders such as hyperlipidemia and insulin resistance. It is notable that the use of the synthetic microbial consortium exhibited a significantly superior impact on the improvement in obesity and associated metabolic disorders compared to the individual utilization of BsS-RS06551 and JJ3.
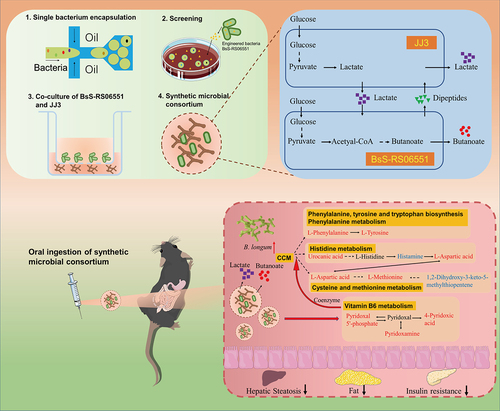
We summarized the possibility that the synthetic microbial consortium was more beneficial to ob/ob mice in terms of the gut microbiota and metabolism compared to BsS-RS06551 and JJ3 alone (). First, we found that B. pseudocatenulatum JJ3 was capable of producing L-lactate with a yield of 0.99 ± 0.07 g/L (Fig. S7). Lactic acid is beneficial in alleviating obesity.Citation17–19 The lactate produced by Bifidobacterium may be further utilized by BsS-RS06551 as a carbon source for the production of butyrate, a short-chain fatty acid that has many beneficial effects on gut health.Citation20,Citation21 At the same time, the addition of BsS-RS06551 altered the metabolite profiles of Bifidobacterium and may be beneficial for Bifidobacterium to occupy the intestinal niche.Citation22 Similar phenomena have also been found in other studies on the symbiotic relationship between Bifidobacterium and butyrate-producing bacteria in the gut microbiome.Citation22,Citation23 In summary, these interactions are beneficial for Bifidobacterium and Bs-RS06551 to alter the gut microbiota composition. Second, administration of a synthetic microbial consortium disrupted metabolic pathways related to vitamin B6 metabolism; phenylalanine, tyrosine and tryptophan biosynthesis; histidine metabolism; and cysteine and methionine metabolism. Interestingly, consistent with the in vitro coculture results, (), ingestion of the microbial consortium composed of BsS-RS06551 and JJ3 also disturbed the vitamin B6 metabolism pathway. Hence, the synthetic microbial consortium modulated the vitamin B6 metabolism pathway in the gut, leading to elevated levels of key metabolites including pyridoxal 5’-phosphate, pyridoxamine and pyridoxic acid. Pyridoxal 5’-phosphate is the biologically active form of vitamin B6 and is involved in amino acid metabolism as an important coenzyme.Citation24,Citation25 Many studies have shown that obesity is often accompanied by aberrant metabolism of amino acids. Supplementing vitamin B6 can ameliorate the accumulation of downstream catabolites of amino acids such as tryptophan and can protect mice from the effects of obesity. Pyridoxal 5’-phosphate is also necessary for the transamination of amino acids, which converts them into other forms that can be used for energy. This process helps to reduce fat accumulation and prevent obesity.Citation26,Citation27 The significance of this finding lies in the crucial role played by vitamin B6 in other disturbed metabolic processes, including phenylalanine, tyrosine and tryptophan biosynthesis; histidine metabolism; and cysteine and methionine metabolism. Furthermore, our results showed that pyridoxal 5’-phosphate, pyridoxamine, and 4-pyridoxic acid were significantly positively correlated with the abundance of B. longum, which was enriched by the synthetic microbial consortium. Interestingly, the DBM approach could also enrich B. longum by using medium containing the metabolites of BsS-RS06551. Furthermore, we postulated a potential link between butyrate and vitamin B6 metabolism. Butyrate is synthesized by specific intestinal bacteria, as a result of the fermentation of dietary fiber. These bacteria depend on a range of cofactors, including vitamin B6, to facilitate their metabolic functions. Maintaining optimal levels of vitamin B6 in the gut environment could potentially enhance the proliferation and functionality of butyrate-producing bacteria.
Figure 8. The summary of the possibilities to explain the more beneficial effect of synthetic microbial consortium on ob/ob mice compare to the individual strains of BsS-RS06551 and JJ3. Red and blue represent up- and down-regulated metabolites, respectively.
Synthetic microbial consortia are a promising advancement in microbiology and synthetic biology, offering potential for treating metabolic diseases. However, challenges persist in their design and implementation. To address these challenges, a DBM approach using a metabolite-containing medium can be used to screen and isolate interacting bacterial species. The GMrepo database aids in preliminary screenings. In vitro cocultivation confirmed the interactions, followed by animal experiments to validate their application. This approach can be extended to mine probiotics and develop bacterial therapies for gut microbiota-related diseases. Our strategy isolates strains that interact with engineered bacteria, enabling the creation of more robust and diverse consortia. This research offers a novel method for constructing synthetic microbial consortia and enhancing our understanding of microorganism interactions.
Conclusions
Constructing synthetic microbial consortia is challenging but holds immense potential. Our droplet-based microfluidic approach isolated bacteria that could utilize metabolites from the engineered bacterium BsS-RS06551, aiding consortium creation. We found that Bifidobacterium pseudocatenulatum JJ3 interacted with BsS-RS06551, likely via five dipeptides. Pathway analysis showed enriched vitamin B6 metabolism in their coculture. Administering JJ3 alleviated obesity and related disorders in high-fat diet-fed mice. A synthetic consortium of BsS-RS06551 and JJ3 outperformed the individual administration of either, increasing the abundance of Bifidobacterium longum and perturbing gut vitamin B6 metabolism. This strategy can be used to guide synthetic consortium construction and application, which will lead to promising advances in synthetic biology.
Materials and methods
Strains and culture
An engineered butyrate-producing bacterium strain based on Bacillus subtilis SCK6 host (BsS-RS06551) was previously created in-house. BsS-RS06551 were routinely cultured in Luria-Bertani (LB) liquid medium and LB agar plates at 37°C. B. megaterium JJ1, B. longum JJ2, L. citri JJ4 and B. pseudocatenulatum JJ3 were screened from feces of a 25-year-old healthy young male volunteer using our previously created DBM platform. Before each experiment, the anaerobic chamber (Shanghai Yuejin medical instruments Co. Ltd. HYQX-II) was filled with an anaerobic gas mixture (85% N2/10% CO2/5% H2) the day before. Freshly sampled fecal samples were transferred into anaerobic bags and then transferred to a pre-set anaerobic chamber as soon as possible. After anaerobic treatment for two hours, cores from fecal samples were dissolved and suspended in a pre-anaerobic treated YCFA medium. To prevent clogging of the microfluidic chip, the bacterial suspension was filtered through a 40 mm sieve to remove large food residues and particles. The bacterial suspension was diluted to ~ 7 × 10⁶ cells/mL, and then passed through the DBM platform to generate droplets containing single cells.Citation10 The single cell droplet was transferred to the medium plate containing the engineered bacteria metabolites and cultured for 72 hours, and then the single clone was picked and cultured in 5 ml YCFA medium. Then take 1 ml of bacterial liquid for strain preservation, and 1 ml for DNA extraction for strain identification.
The strain was identified by comparing the 16S rRNA gene sequences with the NCBI reference database (https://www.ncbi.nlm.nih.gov/). The strain used in this study showed 99.9% similarity to B. pseudocatenulatum in GenBank with the accession number NR_037117.1. B. pseudocatenulatum JJ3 were cultured in Yeast Casitone Fatty Acids (YCFA) liquid medium at 37°C in an anaerobic workstation. The anaerobic workstation was turned on and filled with an anaerobic gas mixture the day before the experiment. The workstation was supplied with an 85% N2/10% CO2/5% H2 gas mixture.
Co-culture of BsS-RS06551 and JJ3 in vitro using a transwell system
The transwell system used in this experiment consists of a 24-well plate with two separated compartments, a lower reservoir containing 700 μL of YCFA liquid medium, and an upper insert containing 200 μL of YCFA liquid medium. The upper compartments were inoculated with 4 μL BsS-RS06551 (5 × 10⁸ cfu/mL) or PBS, while the lower compartments were inoculated with 4 μL JJ3 (5 × 10⁸ cfu/mL). After 12 hours of anaerobic incubation, the colony-forming units (cfu) of JJ3 were counted. The bottom of the insert was covered with a 0.1 µm PET membrane to prevent bacterial migration.
In vitro liquid mixed culture of BsS-RS06551 and JJ3
A liquid mixed culture of BsS-RS06551 (5 × 10⁸ cfu/mL) and JJ3 (5 × 10⁸ cfu/mL) was inoculated into 50 mL of YCFA medium using the following ratios: 500 μL: 500 μL, 1000 μL: 100 μL, 1000 μL: 20 μL, 1000 μL: 10 μL, 1000 μL: 5 μL, 100 μL: 1000 μL, 20 μL: 1000 μL, 10 μL: 1000 μL, and 5 μL: 1000 μL. The culture was then anaerobically incubated for 24 hours, and the bacterial quantification was performed using qPCR. The primers used for the detection of BsS-RS06551 were Primer A (Forward: GCATACGGATCCAAAGGAGGCCATAATATGAGTCAG, Reverse: CCTGATCCGCGGCTATTTTTCTAATACCGTTCC).Citation28 For the detection of JJ3 using its full-length 16S rRNA gene, primers were designed using Primer 5.0 as follows: Primer B (Forward: GTCAGTAACGGCCCAGAGAC, Reverse: AGTAATGCGTGACCGACCTG). The genomic DNA was extracted from bacterial cultures using the TIANamp Bacteria DNA Kit (TIANGEN Biotech (Beijing) Co. Ltd.). The specificity of the primers for BsS-RS06551 and JJ3 was confirmed by PCR and agarose gel electrophoresis (Fig. S8a, b). A standard curve was established between the CP value and bacterial concentration: BsS-RS06551 was tested at concentrations of 6.21× (108, 107, 106, 105, 104, 103 cfu/mL, and JJ3 was tested at concentrations of 6.4× (108, 107, 106, 105, 104, 103 cfu/mL. The standard curve for the CP value and BsS-RS06551 concentration was shown in Fig. S8c, and the equation is Y = −3.774*X + 40.51, R2 = 0.9969. The standard curve of CP value and JJ3 concentration was shown in Fig. S8d, and the equation is Y = − 3.666*X + 38.95, R2 = 0.9924.
In vitro liquid mixed culture metabolites analysis
500 μL BsS-RS06551 (5 × 10⁸ cfu/mL) and 500 μL BsS-RS06551 (5 × 10⁸ cfu/mL) + 500 μL JJ3 (5 × 10⁸ cfu/mL) were separately inoculated into 50 mL of YCFA liquid medium for anaerobic culture for 24 hours. The supernatant of the fermentation broth was analyzed using Ultra High-Performance Liquid Chromatography-Orbitrap Exploris-Mass Spectrometry (UHPLC-OE-MS) for identification.
Mice experiments
All mice were acclimated in an SPF-grade laboratory animal facility maintained at a temperature of 22 ± 3°C and relative humidity of 55 ± 10% with free access to water and food under a 12-hour light:dark cycle. Body weight and food intake were recorded every two days. The mice bedding was changed daily to ensure a clean environment. After the experiment, the mice were fasted for 12 hours and then euthanized. Fresh blood was collected and left overnight at 4°C before centrifugation (at 3000 rpm and 4°C for 10 minutes) to isolate serum. The liver and adipose tissue were excised and weighed. The contents of the cecum and colon were collected, snap-frozen in liquid nitrogen, and stored at −80°C until analysis in Experiment 2. Untargeted metabolomic analysis of mice cecal contents was performed using ultra-high performance liquid chromatography-orbitrap exploris-mass spectrometry (UHPLC-OE-MS). Fresh cultures of all bacteria were prepared for each treatment group.
Experiment 1: Twenty-four male C57BL/6J mice aged 5 weeks were purchased from SPF Biotechnology Co. Ltd. (Beijing, China). After two weeks of acclimatization, the mice were randomly assigned to one of three groups (n = 8 per group): C, HFD, and HBP. During acclimatization, all mice were maintained on a normal diet (3.44 kcal/g of energy, with 13% from fat, 24% from protein, and 63% from carbohydrates). The HFD group and HBP group were fed a refined high-fat diet (4.73 kcal/g of energy, with 45% from fat, 20% from protein, and 35% from carbohydrates) obtained from SPF Biotechnology Co. Ltd. The C group was fed a control diet (3.44 kcal/g of energy, with 13% from fat, 24% from protein, and 63% from carbohydrates). The HBP group received 200 μL of freshly prepared 1 × 10¹⁰ cfu/mL live B. pseudocatenulatum JJ3 via oral gavage once every two days for ten weeks. In contrast, the C and HFD groups received 200 µL of PBS via oral gavage once every two days for ten weeks.
Experiment 2: Eight male C57BL/6J (6 week old) mice and 32 male ob/ob mice (6 week old) were purchased from Beijing Huafukang Bioscience Co. Ltd. (Beijing, China). After one week of acclimatization, the mice were divided into different groups. During acclimatization, all mice were maintained on a normal diet. The C57BL/6J mice were set as the control group (C57), and the remaining 32 ob/ob mice were randomly divided into four groups (n = 8 per group, with uniform body weight): OB, BS, BP, and SP. All mice were maintained on a normal diet provided by Beijing Keao Xieli Feed Co. Ltd. The first treatment involved oral administration of 200 μL of freshly prepared 1 × 10¹⁰ cfu/mL live engineered butyrate-producing bacterium BsS-RS06551 to each mouse in the BS group, while the BP group was orally administered 200 μL of freshly prepared 1 × 10¹⁰ cfu/mL live B. pseudocatenulatum JJ3. Each mouse in the SP group was orally administered 200 μL of a freshly prepared microbial consortium consisting of live BsS-RS06551 and JJ3 (total bacterial concentration 1 × 10¹⁰ cfu/mL, with a concentration ratio of 1:100). Each mouse in the C57 and OB groups was orally administered with 200 μL of PBS. Treatments were continued daily for 6 weeks.
Biochemical analysis
The serum biochemical indices, including triglyceride (TG), total cholesterol (TC), low-density lipoprotein (LDL), high-density lipoprotein (HDL), total bile acids (TBA), alanine transaminase (ALT), alkaline phosphatase (ALP) and aspartate transaminase (AST) were determined using a Mindray biochemical analyzer (Biossci, Tianjin, China). The level of plasma glucose was measured using a glucose meter (Accu-Chek, Roche, Switzerland), and insulin was measured using commercial insulin ELISA kits. The Homeostatic Model Assessment for Insulin Resistance (HOMA-IR) was calculated from the values of fasting blood glucose and fasting blood insulin using the following formula: HOMA-IR= [Plasma glucose (mmol/L) × serum insulin (mIU/L)]/22.5.
Insulin tolerance test (ITT) and oral glucose tolerance test (OGTT)
An ITT was performed by intraperitoneally injecting insulin (0.6 U/kg) following an 8-hour fast. An OGTT was conducted by administering 200 µL of a glucose solution (2 g/kg) via oral gavage after an overnight fast. Blood glucose levels were measured using a glucose meter at 0, 15, 30, 60, and 120 minutes after oral glucose administration. The area under the curve (AUC) was calculated from the data obtained during the OGTT using GraphPad 9.5.0.
Histopathological examination
Samples of liver and white adipose tissues were resected and fixed with 10% Neutral Formalin Fix Solution. The samples embedded in paraffin were sectioned and further stained with hematoxylin/eosin (HE stain) or Oil Red O. Moreover, the size of adipocytes in the white adipose tissues was calculated with ImageJ 1.53k and GraphPad 9.5.0.
Tissue RNA extraction and gene expression analysis by real-time qPCR analysis
Total RNA was extracted from tissues using TRIzol reagent (Invitrogen), and the concentration of the extracted RNA was determined using Nanodrop One (Thermo Scientific). cDNA was synthesized by reverse transcription of 500 ng of total RNA using PrimeScript™ RT Master Mix (Takara Bio USA, Inc.). Real-time PCR was performed using ChamQ Universal SYBR qPCR Master Mix (Vazyme) and LightCycler 480 software (Roche) according to the manufacturer’s instructions. The housekeeping gene Gapdh was used for normalization, and all samples were run on a single 96-well reaction plate. The data were analyzed using the 2−ΔΔCt method, and the identity and purity of the amplified products were verified by analyzing the melting curve at the end of the amplification. Primer sequences for the targeted mouse genes are provided in Table S1.
Gut microbiota sequencing and data analysis
DNA library preparation and 16S rRNA gene sequencing were performed by Novogene Co. Ltd. Tianjin, China. The CTAB/SDS method was used to extract the total genome DNA in samples. DNA concentration and purity were monitored on 1% agarose gels. According to the concentration, DNA was diluted to 1 ng/µl with sterile water. 16S rRNA gene in distinct regions (16S rRNA gene V3-V4) were amplified with specific primer and barcodes. All PCR mixtures contained 15 µl of Phusion® High-Fidelity PCR Master Mix (New England Biolabs), 0.2 µM of each primer and 10ng target DNA, and cycling conditions consisted of a first denaturation step at 98°C for 1 min, followed by 30 cycles at 98°C (10s), 50°C (30s) and 72°C (30s) and a final 5 min extension at 72°C. Mix an equal volume of 1X loading buffer (contained SYB green) with PCR products and perform electrophoresis on 2% agarose gel for DNA detection. The PCR products were mixed in equal proportions, and then Qiagen Gel Extraction Kit (Qiagen, Germany) was used to purify the mixed PCR products. Following manufacturer’s recommendations, sequencing libraries were generated with NEBNext® Ultra™ IIDNA Library Prep Kit. The library quality was evaluated on the Qubit@ 2.0 Fluorometer (Thermo Scientific) and Agilent Bioanalyzer 2100 system. Finally, the library was sequenced on an Illumina NovaSeq platform and 250 bp paired-end reads were generated.
Paired-end reads were assigned to samples based on their unique barcodes and were truncated by cutting off the barcodes and primer sequences. Paired-end reads were merged using FLASH (Version 1.2.11, http://ccb.jhu.edu/software/FLASH/),Citation29 a very fast and accurate analysis tool designed to merge paired-end reads when at least some of the reads overlap with the reads generated from the opposite end of the same DNA fragment, and the splicing sequences were called Raw Tags. Quality filtering on the raw tags were performed using the fastp (Version 0.20.0) software to obtain high-quality Clean Tags. The Clean Tags were compared with the reference database (Silva database https://www.arbsilva.de/for 16S rRNA gene) using Vsearch (Version 2.15.0) to detect the chimera sequences, and then the chimera sequences were removed to obtain the Effective Tags.Citation30 For the Effective Tags obtained previously, denoise was performed with DADA2 or deblur module in the QIIME2 software (Version QIIME2–202006) to obtain initial ASVs (Amplicon Sequence Variants) (default: DADA2), and then ASVs with abundance less than 5 were filtered out. Species annotation was performed using QIIME2 software. For 16S rRNA gene, the annotation database is Silva Database. The absolute abundance of ASVs was normalized using a standard of sequence number corresponding to the sample with the least sequences. Subsequent analysis of alpha diversity and beta diversity were all performed based on the output normalized data.
In order to analyze the diversity, richness and uniformity of the communities in the sample, the indices alpha diversity was calculated in QIIME2. In order to evaluate the complexity of the community composition and compare the differences between samples, beta diversity was calculated based on Bray_Curtis distance in QIIME2. Principal Coordinate Analysis (PCoA) was performed to obtain principal coordinates and visualize differences of samples in complex multi-dimensional data.
Metabolites extraction
Fermentation Broth: Shaked the bacterial fermentation liquid, quickly took 1 mL of culture liquid from the culture bottle, and centrifuged at 4°C (1000(×g), 10 min). 100 μL of the sample was transferred to an EP tube. After adding 300 μL of extract solution (methanol, containing isotopically-labeled internal standard mixture), the samples were vortexed for 30 s, and sonicated for 10 min in ice-water bath.
Mice cecal contents: 25 mg of sample was weighed into an EP tube, and 500 μL of extract solution (methanol: water = 3:1, with isotopically-labeled internal standard mixture) was added. The samples were then homogenized at 35 Hz for 4 minutes and sonicated for 5 minutes in an ice water bath. The homogenization and sonication cycle were repeated three times.
The samples were then incubated for 1 hour at −40°C and centrifuged at 12,000 rpm (RCF = 13,800(×g), R = 8.6 cm) for 15 minutes at 4°C. The resulting supernatant was transferred to a fresh glass vial for analysis. A quality control (QC) sample was prepared by mixing an equal aliquot of the supernatants from all the samples.
UHPLC-OE-MS
Ultra-high performance liquid chromatography-orbitrap exploris-mass spectrometry (UHPLC-OE-MS) was performed by BIOTREE in Shanghai, China. Briefly, LC-MS/MS analyses were performed using an UHPLC system (Vanquish, Thermo Fisher Scientific) with a UPLC HSS T3 column (2.1 mm × 100 mm, 1.8 μm) coupled to Orbitrap Exploris 120 mass spectrometer (Orbitrap MS, Thermo). The mobile phase consisted of 5 mmol/L ammonium acetate and 5 mmol/L acetic acid in water (A) and acetonitrile (B). The auto-sampler temperature was 4°C, and the injection volume was 2 μL. The Orbitrap Exploris 120 mass spectrometer was used for its ability to acquire MS/MS spectra on information-dependent acquisition (IDA) mode in the control of the acquisition software (Xcalibur, Thermo). In this mode, the acquisition software continuously evaluates the full scan MS spectrum. The ESI source conditions were set as follows: sheath gas flow rate as 50 Arb, Aux gas flow rate as 15 Arb, capillary temperature 320°C, full MS resolution as 60,000, MS/MS resolution as 15,000 collision energy as 10/30/60 in NCE mode, spray Voltage as 3.8 kV (positive) or −3.4 kV (negative), respectively.
The raw data were converted to the mzXML format using ProteoWizard and processed with an in-house program, which was developed using R and based on XCMS, for peak detection, extraction, alignment, and integration.Citation29 Then an in-house MS2 database (BiotreeDB) was applied in metabolite annotation. The cutoff for annotation was set at 0.3. The normalized dataset was imported into SIMCA (V16.0.2, Sartorius Stedim Data Analytics AB, Umea, Sweden) for multivariate statistical analysis. Principal component analysis (PCA), which is an unsupervised multivariate pattern recognition analysis, was performed to examine the intrinsic variation in the dataset. A supervised projection of orthogonal partial least squares discriminant analysis (OPLS-DA) was performed for class discrimination. In order to avoid overfitting, a permutation test (200 permutations) was performed. A threshold variable importance in the154 projection (VIP >1) obtained from the OPLS-DA model and the student’s t test (p < .05) were used to assess the significance of difference in abundance of metabolites. The KEGG database (http://www.genome.jp/kegg/) was used for pathway analysis.
Statistical analysis
For each condition, at least three independent repeated experiments were conducted. Unless otherwise stated, the data were presented as mean ± standard error of the mean (SEM). Statistical analysis was conducted using GraphPad 9.5.0 software and involved either a two-tailed Student’s t-test or a one-way ANOVA followed by Tukey’s multiple comparison test. p < 0.05 was considered statistically significant. *p < .05; **p < .01; ***p < .001; ****p < .0001.
Authors’ contributions
GK, HH, GQ, YW, LW, CX and MG designed the experiment. GK, HH, XC and MG planned and performed experiments. XC, LW and MG carried out data analysis. GK, HH, XC, LW and MG wrote the main manuscript text and prepared figures S1–8. XC, LW and MG wrote prepared figures S1-S8 and table S1. All authors reviewed the manuscript.
Availability of data and material
The 16S rRNA gene sequencing raw data generated in this study have been deposited in the NCBI under accession No. PRJNA967479. The raw data of non-targeted metabolomics reported in this study have been deposited in the ScienceDB database (https://www.scidb.cn/anonymous/cTJZanF1).
Ethics approval and consent to participate
All animal experiments were conducted in accordance with the guidelines set forth by the Animal Ethical and Welfare Committee (AEWC) and approved by Tianjin University (Approval No. TJUE-2023-167), ensuring the ethical and humane treatment of laboratory animals.
figure s8.tif
Download TIFF Image (1.9 MB)figure s1.tif
Download TIFF Image (2.5 MB)Additional file revision 2.docx
Download MS Word (3.8 MB)figure s3.tif
Download TIFF Image (6.2 MB)figure s5.tif
Download TIFF Image (5.3 MB)figure s2.tif
Download TIFF Image (279.7 KB)figure s6.tif
Download TIFF Image (4.1 MB)figure s4.tif
Download TIFF Image (100.1 KB)figure s7.tif
Download TIFF Image (1.1 MB)Acknowledgments
We are very grateful for Shanghai Biotree Biotech Co. Ltd for technical support at untargeted metabolomics services. We thank Scidraw and Servier Medical Art. The mice model element in were sourced from Scidraw.io. Parts of the were drawn by using pictures from Servier Medical Art. Servier Medical Art by Servier is licensed under a Creative Commons Attribution 3.0 Unported License.
Disclosure statement
No potential conflict of interest was reported by the author(s).
Supplementary material
Supplemental data for this article can be accessed online at https://doi.org/10.1080/19490976.2024.2304901
Additional information
Funding
References
- Duncker KE, Holmes ZA, You L. Engineered microbial consortia: strategies and applications. Microb Cell Fact. 2021;20(1):211. doi:10.1186/s12934-021-01699-9.
- Brenner K, You L, Arnold FH. Engineering microbial consortia: a new frontier in synthetic biology. Trends Biotechnol. 2008;26(9):483–21. doi:10.1016/j.tibtech.2008.05.004.
- Karkaria BD, Fedorec AJH, Barnes CP. Automated design of synthetic microbial communities. Nat Commun. 2021;12(1):672. doi:10.1038/s41467-020-20756-2.
- Grandel NE, Reyes Gamas K, Bennett MR. Control of synthetic microbial consortia in time, space, and composition. Trends Microbiol. 2021;29(12):1095–1105. doi:10.1016/j.tim.2021.04.001.
- Dang Z, Gao M, Wang L, Wu J, Guo Y, Zhu Z, Huang H, Kang G. Synthetic bacterial therapies for intestinal diseases based on quorum-sensing circuits. Biotechnol Adv. 2023;65:108142. doi:10.1016/j.biotechadv.2023.108142.
- Kong W, Meldgin DR, Collins JJ, Lu T. Designing microbial consortia with defined social interactions. Nat Chem Biol. 2018;14(8):821–9. doi:10.1038/s41589-018-0091-7.
- Deter HS, Lu T. Engineering microbial consortia with rationally designed cellular interactions. Curr Opin Biotechnol. 2022;76:102730. doi:10.1016/j.copbio.2022.102730.
- Cao X, Dong A, Kang G, Wang X, Duan L, Hou H, Zhao T, Wu S, Liu X, Huang H. et al. Modeling spatial interaction networks of the gut microbiota. Gut Microbes. 2022;14(1):2106103. doi:10.1080/19490976.2022.2106103.
- Wang L, Cheng X, Bai L, Gao M, Kang G, Cao X, Huang H. Positive interventional effect of engineered butyrate-producing bacteria on metabolic disorders and intestinal flora disruption in obese mice. Microbiol Spectr. 2022;10(2):e01147–21. doi:10.1128/spectrum.01147-21.
- Yin J, Chen X, Li X, Kang G, Wang P, Song Y, Ijaz UZ, Yin H, Huang H. A droplet-based microfluidic approach to isolating functional bacteria from gut microbiota. Front Cell Infect Microbiol. 2022;12:920986. doi:10.3389/fcimb.2022.920986.
- Dai D, Zhu J, Sun C, Li M, Liu J, Wu S, Ning K, He L-J, Zhao X-M, Chen W-H. et al. Gmrepo v2: a curated human gut microbiome database with special focus on disease markers and cross-dataset comparison. Nucleic Acids Res. 2022;50(D1):D777–D84. doi:10.1093/nar/gkab1019.
- Wree A, Broderick L, Canbay A, Hoffman HM, Feldstein AE. From NAFLD to NASH to cirrhosis—new insights into disease mechanisms. Nat Rev Gastroenterol Hepatol. 2013;10(11):627–636. doi:10.1038/nrgastro.2013.149.
- Sorbara MT, Pamer EG. Microbiome-based therapeutics. Nat Rev Microbiol. 2022;20(6):365–80. doi:10.1038/s41579-021-00667-9.
- Zhu J, Chen C, Lu L, Shikany JM, D’Alton ME, Kahe K. Folate, vitamin B6, and vitamin B12 status in association with metabolic syndrome incidence. JAMA Netw Open. 2023;6(1):e2250621–e. doi:10.1001/jamanetworkopen.2022.50621.
- Rodríguez-Rodríguez E, López-Sobaler AM, Navarro AR, Bermejo LM, Ortega RM, Andrés P. Vitamin B6 status improves in overweight/obese women following a hypocaloric diet rich in breakfast cereals, and may help in maintaining fat-free mass. Int J Obes. 2008;32(10):1552–8. doi:10.1038/ijo.2008.131.
- Li Z, Zhao Y, Zhou H, Luo H-B, Zhan C-G. Catalytic roles of coenzyme pyridoxal-5′-phosphate (PLP) in PLP-dependent enzymes: reaction pathway for methionine-γ-lyase-catalyzed l-methionine depletion. ACS Catal. 2020;10(3):2198–2210. doi:10.1021/acscatal.9b03907.
- Yao Z, Yan Y, Zheng X, Wang M, Zhang H, Li H, Chen W. Dietary lactate supplementation protects against obesity by promoting adipose browning in mice. J Agric Food Chem. 2020;68(50):14841–14849. doi:10.1021/acs.jafc.0c05899.
- Araújo JR, Tazi A, Burlen-Defranoux O, Vichier-Guerre S, Nigro G, Licandro H, Demignot S, Sansonetti PJ. Fermentation products of commensal bacteria alter enterocyte lipid metabolism. Cell Host & Microbe. 2020;27(3):358–75.e7. doi:10.1016/j.chom.2020.01.028.
- Lin Y, Bai M, Wang S, Chen L, Li Z, Li C, Cao P, Chen Y. Lactate is a key mediator that links obesity to insulin resistance via modulating cytokine production from adipose tissue. Diabetes. 2022;71(4):637–652. doi:10.2337/db21-0535.
- Turroni F, Milani C, Duranti S, Mancabelli L, Mangifesta M, Viappiani A, Lugli GA, Ferrario C, Gioiosa L, Ferrarini A. et al. Deciphering bifidobacterial-mediated metabolic interactions and their impact on gut microbiota by a multi-omics approach. ISME J. 2016;10(7):1656–68. doi:10.1038/ismej.2015.236.
- De Vuyst L, Leroy F. Cross-feeding between bifidobacteria and butyrate-producing colon bacteria explains bifdobacterial competitiveness, butyrate production, and gas production. Int J Food Microbiol. 2011;149(1):73–80. doi:10.1016/j.ijfoodmicro.2011.03.003.
- Chen J, Vitetta L. Intestinal dysbiosis in celiac disease: decreased butyrate production may facilitate the onset of the disease. Proc Natl Acad Sci. 2021;118(41):e2113655118. doi:10.1073/pnas.2113655118.
- Deleu S, Machiels K, Raes J, Verbeke K, Vermeire S. Short chain fatty acids and its producing organisms: an overlooked therapy for IBD? EBioMedicine. 2021;66:103293. doi:10.1016/j.ebiom.2021.103293.
- Percudani R, Peracchi A. The B6 database: a tool for the description and classification of vitamin B6-dependent enzymatic activities and of the corresponding protein families. BMC Bioinform. 2009;10(1):273. doi:10.1186/1471-2105-10-273.
- Rosenberg J, Ischebeck T, Commichau FM. Vitamin B6 metabolism in microbes and approaches for fermentative production. Biotechnol Adv. 2017;35(1):31–40. doi:10.1016/j.biotechadv.2016.11.004.
- Fields AM, Welle K, Ho ES, Mesaros C, Susiarjo M. Vitamin B6 deficiency disrupts serotonin signaling in pancreatic islets and induces gestational diabetes in mice. Commun Biol. 2021;4(1):421. doi:10.1038/s42003-021-01900-0.
- Mascolo E, Liguori F, Merigliano C, Schiano L, Gnocchini E, Pilesi E, Volonté C, Di Salvo ML, Contestabile R, Tramonti A. et al. Vitamin B6 rescues insulin resistance and glucose-induced DNA damage caused by reduced activity of drosophila PI3K. J Cell Physiol. 2022;237(9):3578–3586. doi:10.1002/jcp.30812.
- Zhang X-Z, Zhang YHP. Simple, fast and high-efficiency transformation system for directed evolution of cellulase in Bacillus subtilis. Microb Biotechnol. 2011;4(1):98–105. doi:10.1111/j.1751-7915.2010.00230.x.
- Smith CA, Want EJ, O’Maille G, Abagyan R, Siuzdak G. XCMS: processing mass spectrometry data for metabolite profiling using nonlinear peak alignment, matching, and identification. Anal Chem. 2006;78(3):779–787. doi:10.1021/ac051437y.
- Haas BJ, Gevers D, Earl AM, Feldgarden M, Ward DV, Giannoukos G, Ciulla D, Tabbaa D, Highlander SK, Sodergren E. et al. Chimeric 16S rRNA sequence formation and detection in Sanger and 454-pyrosequenced PCR amplicons. Genome Res. 2011;21(3):494–504. doi:10.1101/gr.112730.110.