
ABSTRACT
The gut microbiota and Short-chain fatty acids (SCFAs) can influence the progression of diseases, yet the role of these factors on gastric cancer (GC) remains uncertain. In this work, the analysis of the gut microbiota composition and SCFA content in the blood and feces of both healthy individuals and GC patients indicated that significant reductions in the abundance of intestinal bacteria involved in SCFA production were observed in GC patients compared with the controls. ABX mice transplanted with fecal microbiota from GC patients developed more tumors during the induction of GC and had lower levels of butyric acid. Supplementation of butyrate during the induction of gastric cancer along with H. pylori and N-methyl-N-nitrosourea (MNU) in WT in GPR109A−/−mice resulted in fewer tumors and more IFN-γ+ CD8+ T cells, but this effect was significantly weakened after knockout of GPR109A. Furthermore, In vitro GC cells and co-cultured CD8+ T cells or CAR-Claudin 18.2+ CD8+ T cells, as well as in vivo tumor-bearing studies, have indicated that butyrate enhanced the killing function of CD8+ T cells or CAR-Claudin 18.2+ CD8+ T cells against GC cells through G protein-coupled receptor 109A (GPR109A) and homologous domain protein homologous box (HOPX). Together, these data highlighted that the restoration of gut microbial butyrate enhanced CD8+ T cell cytotoxicity via GPR109A/HOPX, thus inhibiting GC carcinogenesis, which suggests a novel theoretical foundation for GC management against GC.
Introduction
The gut microbiota consists of approximately 3×10^13 bacteria, the vast majority of which exist in a symbiotic relationship with the host.Citation1 Imbalances caused by reductions in the abundance of beneficial bacteria or shifts from symbiotic to pathogenic bacteria in the gut can disrupt both the mucosal barrier and the immune microenvironment. Changes in metabolite concentrations resulting from this imbalance also influence metabolic functions, both systemic and local, as well as the inflammatory response and adaptive immunity, potentially leading to the development of disease.Citation2,Citation3 The influence of the gut microbiota on human health is attracting much attention in recent years and the microbiota has been found to affect various diseases, including ulcerative colitis, rheumatoid arthritis, and Alzheimer’s diseaseCitation4–6 as well as various forms of cancer.Citation7–9 Bacteroides fragilis and Fusobacterium nucleatum have been identified as potential diagnostic bacterial markers for colorectal cancer by analyzing the metagenomes of fecal samples from colorectal cancer patients.Citation10–13 However, it is not known whether changes in the gut microbiota composition can delay or accelerate the development of gastric cancer (GC), or whether the transplantation of intestinal microbiota from healthy individuals can inhibit the occurrence and progression of GC.
Short-chain fatty acids (SCFAs) are metabolic byproducts generated by anaerobic bacteria such as Firmicutes and Bacteroidetes through the fermentation of dietary fiber.Citation14,Citation15 They consist mainly of acetate, propionate, and butyrate, and have attracted attention for their ability to promote the differentiation of regulatory T (Treg) cells and maintain gut homeostasis.Citation14,Citation16 Studies have shown that acetate produced by intestinal microorganisms has beneficial effects on both the immune response and health of the hostCitation17 while propionate and butyrate influence Treg cells to reduce inflammation in the intestine.Citation14,Citation18 Apart from its intestinal effects, butyrate has also been found to have antitumor actions through properties by inhibiting inflammation and carcinogenesis through influencing immune, epigenetic, and metabolic functions.Citation16 Although the functions of SCFAs are partially understood in colon cancer, there is little information on their actions in GC. SCFAs act by binding to the G protein-coupled receptors 109A, 43, and 41.Citation19 While GPR41 and GPR43 can be activated by all three SCFAs, GPR109A (also known as hydroxycarboxylic acid receptor 2 or HCA2) binds only butyrate.Citation20,Citation21 GPR109A is found in the intestinal epithelium, immune cells, and adipose tissueCitation22 and its knockout is associated with the development of colon cancer and the inhibition of graft-versus-host reactions.Citation20,Citation23 Despite the identification of these functions in the suppression of colon cancer progression, little is known of its function in GC and associated immune modulation.
Here, it was observed that the transplantation of fecal microbiota from patients with GC markedly enhanced GC development. Studies using metabolomics and genomics have shown significant reductions in the bacterial genera responsible for SCFA production in the microbiota of both GC patients and mice, together with reduced butyrate levels. By supplementing with butyrate and using GPR109A−/− mice, we have found that butyrate can significantly inhibit the progression of GC. However, the inhibitory effect was significantly weakened when GPR109A was knocked out. Furthermore, investigation of tumor tissues and CD8+ T cells, it was observed that butyrate promoted the killing of GC cells by CD8+ T cells or CAR-Claudin 18.2+ CD8+ T cells through GPR109A, thereby inhibiting the progression of GC.
Materials and methods
Human specimens
The paraffin-embedded tumor sections used in this study were obtained from the Nanfang Hospital of Southern Medical University. The fecal and blood samples of gastric cancer patients and normal individuals were collected from the Zhujiang Hospital and Nanfang Hospital of Southern Medical University. All relevant samples used in this study were collected from January 2020 to August 2021 and ethically approved by the two hospitals, and informed consent was obtained from all participants prior to sample collection (Nos.2022-KY-115, NFEC-202304-K26-01).
The characteristics of the participants for serum and fecal samples collecting were as follows: (1) GC patients or healthy volunteers (man or women) aged 30–75 years; (2) GC patients admitted to the hospital with gastric cancer, and healthy volunteers free of gastrointestinal cancer (detected by gastrointestinal endoscopy). Exclusion criteria for the study included (1) a history of gastrointestinal surgery; (2) undergoing neoadjuvant chemotherapy following the diagnosis of GC; (3) a history of Intake of antibiotics, probiotics, PPIs, and hormonal drugs (past three months); and (4) individuals with chronic constipation, comorbidities (diabetes and depression), pregnant or lactating ().
Table 1. Characteristics of the participants for serum and fecal samples collecting.
Blood and fecal samples from both the gastric cancer patients (n = 20) and the healthy individuals (n = 20) were collected within 48 hours of hospitalization. Fecal samples were transported under anaerobic conditions while being frozen. All fecal samples and serum were stored long-term at a temperature of − 80°C.
Primary cell cultures
The human gastric cancer (GC) cell lines MGC-803, HGC-27, SNU-216 and the human gastric epithelial cell line GES-1 used in this study were purchased from the American Type Culture Collection (ATCC, USA). All human gastric cell lines were cultured in DMEM medium (Gibco, USA) supplemented with 10% fetal bovine serum (FBS; Yeasen, China), 100 U/ml penicillin, and 100 U/ml streptomycin, under conditions of 37°C and 5% CO2. The cell lines used in this study were not contaminated with mycoplasma. In this study, the methods employed for cell manipulation include transient transfection, viral infection, treatment with acetate (Ac) or butyrate (Bu) (Macklin, China), and administration of the GPR109A inhibitor, Mepenzolate bromide (MCE, USA).
Mouse models and treatments
All groups had a sample size of n = 10 to 12 per group. Within each group, a subset of n = 5 to 6 samples was used for gross tumor and pathological analysis. Another subset of n = 5 to 6 samples was used specifically for tumor tissue flow cytometry analysis. In the realm of microbiota analysis, the number of fecal samples collected was n = 10 per group. It is noteworthy, however, that an attempt to transplant fecal microbiota from healthy individuals into a cage containing four mice yielded the unfortunate occurrence of diarrhea, thereby necessitating the exclusion of those specific mice from the study. Additionally, for SCFA analysis, both fecal samples and serum samples were collected, with a sample size of n = 5 to 6 for each group. Cages: n = 2 to 3 per group.
All mice were reared under specific pathogen-free conditions (SPF), with room temperature controlled between 22–24°C, a natural light-dark cycle, and free access to food and water. The animal study has received approval from both Zhujiang Hospital and Nanfang Hospital affiliated with Southern Medical University (No.LAEC-2022-035).
GC mouse models
20 g C57BL/6J mice at 6 weeks of age were infected with H. pylori by resuspended it in physiological saline at a dose of 0.2 ml (10^9/ml) three times a week for a total of two weeks (−2 w), with each mouse receiving approximately 1 billion units of H. pylori SS1 (BioSci, China) via gavage (Figure S1a, b). Afterwards, N-methyl-N-nitrosourea (MNU) (Meryer, China) was dissolved in distilled water at a concentration of 300 ppm, freshly prepared three times a week, and stored in light-resistant bottles. The MNU was consumed for 6 weeks in a 12-week cycle.Citation24–26 Upon the existing gastric cancer induction model, we introduced minor modifications. During the free access to MNU, we administered a gastric gavage of 0.5 ml, containing 300 ppm MNU, in a 5% hypertonic saline solution to fasted mice thrice weekly. Additionally, the mice were subjected to abnormal feeding conditions (2 days of overfeeding followed by 1 day of fasting) to comprehensively model the disease (Figure S1d-f).
ABX mouse models
For the ABX experiment, 6-week-old mice were administered antibiotics via oral gavage and drinking water. The administration of 1.86 mg ampicillin (Macklin, China), 0.96 mg vancomycin (Macklin, China), 1.86 mg neomycin sulfate (Macklin, China), and 1.86 mg metronidazole (Macklin, China) was carried out by dissolving them in sterile 300 µl drinking water, three times a week for two weeks (−6 to − 4 w). Additionally, the mice were given ad libitum access to drinking water containing 1 g/L ampicillin penicillin, 1 g/L vancomycin, 1 g/L neomycin sulfate, and 1 g/L metronidazole for two weeks.
FMT mouse models
After the successful establishment of the ABX model, fecal microbiota from GC patients or healthy volunteers was transplanted into ABX mice via gastric infusion (Figure S7). 300 mg of feces from either GC patients or healthy individuals were suspended in 1 mL of PBS, homogenized, and centrifuged at 500 g for 3 minutes to collect bacterial supernatant. Select six donors from the donor pool for each group, serving as providers of fecal microbiota for 10 to 12 recipient mice in each group. Then, 200 ul of the supernatant was administered orally to ABX mice three times a week for a total of two weeks (−4 to − 2 w). In both the ABX and FMT experiments, feces were collected from FMT mice for 16S rRNA sequencing and detection of fecal metabolites. For FMT mice, the aforementioned GC induction was initiated after successful transplantation, and sample collection was conducted at − 6 + 36 weeks thereafter ().
Bu treatment in GC mouse models
In the case of the Bu inhibition model of GC progression in mice, 100 mM of Bu was supplemented in the drinking water 30 weeks after modeling, and GC progression was observed by sampling at 52 weeks ().
To investigate whether Bu prevents GC by regulating the GPR109A receptor, GPR109A−/− and WT mice were used for GC modeling. Bu was supplemented in the drinking water or high-fiber diet was given 12 weeks after modeling, and GC occurrence and development were observed by sampling at 38 weeks. The GPR109A−/− mice was generously provided by Professor Guoqiang Chen of Tsinghua University ((; Figure S1c).
16S rRNA microbiome analysis
The fecal microbiota profile was obtained through 16S rRNA sequencing analysis by Lianchuan Biotechnology Company. In simple terms, this study used the cetyltrimethylammonium bromide (CTAB) method to extract microbial samples from fecal microbiome and detect the quality of DNA extraction through agarose gel electrophoresis. The PCR products were purified using AMPure XT beads (Beckman Coulter Genomics, Danvers, MA, USA) and quantified using Qubit (Invitrogen, USA). The purified PCR products were evaluated using the Agilent 2100 bioanalyzer (Agilent, USA) and Illumina (Kapa Biosciences, Woburn, MA, USA) library quantification kit, and qualified library concentration should be above 2 nM. The qualified libraries with different indexes were gradient diluted, mixed according to the required sequencing amount, and denatured with NaOH to form single strands for sequencing. The NovaSeq 6000 sequencer was used for 2 × 250bp paired-end sequencing, and the corresponding reagent was NovaSeq 6000 SP Reagent Kit (500 cycles). For the paired-end data obtained by sequencing, it is necessary to split the data according to the barcode information of the samples and remove the adapter and barcode sequences. The specific steps for data merging and filtering are as follows: remove the primer sequence and balanced base sequence of RawData (software: cutadapt (v1.9)). Merge each paired-end read into a longer tag based on the overlap region (software: FLASH (v1.2.8)). Perform window quality scanning on the sequencing reads, with a default scanning window of 100bp. If the average quality value within the window is less than 20, the part of the read from the window start to the 3’ end is cut off (software: fqtrim). Remove sequences with a length shorter than 100bp after truncation. Remove sequences with N (uncertain fuzzy base) content of more than 5% after truncation. Remove chimeric sequences (software: Vsearch (v2.3.4)). Perform length filtering and denoising using DADA2 through qiime dada2 denoise-paired to obtain ASV (feature) sequence and ASV (feature) abundance table, and remove singleton ASVs. Based on the obtained ASV (feature) sequence and ASV (feature) abundance table, alpha diversity analysis and beta diversity analysis were performed. Alpha diversity analysis mainly evaluated the diversity of the habitat through the seven indices of observed_species, shannon, simpson, chao1, goods_coverage, pielou_e. Beta diversity analysis mainly evaluated the diversity between habitats (samples/groups) by calculating four distances (weighted_unifrac, unweighted_unifrac, Jaccard, bray_curtis) and using six analysis methods. Based on the ASV (feature) sequence file, the species were annotated using the SILVA (Release 138, https://www.arb-silva.de/documentation/release138/) database and the NT-16S database, and the abundance of each species in each sample was statistically analyzed based on the ASV (feature) abundance table. Based on the statistical information of species abundance, differential analysis was performed between various comparison groups.
Sample preparation and analysis of SCFAs
After thawing at room temperature, 800 mg of human feces or 300 mg of mouse feces were transferred to a sterile 2 mL EP tube. 1 mL of water was added, and the mixture was shaken for 5 minutes, followed by 15 minutes of sonication. The mixture was then centrifuged at 15,000 rpm for 10 minutes in a refrigerated high-speed centrifuge. The supernatant was transferred to a new EP tube and mixed with anhydrous sodium sulfate (0.5 g) (Macklin, China), 50% sulfuric acid (10 μL) (Macklin, China), and 2 mL of ether or 1 mL of ethyl acetate (Macklin, China). The mixture was vortexed for 2 minutes and then centrifuged at 5000 rpm for 15 minutes. Finally, 500 μL of the supernatant was taken and placed in a glass auto-sampler vial. For the blood samples, 100 μL of human or mouse blood was transferred to a new 2 ml EP tube. To this, 300 μL of methanol for chromatography, anhydrous sodium sulfate (0.2 g), and 50% sulfuric acid (2.5 μL) were added. After shaking and centrifugation, the supernatant was collected. The present study analyzed and determined the levels of SCFAs in feces using a gas chromatography-mass spectrometry (GC-MS) system. The GC-MS analysis was performed using a TRACE 1300 gas chromatograph equipped with a Thermo Scientific ISQ single quadrupole mass spectrometer, a DB-FFAP capillary column (30 m × 0.25 mm × 0.25 μm film thickness) (Agilent Technologies, USA), and an AI1300 auto-sampler (Thermo Scientific, USA). 1 μL of the supernatant sample was injected into the inlet, with a delay time of 3 minutes and a split ratio of 1:5. The nitrogen carrier gas (99.999% purity) flow rate was maintained at 1 mL/min. The inlet, ion source, and quadrupole temperatures were 250°C, 280°C, and 230°C, respectively. The initial oven temperature was set to 60°C for 1 minute, followed by an increase at a rate of 10°C/min to 160°C, then an increase at a rate of 25°C/min to 240°C, and finally held at that temperature for 5.8 minutes. The selected ion (m/z) values for each SCFA, including acetic acid, propionic acid, isobutyric acid, butyric acid, isovaleric acid, and valeric acid, were 43, 45, 57, 60, 73, 74, and 87, respectively. Hydrogen, air, and nitrogen were used as the gas components with flow rates of 30, 300, and 30 mL/min, respectively. Each analysis had a total run time of 15 minutes. The data were analyzed using Xcalibur Qual Browser (Thermo Scientific, USA), and the content of each SCFA was calculated using external standard methods.
Bacterial agar plate experiment
In the bacterial agar experiment, aseptically weighed 0.1 g of murine feces within a biosafety cabinet. Dissolved it in a 1.5 mL centrifuge tube containing 1 mL of PBS. Centrifuged at 1000 rpm for 3 minutes, and then slowly pipetted 100 μL of the supernatant onto solid agar medium, evenly spreading it with a sterile spreader. Subsequently, incubated at 37°C within a controlled cultivation environment for a duration of 16 hours while vigilantly observing any discernible shifts in bacterial colonies.
RNA extraction and real-time PCR
According to the manufacturer’s instructions, total RNA was extracted from GC cells or mouse stomach tissue using RNAiso Plus* (Takara, Japan). cDNA synthesis was performed using the Fast Quant RT Kit reagent (Qiagen, China). Subsequently, The real-time quantitative PCR (qRT-PCR) (Bio-Rad, USA) was conducted using the 2 × Talent qPCR PreMix (Qiagen, China). Relative RNA expression levels was analyzed using the 2−ΔΔCt method with β-actin as the internal control ().
Table 2. Primer Sequences for Relative Quantitative RT-PCR.
Transient transfection, viral packaging and infection
The siRNAs for GPR109A and HOPX were purchased from GenePharma and were transfected into GC cells using PepMuteTM siRNA transfection reagent (SignaGen, USA) (; ). The plasmid used for HOPX knockdown and overexpression was purchased from IGE, while the plasmid for CAR-Claudin18.2 was obtained from iCarTab. Transient transfection was performed using LipofectamineTM 3000 transfection reagent (Thermo Fisher, USA). Prior to all transient transfections, cells were starved for 24 hours. To package HOPX knockdown and overexpression viruses, we used virus packaging plasmids PMD2G and PSPAX2, along with the target gene plasmids, and transfected them into HEK 293T cells using Lipo2000 transfection reagent (Biosharp, China) (). After 48 hours of cultivation, the supernatant from the cell culture dish was collected and the packaged virus was obtained by centrifugation and filtration. Activate CD8+ T cells and seed them in a 24-well plate. Centrifuge using a gradient centrifuge for 30 minutes and discard the supernatant. Add 500 µL of successfully packaged lentivirus-containing complete medium with 10 µg/mL polybrene (Solarbio, China) to the well plate and continue culturing for 12 hours. Repeat infection three times. Finally, to verify knockdown or overexpression efficiency, cell collection was performed 48 hours after transient transfection or infection, and the efficiency was verified by real-time fluorescent quantitative PCR, flow cytometry and immunoblotting.
Table 3. siRNA-GPR109A Sequences.
Table 4. siRNA-HOPX Sequences.
Table 5. Sh-RNA-HOPX Sequences.
Western blotting (WB) and Co-immunoprecipitation assay
The cells and mouse tissues were subjected to protein preparation using RIPA lysis buffer (Beyotime, China) supplemented with phosphatase inhibitors, protease inhibitors, and PMSF (CWBIO, China). The protein concentration of the lysate was determined using the BCA protein quantification kit (CWBIO, China). A certain amount of protein lysate was mixed with four times the volume of protein loading buffer, followed by boiling at 100°C for 8 minutes. All protein samples were separated by SDS-PAGE gel (Beyotime, China) and transferred onto a PVDF membrane (Millipore, USA) using electrophoresis (Bio-Rad, USA). The PVDF membrane containing separated proteins was blocked with 5% skim milk powder for 2 hours, and then incubated with primary antibodies against GPR109a (Abmart, China, 1:1000), GPR43 (Abmart, China, 1:1000), GPR41 (Immunoway, USA, 1:1000), HOPX (Proteintech Group, China, 1:500), CD8 (Abcam, USA, 1:3000), IFN-γ (Bioss, China, 1:1500), Bcl-2 (Abcam, USA, 1:2000), Bax (Immunoway, USA, 1:1000), Cleaved-caspase 3 (Cohesion, UK, 1:1000 or Abcam, USA, 1:1000), Cyclin D1 (Wanleibio, China, 1:1000), Claudin 18.2 (Affinity, China, 1:1000) and Tubulin (Proteintech Group, China, 1:10000) at 4°C overnight. After washing, the blots were incubated with the corresponding HRP-conjugated secondary antibodies (Fudebio-tech, China, 1:10000) at room temperature for 1 h. After washing, the immunocomplex was detected using the ECL chemiluminescence kit (Millipore, USA) in Alliance Q9 Gel Imaging System (UVI tec, UK). For the analysis of co-immunoprecipitation (Proteintech Group, China), 800 µL of pre-cooled IP lysate buffer containing proteinase inhibitors and phosphatase inhibitors was added to cells in 10 cm dishes. 400 µL of lysed protein was taken and incubated with rProtein A/G beads and HOPX primary antibody (Santa Cruz, USA) for precipitation, while an equal amount of control IgG antibody (Millipore, USA) was added to the same amount of lysate, followed by washing three times with lysis buffer and analysis using immunoblotting.
Histological evaluation and immunohistochemical staining
The paraffin-embedded tissue samples were sliced into 4-µm-thick sections and baked at 68°C for 90 minutes. The sections were then dewaxed in three changes of xylene and rehydrated in a gradient of alcohol. After three washes in PBS, the sections were stained with hematoxylin and eosin for 6 minutes each. Immunohistochemical staining was performed using a DAKO kit (DAKO, Denmark) following the manufacturer’s instructions. In brief, the rehydrated sections were subjected to antigen retrieval using a sodium citrate/EDTA buffer (Beyotime, China) at 95–100°C for 8 minutes, followed by cooling to room temperature. After washing in PBS three times, the sections were incubated in blocking solution containing an endogenous peroxidase inhibitor (Beyotime, China) at room temperature in the dark for 15 minutes, followed by nonspecific binding site blocking using goat serum (Boster, China) for 30 minutes at room temperature. The respective primary antibodies (1:200) against Ki-67 (Thermo Scientific, USA), CK-7 (Bimake,USA,Elabscience,China), GPR109a, GPR43, HOPX, CD8, IFN-γ were added to each tissue section and incubated overnight at 4°C. The following day, the sections were brought to room temperature for 15 minutes, washed three times with PBS, and incubated with a secondary enzyme-linked goat anti-mouse/rabbit IgG polymer (DAKO, Denmark) for 30 minutes at room temperature. After washing in PBS three times, the sections were visualized using DAB under a microscope (Leica, Germany), counterstained with hematoxylin, and dehydrated and cleared with xylene. The tissue sections were then mounted with neutral resin and subjected to image acquisition using a 3D HISTECH bright field slide scanner (3DHISTECH, Hungary). Each image is randomly selected with 4–6 fields of view at 20× magnification, followed by analysis using Image Pro Plus 6.0 software.
Immunofluorescence assays
The GC cells and CD8+ T cells were fixed for 30 minutes using 4% paraformaldehyde. Antigen retrieval of mouse stomach tissue paraffin sections was performed using sodium citrate/EDTA repair fluid (Beyotime, China). The slides were washed three times in PBST and then incubated for 15 minutes at room temperature with 0.5% Triton X-100 (Solarbio, China). Non-specific protein binding sites were blocked using goat serum at room temperature. The corresponding primary antibodies (1:200) CD11c (SAB, USA), CD86 (Bioss, China), GPR109a, GPR41, HOPX (Santa Cruz, USA), CD8 (Proteintech Group, China), IFN-γ and Claudin 18.2 were added and incubated overnight at 4°C. The slides were then washed three times with PBST for 5 minutes each time. Subsequently, the appropriate dye-conjugated secondary antibodies (Cell Signaling Technology, USA, 1:400) were added and incubated for 1 h at room temperature. After washing with PBST, the slides were sealed with DAPI anti-fluorescence quenching agent (Solarbio, China) and fluorescence images were collected using a Nikon confocal microscope (Nikon, Japan). Each fluorescent tissue slide randomly selects 3–4 fields of view under a 20-fold magnification and subsequently analyzes them using Image Pro Plus 6.0 software.
CD8+ T cell isolation and activation
Using Ficoll-Paque Plus (Solarbio, China) to isolate peripheral blood mononuclear cells (PBMCs) from peripheral blood by gradient separation. After washing the separated PBMCs three times with physiological saline, they were resuspended to form a single cell suspension and cell counting was performed. According to the instructions of the EasySep™ Human CD8 Positive Selection Kit II (StemCell, Canada), a certain amount of PBMCs was taken and added to a sterile flow tube, followed by the addition of the corresponding Selection Cocktail and incubation at room temperature for three minutes. Then, RapidSpheres™ (StemCell, Canada) were added and placed in the matching magnetic pole for 3 minutes. Afterwards, wash buffer was added and washed three times. The cells were resuspended in Lonza serum-free medium (Lonza, USA) and seeded into a 24-well plate, and CD3/CD28 antibodies (StemCell, Canada) were added to the wells for 72 hours to amplify and activate CD8+ T cells.
CAR-Claudin 18.2+ CD8+ T cell generation
The experiments described above resulted in the generation of CD8+ T cells and lentiviral vectors containing CAR-Claudin 18.2. Isolated CD8+ T cells were activated with CD3/CD28 antibodies for 48 hours and seeded at a density of 200,000 to 400,000 cells per well in a 24-well plate. The lentiviral vectors with an MOI of 50, mixed with polybrene at a concentration of 10 μg/mL, were added to a 1 mL cell suspension. The plate was centrifuged at 250 g for 50 minutes, followed by a medium change after 16 hours of infection, and further incubated for 72 hours before conducting the experiments.
Cell proliferation assay and cytotoxicity test
The MGC-803, HGC-28, SNU-216, and GES-1 cell lines were inoculated into 96-well cell culture plates at a density of 3000–10000 cells per well. After 24 hours of cultivation, the culture medium was discarded and replaced with complete growth medium containing Ac or Bu of different gradient concentrations, with drug-free growth medium used as a control. The cell culture plates were then incubated at 37°C and 5% carbon dioxide. Cell viability was evaluated at 0, 12 h, 24 h, and 48 h, and their absorbance values were measured at a wavelength of 450 nm using an BioTek Synergy H1 Multi-Mode Microplate Reader (Biotek, USA) according to the manufacturer’s instructions for CCK8 (Dojindo, Japan). MGC-803 and HGC-27 gastric cancer cells were seeded in a 96-well cell culture plate at a density of 10,000–20,000 cells per well and incubated for 8 hours. After that, 10-fold CD8+ T cells, which were either stimulated by successful infection or treated with GPR109A inhibitor (MCE, USA), were added to the wells, and the plate was incubated for an additional 36 hours. Similarly, experiments were conducted on CAR-Claudin 18.2+ CD8+ T cells and GC cells, employing a comparable approach. However, the ratio of effector cells to target cells was maintained at 1:1, and the incubation period lasted between 12 to 16 hours. The cell cytotoxicity was detected according to the instructions of the CytoTox 96Ⓡ non-radioactive cytotoxicity assay kit (Promega, USA).
Tumor implantation and CAR T-cell activity in vivo
6–8 week-old B-NDG mice were obtained from Bai Shi Tong Experimental Animal Company (Dongguan, China). On day 0, they were subcutaneously injected in the upper left limb with MGC-803-Luc tumor cells (5 × 10Citation6 cells/mouse) to establish a xenograft model. The mice were divided into three groups: the CD8+ T cell injection group (Mock-T), the CAR-CD8+ T cell injection group (CAR-T), and the CAR-CD8+ T cell injection group treated with 0.5 mM sodium butyrate for 24 hours (CAR-T+Bu). On days 10 (0) and 15 (5), 5 × 10Citation6 transduced CAR-Claudin 18.2+ CD8+ T cells were intravenously injected into the mice. Subsequently, tumor burden was imaged and assessed at specified time points. Additionally, peripheral blood samples were collected for analysis of complete blood count and blood biochemistry by Guangzhou Donglin Biological Technology Co.,Ltd., while tissue samples were obtained for pathological analysis.
Living image analysis
The tumor burden analysis was performed using imaging in small animals in vivo. According to the manufacturer’s instructions, each mouse is administered 1.5 mg of luciferin potassium salt (GlpBio, USA) for imaging purposes. The luminescent images are analyzed using the in vivo imaging software (Caliper Life Sciences). The region of interest (total flux, p/s) is quantified for the signal intensity of luciferase using the Living Image V.2.50.1 software.
Flow cytometry analysis
To analyze cell apoptosis, cells were collected after drug treatment or transfection and digested with trypsin. The cells were washed three times with physiological saline and then incubated with Annexin-V-FITC (Dojindo, Japan) or Annexin-V-eV450 (ELabscience, China) and propidium iodide (PI) (Dojindo, Japan) at 4°C for 30 minutes. To analyze the cell cycle, collected cells were fixed in 70% ice-cold ethanol overnight, and stained with RNase A and PI (Beyotime, China) in staining buffer at room temperature for 15 minutes. Annexin-V-positive cells were defined as apoptotic cells. The cell proportions of G0/G1, S, and G2/M phases were analyzed and counted. To detect immune cells in mouse peripheral blood and gastric tumors, red blood cell lysis buffer was used to remove red blood cells in tissues and whole blood, and single-cell suspensions were prepared using type IV collagenase (Yeasen, China) and a cryo grinder (Luka, China). To analyze surface and intracellular functional markers of human CD8+ T cells, CytoFast Fix/Perm (BD Biosciences, USA) and Foxp3/transcription factor staining buffers (Thermo Scientific, USA) were used for intracellular cytokine staining. Additionally, to analyze tumor cell apoptosis after co-culture with CD8+ T cells and GC cells, DIR staining (Beyotime, China) was used to distinguish tumor cells. Fluorescence data was collected using a CytoFlex flow cytometer (Beckman, USA) and analyzed using FlowJo software. The following anti-mouse antibodies were used for FACS analysis: CD16/32 (93, Biolegend, USA), CD45 (30-F11, Biolegend or BD Biosciences, USA), CD3e (17A2, Biolegend, USA), CD3e (145-2C11, BD Biosciences, USA), CD4 (GK1.5, Biolegend or BD Biosciences, USA), CD8a (53–6.7, Biolegend or BD Biosciences, USA), CD25 (PC61, Biolegend, USA), Foxp3 (R16–715, BD Biosciences, USA), CD11c (N418, Biolegend, USA), CD11c (HL3, BD Biosciences, USA), CD80 (16-10A1, Biolegend or BD Biosciences, USA), CD86 (GL-1, Cell Signaling Technology, USA), and IFN-γ (XMG1.2, Biolegend, USA). The following anti-human antibodies were used: CD8a (RPA-T8, Biolegend, USA), IFN-γ (B27, Biolegend, USA), and Granzyme B (GB11, Biolegend, USA).
Statistical analysis
Data were expressed as mean±SD. Statistical significance between groups was calculated by two-tailed, unpaired Student’s’ t test (GraphPad Prism 9.0). One-way ANOVA was used to compare the means of three or more groups to determine the statistical significance (GraphPad Prism 9.0). Mann-Whitney U test was used for differential comparison of two groups of samples with biological replicates; Kruskal-Wallis test was used for comparison of multiple groups of samples with biological replicates. p < 0.05 was considered statistically significant.
Results
GC patients show gut microbiota dysbiosis and reduced levels of SCFAs and SCFA receptors
To investigate the gut microbiota in GC patients, fecal samples were collected from 20 pairs of healthy individuals and GC patients. The community structures and abundances of the bacteria were analyzed by 16S rRNA sequencing. The taxonomy of the intestinal bacteria, from phylum to species, was analyzed using the LEfSe method. Evolutionary branching diagrams and distribution bar charts were used to demonstrate the differences between the two groups at each taxonomic level. This showed that patients with GC had significantly increased levels of the Streptococcus, Limosilactobacillus, Tannerellaceae, Clostridium, and Akkermansia bacterial genera. However, the proportions of Faecalibacterium, Ruminococcus, Subdoligranulum, Dorea, Roseburia, Phascolarctobacterium, Catenibacterium, Fusicatenibacter, Fusobacterium, and Butyricicoccus were markedly reduced (, Figure S2a, S3a). Clustering of the top 30 taxa based on their relative abundance at the genus level and using either the distribution of taxonomic unit abundance or the similarity between samples, showed similar tendencies in the abundance of Phascolarctobacterium, Lachnoclostridium, Dorea, Roseburia, Ruminococcus, Faecalibacterium, Firmicutes_unclassified, and Streptococcus in the samples from both groups (Figure S2b). Principal Coordinate Analysis (PCoA) and Alpha Diversity Analysis were then used for visual two-dimensional comparison of the compositional structures, species richness, and evenness between the two sets of samples (; Figure S3b, c). The 16S rRNA sequencing analysis indicated significant reductions in the bacterial genera associated with SCFA production in the microbiota from GC patients. To further elucidate the relationship, GC-MS was used to analyze differences in the contents of the various SCFAs in both fecal samples and peripheral blood sera from the two groups. This showed markedly decreased levels of acetic acid, butyric acid, and total SCFA content in the fecal samples of GC patients, with corresponding results in the serum samples (). In order to investigate whether the variations in SCFAs in serum stem from gastric or intestinal microbial fermentation changes, we collected gastric fluid from both normal and GC-afflicted mice for microbiome sequencing and SCFAs analysis. The sequencing results revealed an increase in genera such as Ligilactobacillus and Dubosiella in the gastric contents of normal mice, while Clostridiales, Lachnospiraceae, Muribaculum, Bacteroides, Parabacteroides, and others were augmented in the gastric contents of mice with GC. Despite substantial differences in microbial composition between the two groups as indicated by microbiome sequencing, the analysis of short-chain fatty acids in gastric fluid revealed markedly lower levels, approximately 1/8 to 1/10 of the levels in serum, with no statistically significant variance observed between the two groups (Figure S4).
Figure 1. (a) Differential analysis of microbial community composition in feces at the genus level between gastric cancer (GC) patients (GC, n = 20) and healthy individuals (Normal, n = 20). Differential analysis was performed on all species at each level, with the bar graph showing the top 30 species with p-values <0.05 and including differential species. Differential species were shown on the x-axis (arranged in order of abundance from left to right) and the y-axis indicated relative abundance. Bar heights indicated relative abundance of species in the different groups. (b) PCoA 2D plot: the green represented Normal and the red performed GC, and the closer the samples were, the more similar their microbial community structured, indicating less variation. (c) Violin plot: the p-value in the upper left corner represented the results of the rank-sum test for GC and Normal groups in the plot. * significant difference, ** highly significant difference, ns, non-significant difference. (d-e) GC-MS analysis of SCFA contents, including acetic, propionic, butyric, isobutyric, valeric, and isovaleric acids, in the feces (D) and serum (E) of GC patients (n = 20) and healthy individuals (n = 20). (f-g) Immunohistochemical and immunofluorescence analysis of levels of GPR109A, GPR43, and GPR41 in cancer and adjacent tissues from GC patients (n = 50 to 60 pairs). (h) mRNA expression of GPR109A, GPR43, and GPR41 in tumor and control tissues from GC patients (n = 6 pairs). (i) Western blotting of SCFA receptors (GPR109A/GPR43/GPR41) in GES-1 and GC cell lines MGC-803, HGC-27, and SNU-216, together with changes in expression after 10 mM Ac and 5 mM Bu treatment. Data indicate the mean ± SD. *p < .05, **p < .01, and ***p < .001, by 2-tailed Student’s t test or one-way ANOVA. Mann-Whitney U test was used for differential comparison of two groups of samples with biological replicates; Kruskal-Wallis test was used for comparison of multiple groups of samples with biological replicates. p < 0.05 was considered statistically significant.
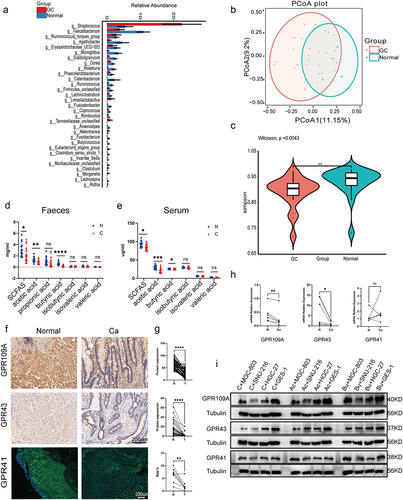
To further elucidate the presence of parallel variations in SCFA receptors in the cancerous tissues of GC patients, 50–60 pairs of GC tumor and adjacent tissues were collected and differential expression was analyzed using immunohistochemistry and immunofluorescence. It was found that the mRNA and protein expression of SCFA receptors, including the G-protein coupled receptors 109A (GPR109A) and 43 (GPR43), were markedly decreased in cancerous tissues compared with adjacent tissues. Nonetheless, it’s worth noting that there was no statistically significant difference in the mRNA expression of GPR41 (). These results were verified in the normal human gastric epithelial cell line GES-1 and the GC cell lines MGC-803, HGC-27, and SNU-216. Measurement of GPR109A and GPR43 mRNA levels by PCR showed that these were lower in the GC cells compared with normal cells, although consistent GPR41 levels were only observed in SNU-216 cells. Additionally, we discovered that the addition of butyrate (Bu) or acetate (Ac) during culture had no effects on the mRNA expression of the three receptors in normal epithelial cells, but promoted the mRNA expression of GPR109A and GPR43 in tumor cell lines. However, increased levels of GPR41 were only seen after Bu addition in MGC-803 and HGC-27 cells (Figure S5). Immunoblotting showed that while the protein levels of all three receptors were markedly reduced in MGC-803 and HGC-27 cells, only those of GPR43 were reduced in SNU-216 cells. Incubation with Bu resulted in increased protein expression of all three receptors (except GPR41 in SNU-216) in GC cells, while the expression of all three remained unchanged after Ac addition to SNU-216, as well as that of GPR109A in MGC-803 cells (; Figure S6).
The gut microbiota in GC patients promotes GC development and reduces the level of butyrate
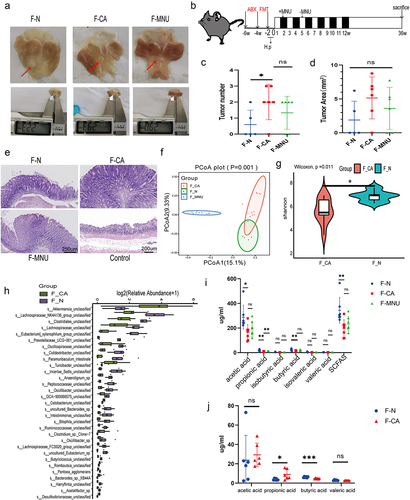
To determine whether the development of GC is due to changes in intestinal bacteria or whether GC changes the composition of intestinal bacteria, we constructed an ABX antibiotic-induced sterile gastrointestinal model. We then performed recolonization of the intestinal microbiota with fecal microbiota from normal individuals and GC patients, followed by induction of GC using H.pylori+MNU in mice (Figure S1; ). After 42 weeks, it was found that the animals who had received microbiota from GC patients were significantly more likely to develop GC, seen in the greater numbers of gastric tumors compared with mice that received microbiota from normal individuals (). Fecal samples from mice after transplantation with microbiota were analyzed by 16S rRNA sequencing. we observed the species composition within and between groups, using principal coordinate analysis (PCoA) and Alpha diversity analysis to visually represent differences in the structural composition of species between the groups in two-dimensional space. The results indicated a significant disparity in the microbial diversity of gut microbes between gastric cancer mice that underwent fecal microbiota transplantation and untreated gastric cancer mice, concurrently affirming the successful transplantation of fecal microbiota (; Figure S7; S8.a). Simultaneously, the findings corroborated significant differences in the composition of the gut microbiota between mice transplanted with fecal samples from GC patients and those who received samples from healthy individuals (). Additionally, For a more intuitive comparison of bacterial abundance in samples, we selected the 30 most abundant species for classification; the relative abundance of each group is shown in a stacked bar chart. This showed that compared to mice transplanted with fecal bacteria from healthy individuals, mice transplanted with fecal bacteria from GC patients had elevated levels of the Akkermansia, Turicibacter, Cetobacterium, Romboutsia, Desulfovibrionaceae, Mycoplasmataceae, and Ralstonia genera in their intestinal microbiota. Conversely, there was a decrease in the presence of Lachnospiraceae_NK4A136_group, Eubacterium]_xylanophilum_group, Prevotellaceae_UCG −001, Colidextribacter, Paramuribaculum, Incertae_Sedis, Oscillibacter, Anaerotignum, GCA − 900066575, Intestinimonas, Bilophila, Ruminococcaceae, Lachnospiraceae_FCS020 _group, Eubacterium, Acetatifactor, Butyricicoccus, Pantoea, Robinsoniella, Harryflintia and UCG −009 genera (; Figure S8b, 9a). Through in-depth analysis of the gut microbiota in two groups, it was observed that the transplantation of healthy fecal microbiota into mice resulted in an enrichment of membrane receptors, transcription factors, and pathways associated with pyruvate metabolism, as compared to mice transplanted with GC-associated fecal microbiota. Pyruvate can undergo metabolic conversion to butyrate (Figure S9b, c). Furthermore, GC-MS was used to evaluate the SCFA contents in the feces and sera of both groups of mice. Significantly reduced levels of acetic (AC), butyric (BC), and propionic acid, and total SCFA contents were found in the GC mouse feces, while reduced BC concentrations were seen in the sera. Conversely, there was a significant increase in propionic acid content in serum samples ().
Figure 2. ABX mouse transplantation of GC patients and normal individuals’ fecal microbiota was induced GC with H. pylori SS1+MNU treatment. Groups: mice transplanted with normal human microbiota (F-N), GC microbiota (F-CA), pbs (F-MNU), and mice without induction and treatment (Control) (−6 + 36 w). (a) Macroscopic observation of GC induction at − 6 + 36 weeks after fecal microbiota transplantation. (b) Illustration depicting microbiota transplantation in conjunction with the gastric cancer induction model. (c-d) the number and maximum volume of induced tumors were observed in the three groups (F-N, F-CA, F-MNU). (e) HE staining of mouse gastric tissue in the three groups. (f)PCoA 2D plot of there groups: the green: F-N, the blue: F-MNU, the red: F-CA, the dots were, the more similar their microbial community structured, indicating less variation. The microbial compositional structures in feces exhibited disparities between the two groups. (g) Violin plot: the p-value in the upper left corner represents the results of the rank-sum test for F-N and F-CA groups in the plot. (h) Differences in microbiota species between F-N and F-CA. Species were shown on the x-axis (arranged according to abundance from left to right) and relative abundance on the y-axis. Bar heights represented abundance of species in the different groups. n = 10 mice/group, but F-N = 6. (i-j) GC-MS analysis of the SCFA contents in feces (I) and sera (J) of mouse transplantation groups (F-N, F-CA, F-MNU). n = 5 to 6 mice/group, cages = 2 to 3/group. Data indicate the mean ± SD. *p < .05, **p < .01, and ***p < .001, by 2-tailed Student’s t test or one-way ANOVA. Mann-Whitney U test was used for differential comparison of two groups of samples with biological replicates; Kruskal-Wallis test was used for comparison of multiple groups of samples with biological replicates. p < .05 was considered statistically significant.
Butyrate inhibits GC cell proliferation but promotes apoptosis
To further investigate the underlying mechanisms in cells, Bu or Ac was added to both GC and normal epithelial cell lines. CCK8 assays showed that 5, 10, and 15 mmol/L of Bu, as well as 10, 20, and 40 mmol/L of Ac, markedly reduced the proliferation of GC cells (except for 10 mmol/L of Ac, which did not significantly inhibit the proliferation of SNU-216 cells) but did not affect proliferation in control GES-1 cells (). We thus selected the concentrations of 5 mmol/L of Bu and 10 mmol/L of Ac, together with incubation times of 0 (1 h after drug addition), 12, 24, and 48 h to monitor changes in proliferation. It was observed that proliferation in MGC-803 and SNU-216 cells began to be affected at 12 h, in contrast to HGC-27 cells which only showed inhibition after 24 h (). Furthermore, apoptosis and the cell cycle were measured by flow cytometry after Ac or Bu incubation, showing significantly raised apoptotic rates (; Figure S10) and G0/G1 phase arrest in tumor cells (Figure S11). Although no significant impact on the apoptosis rate of GES-1 cells was observed following Ac or Bu treatment, immunoblotting analysis revealed an unexpected suppression of apoptosis-related proteins, Bax and cleaved caspase 3, in GES-1 cells by Ac or Bu. Simultaneously, Bu significantly enhanced the expression of anti-apoptotic proteins, BCL-2 (; S12a).
Figure 3. (a-b) Proliferation in control GES-1 cells and GC MGC-803, HGC-27, and SNU-216 cells after treatment with varying concentrations of Ac (0, 10, 20, 40 mmol/L) and Bu (0, 5, 10, 15 mmol/L). (c-f) Proliferation in control GES-1 cells and GC cells at 0, 12, 24, and 48 hours of treatment with 10 mM Ac or 5 mM Bu. (g) Apoptosis in cells treated with 10 mM Ac or 5 mM Bu. Data indicate the mean ± SD. *p < .05, **p < .01, and ***p < .001, by 2-tailed Student’s t test or one-way ANOVA.
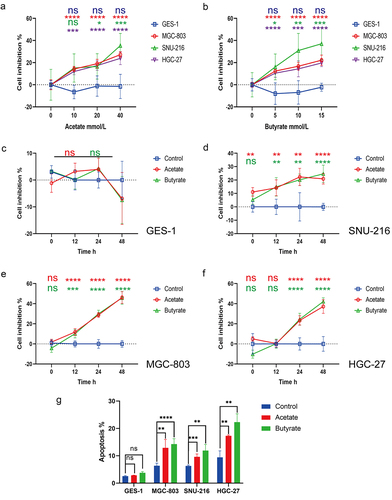
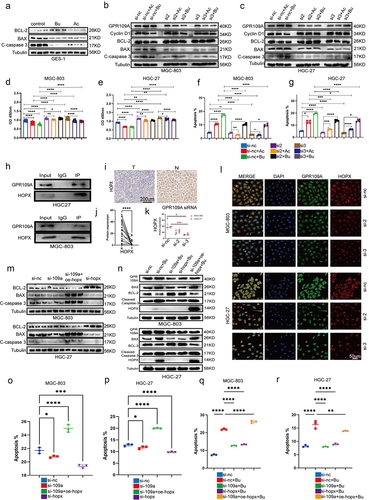
Figure 4. (a) Differences in protein expression of Bcl-2, Bax, and cleaved-caspase 3 after treatment with 10 mM Ac or 5 mM Bu in GES-1 cells. (b-c) Differences in protein expression of Cyclin D1, Bcl-2, Bax, and cleaved-caspase 3 after treatment with 10 mM Ac or 5 mM Bu in GPR109A-knockdown GC cells. (d-g) Changes in cell proliferation (d-e) and apoptosis (f-g) were observed in MGC-803 and HGC-27 cells after siRNA-mediated knockdown of GPR109A and treatment with Ac or Bu. (h) Co-immunoprecipitation confirmed the interaction between GPR109A and HOPX proteins. (i) Differences in HOPX protein expression were detected by IHC in cancer and adjacent tissues of GC patients. (j) Quantification of the results of (I). (k-l) Differences in the co-localization of GPR109A and HOPX between the GC cell lines MGC-803 and HGC-27 after siRNA-mediated knockdown of GPR109A combinated with 5 mM Bu. (m) Differences in the expression of apoptosis-related proteins Bcl-2, Bax, and cleaved-caspase 3 were observed in MGC-803 and HGC-27 cells after siRNA-mediated knockdown of GPR109A and HOPX, knockdown of GPR109A, or overexpression of HOPX. (n) Differences in the expression of apoptotic and anti-apoptotic-related proteins were scrutinized after (M) combinated with 5 mM Bu. (o-p) Changes in cell apoptosis rates after the (M) treatment. (q-r) Changes in cell apoptosis rates after the (N) treatment. Data indicate the mean ± SD. *p < .05, **p < .01, and ***p < .001, by 2-tailed Student’s t test or one-way ANOVA.
Butyrate reduces GC cell proliferation and promotes apoptosis through GPR109A/HPOX
To further investigate the mechanism by which Bu inhibits the progression of GC, we selected GPR109A, one of the receptors affected by Bu, as a downstream pathway for our study. GPR109A was knocked down in MGC-803 and HGC-27 cells using siRNA (Figure S12b, c), after which the cells were treated with Ac or Bu, and changes in proliferation, apoptosis, and the cell cycle were examined. After verifying the levels of apoptosis- and anti-apoptosis-associated proteins through immunoblotting, reduced levels of the cell cycle protein Cyclin D1 were observed in MGC-803 and HGC-27 cells following treatment with Bu or Ac. The anti-apoptotic protein Bcl-2 showed similar behavior. Knockdown of GPR109A led to a significant attenuation of the effects of both Ac and Bu on GC cells. Furthermore, the levels of two apoptosis-associated proteins, Bax and cleaved caspase 3, showed opposite changes compared to those of the anti-apoptotic proteins (; Fig S12d, e). Evaluation of the effects of Ac and Bu on apoptosis using CCK8 assays and flow cytometry indicated that these effects, namely, reduced proliferation and enhanced apoptosis, were markedly reduced after GPR109A knockdown (; Figure S12f). Similarly, the G0/G1 phase arrest induced by Ac and Bu treatment was mitigated in HGC-27 cells after GPR109A knockdown (Figure S13).
A literature search identified a recent article demonstrating that the inhibitory effects of β-hydroxybutyrate on colon cancer cell proliferation were mediated by HCAR2/HOPX.Citation27 HCAR2 is a synonym for GPR109A in humans. We, therefore, selected HOPX as a downstream target for investigation. Immunoprecipitation and immunofluorescence co-localization experiments showed a significant interaction and spatial co-localization between GPR109A and HOPX proteins (). In addition, we discovered that knocking down GPR109A led to a reduction in co-localization after treatment with 5 mmol/L Bu (; Figure S14c). Immunohistochemical analysis of GC and adjacent normal tissue specimens indicated that the expression of HOPX protein was reduced in the tumor tissues (). Next, siRNA was used to knock down GPR109A or HOPX and HOPX was overexpressed after plasmid transfection (Figure S12b, c; S14a, d). Through immunoprecipitation assays to detect apoptotic and anti-apoptotic-related proteins, as well as flow cytometry to assess cellular apoptosis rates, our findings indicated that downregulation of HOPX significantly inhibits cell apoptosis. Conversely, when it was overexpressed, it exhibited a distinct pro-apoptotic effect. However, when we specifically knocked down GPR109A, we observed a little significant impact on the HOPX expression and apoptosis in GC cells (; Figure S14b). It was plausible that GC cells inherently exhibited low GPR109A expression or that as a receptor, it necessitated ligand activation to function, a phenomenon warranting further exploration. Nevertheless, when we introduced 5 mmol/L Bu to the aforementioned overexpressed or knocked-down cells, Western blotting revealed that the augmented expression of Bax and cleaved caspase-3 proteins induced by Bu treatment was significantly diminished after GPR109A or HOPX knockdown. However, the overexpression of HOPX in GPR109A-knockdown cells partially restored the pro-apoptotic effects of Bu, while the levels of the anti-apoptotic protein Bcl-2 were reduced (; Figure S15a, b, e). Subsequent flow cytometry analysis demonstrated a consistent correlation between changes in apoptosis-related proteins and alterations in apoptosis rates (; Figure S15c, d, f). Hence, we posited that GPR109A’s role in promoting apoptosis in gastric cancer cells necessitated activation in the presence of Bu. Bu not only activated GPR109A protein but also enhanced its expression.
Butyrate suppresses GC development and progression through GPR109A
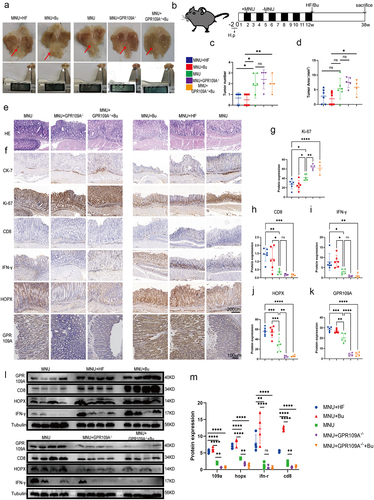
To further investigate whether Bu inhibits GC development through GPR109A, GPR109A−/− and GC-induced model mice were fed a high-fiber (HF) diet or supplemented with Bu after 12 weeks (Figure S1c). Samples were collected after 38 weeks. Statistical analysis of the numbers and volumes of gastric tumors showed that tumor development was inhibited to some extent by HF diets or Bu treatment. Knockout of GPR109A resulted in no significant increase in GC occurrence. Nevertheless, the inhibitory effects of Bu were significantly reduced in GPR109A knockout mice (; Figure S16a). Immunohistochemistry showed that the levels of both GPR109A and HOPX in the gastric tissues of the mice were consistently upregulated after HF or Bu supplementation while significantly reduced HOPX levels were seen in the GPR109A-knockout mice compared with the GC-model group (, j-m).
Figure 5. At week 12 following the induction of GC with H. pylori SS1+MNU, wild-type and GPR109A−/− mice were supplemented with either Bu or a high-fiber diet (HF) until week 38 (−2 + 38 w). Tissue samples were collected from the mice in the different groups, including the wild-type group supplemented with high-fiber diet (MNU+HF), the wild-type group supplemented with Bu in the drinking water (Mnu+bu), the wild-type group (MNU), the GPR109A−/− group (MNU+GPR109A−/−), and the GPR109A −/− group supplemented with Bu in the drinking water (MNU+GPR109A−/−+Bu). (a-b) the gross morphology of the stomachs, (c) tumor numbers, and (d) maximum tumor volumes in the mice were recorded for the five groups. (e) HE staining was used to observe the morphological characteristics of mouse gastric tissues in each group. (f) immunohistochemistry was used to detect differences in the protein expression of tumor-related markers Ki-67 and CK-7, as well as GPR109A, HOPX, CD8, and IFN-γ for the five groups. (g-k) Quantification of the results of (F). (l) Differences in the expression of GPR109A, HOPX, CD8, and IFN-γ detected by Western Blotting in GC tumors. (m) Quantification of the results of (L). n = 4 to 6 mice/group, cages = 2 to 3/group, cages = 2 to 3/group. Data indicate the mean ± SD. *p < .05, **p < .01, and ***p < .001, by 2-tailed Student’s t test or one-way ANOVA.
To verify the inhibitory effect of Bu on the progression of GC, we administered 100 mM of Bu in the drinking water of GC model mice. This intervention was carried out between weeks 30 and 52, during which we examined the gastric changes in the mice and collected tissue samples. It was found that both the number and volumes of gastric tumors were significantly reduced by Bu supplementation (; Figure S16.b). Both GPR109A and HOPX levels were also consistently upregulated in GC-model mice after treatment with Bu (). Furthermore, elevated levels of both proteins were seen in the gastric tissues of mice transplanted with the fecal samples from healthy human individuals compared to those who received transplantation from GC patients (; Figure S16.c).
Figure 6. Mice with H. pylori SS1+MNU-induced GC were supplemented with Bu (Mnu+bu) from 30 weeks to 52 weeks (−2 + 52 w). (a-b) Macroscopic observations of the stomachs, (c) tumor numbers, and (d) maximum tumor volumes were compared between the MNU and MNU+Bu groups (−2 + 52 w). (e) HE staining and (f) Immunohistochemical staining of the tumor-associated markers Ki-67 and CK-7, and GPR109A, HOPX, and IFN-γ in gastric tissues from the MNU and MNU+Bu groups. (g-j) Quantification of the results of (f). n = 5 mice/group, cages = 2 to 3/group, cages = 2 to 3/group. Data indicate the mean ± SD. *p < .05, **p < .01, and ***p < .001, by 2-tailed Student’s t test or one-way ANOVA.
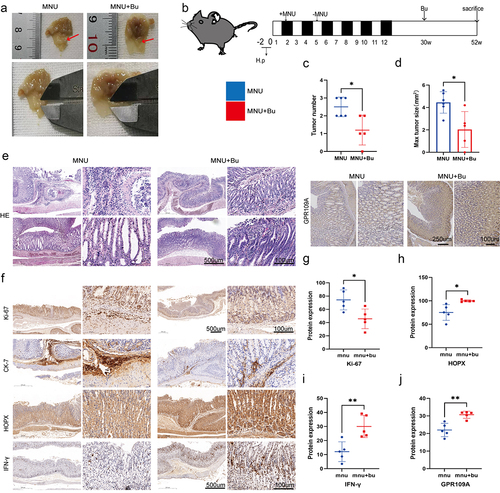
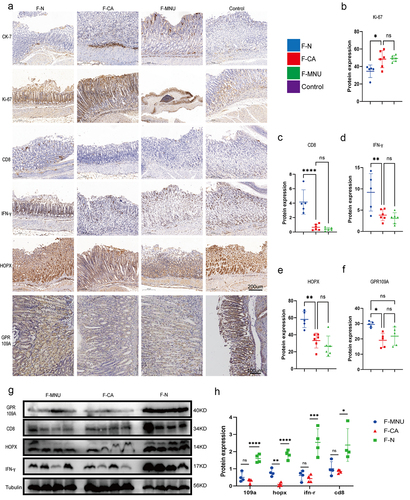
Figure 7. Groups: mice transplanted with normal human microbiota (F-N), GC microbiota (F-CA), pbs (F-MNU), and mice without induction and treatment (Control) (−6 + 36 w). (a) Immunohistochemical analysis of levels of the tumor-related indicators Ki-67 and CK-7 protein in gastric tissue of each group, together with the differential expression of GPR109A, HOPX, CD8, and IFN-γ proteins. (b-f) Quantification of the results of (A). (g) Western blotting of GPR109A, HOPX, CD8, and IFN-γ proteins in gastric tumor tissue of the different groups. (h) Quantification of the results of (G). n = 5 to 6 mice/group, cages = 2 to 3/group, cages = 2 to 3/group. Data indicate the mean ± SD. *p < .05, **p < .01, and ***p < .001, by 2-tailed Student’s t test or one-way ANOVA.
Increased CD8+ T cell numbers in the tumor microenvironment of mice after transplantation of fecal samples from healthy individuals and treatment with Bu
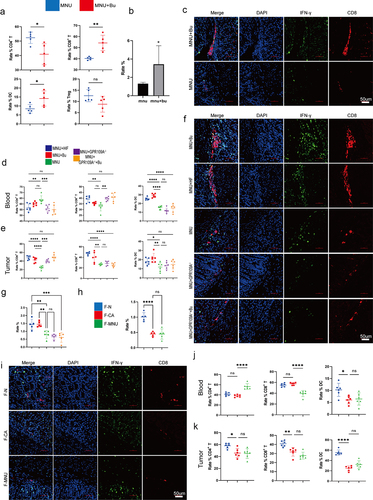
As shown above, it was observed that although Bu could directly inhibit GC cell proliferation and enhance apoptosis, it requires a drug concentration of approximately 5 mmol/L. However, the concentration of Bu in peripheral blood cannot reach this level. We, therefore, investigated whether the effects of Bu are mediated by other means in the body. The levels of CD8 and IFN-γ and their co-expression in mouse gastric tissue were examined by immunohistochemistry and immunofluorescence, as well as in the tumors using immunoblotting. Flow cytometry was used to analyze the proportions of CD3+ T cells, CD4+ T cells, CD8+ T cells, DCs, and CD25+ FOXP3+ Treg cells in the peripheral blood and gastric tumors of mice. It was found that GC mice supplemented with Bu had increased levels of CD8 and IFN-γ (; ), as well as co-expression of CD11c and CD86 and CD8 and GPR109A, were increased in the stomach tissue of mice (Figure S17.e, f). Additionally, the proportions of DCs and CD4+ T and CD8+ T cells in peripheral blood increased, but the proportions of CD3+ T and CD25+ FOXP3+ Treg cells were relatively unchanged (; Figure S17a-d). The same measurements were performed in mice transplanted with fecal samples from GC patients had reduced levels of CD8 and IFN-γ (), as well as reduced co-expression, in the tumor tissues () in comparison with mice that had received fecal samples from healthy individuals. While DCs were the only cell population showing reductions in the peripheral blood, the proportions of both DCs and CD8+ T cells were found to have decreased in gastric tissue (; Figure S17g, h). Further evaluation of mice supplemented with Bu or HF for 12 weeks showed increased expression and co-expression of CD8 and IFN-γ. However, knockout of GPR109A did not decrease the co-expression of CD8 and IFN-γ compared to the MNU group (). Nevertheless, GPR109A knockout significantly weakened the effect of Bu on reducing the expression of CD8 and IFN-γ (). Flow cytometry of the peripheral blood and tumor tissues showed that after HF treatment, the proportions of DCs in the blood and DCs and CD8+ T cells in the tumors were increased and after Bu treatment, increased levels of both cell types were observed in both blood and tumor tissues. However, compared to the MNU group, GPR109A knockout elevated the numbers of CD8+ T cells in the blood. Nevertheless, continued treatment with Bu led to reductions in both DCs and CD8+ T cells in the tumors (; Figure S17.i, j).
Figure 8. (a) Flow cytometry analysis of the proportions of CD3+ T, CD4+ T, CD8+ T, CD25+ FOXP3+ Treg cells, and DCs cells in mouse peripheral blood in the MNU and MNU+Bu groups (−2 + 52 w). (b) Quantitative statistical analysis of the fluorescence colocalization of (c). Positive cell rate (%). (c) Immunofluorescence staining showing the co-expression of CD8 and IFN-γ in the two groups. (d-e) Flow cytometry analysis of the proportions of DCs and CD3+ T, CD4+ T, and CD8+ T cells in mouse gastric tumor tissues and peripheral blood in the different groups (MNU+HF, MNU+Bu, MNU, MNU+GPR109A−/−, MNU+GPR109A−/−+Bu) (−2 + 38 w). (f) The co-expression of CD8 and IFN-γ in the five groups. (g) Quantitative statistical analysis of the fluorescence colocalization of (F). Positive cell rate (%). (h) Quantitative statistical analysis of the fluorescence colocalization of (I). Positive cell rate (%). (i) The co-expression of CD8 and IFN-γ in the groups (F-N, F-CA, F-MNU) (−6 + 36 w). (j-k) Flow cytometry analysis of the proportions of DCs and CD3+ T, CD4+ T, and CD8+ T cells in mouse gastric tumor tissues and peripheral blood in the three (F-N, F-CA, F-MNU) groups. n = 4 to 6 mice/group, cages = 2 to 3/group, cages = 2 to 3/group. Data indicate the mean ± SD. *p < .05, **p < .01, and ***p < .001, by 2-tailed Student’s t test or one-way ANOVA.
Butyrate enhances CD8+ T cell cytotoxicity against GC cells through GPR109A/HOPX
Analysis of the results of animal experiments indicated that Bu treatment markedly elevated the levels and co-expression of CD8 and IFN-γ. However, its effect was weakened by GPR109A knockout. The regulatory effects of GPR109A/HOPX on CD8+ T cell function were then investigated. Analysis of co-localization using immunofluorescence indicated that GPR109A and CD8 co-localized in mouse gastric tissue (; Figure S18a). CD8+ T cells were then isolated from human peripheral blood using gradient centrifugation and cell selection, resulting in the isolation of sufficient cells for downstream experiments through in vitro expansion and activation. Analysis of the effects of Bu on CD8+ T cells showed that 0.1 mmol/L Bu promoted the proliferation of these cells as well as significantly increasing the proportion of IFN-γ+ CD8+ T cells (; Figure S18b). Increasing the Bu concentration showed that at 1 mmol/L, the proliferation of CD8+ T cells was inhibited, and at 0.5 mmol/L, the production of IFN-γ was maximal, although these effects were reversed when the concentration continued to increase to 1.5 mmol/L (). Immunoblotting indicated that Bu increased the GPR109A and HOPX protein levels as well as that of Bcl-2 in CD8+ T cells. However, inhibition of GPR109A reduced this action (Figure S18e-g).
Figure 9. (a) Co-localization of GPR109A and HOPX proteins in CD8+ T cells. (b-c) Co-localization of CD8 and GPR109A shown by immunofluorescence in mouse gastric tissue in the MNU and MNU+Bu groups (−2 + 52 w). (d) Changes in the proportion of IFN-γ positive cells in the CD8+ T cell group after treatment with different concentrations of Bu. (e-f) Changes in the proliferation of CD8+ T cells after treatment with different concentrations of Bu (e) or GPR109A inhibitors (f). (g) Changes in the proportion of IFN-γ-positive CD8+ T cells after treatment with Bu together with GPR109A inhibitors, HOPX knockdown, or HOPX overexpression. (h-i) Changes in the apoptotic rates (h) and the altered cytotoxicity (i) of tumor cells induced by CD8+ T cells after treatment with Bu together with GPR109A inhibitors, HOPX knockdown, or HOPX overexpression, co-cultured with MGC-803 or HGC-27. (j) Simplified diagram of CAR-claudin18.2 sequence. (k) Infection efficiency of primary CD8+ T cells by CAR-claudin18.2 lentivirus. (l) Differences in the level of Claudin 18.2 proteins in HGC-27, MGC-803 and GES-1 cells detected by western blotting. (m) Fluorescence images showing claudin18.2 protein expression in GC tumor tissue and adjacent tissue. (n-q) groups: UTD, CAR-T, CAR-T+Bu. (n) Apoptosis rate of GC cells MGC-803 or HGC-27 after co-cultivation with CAR-claudin18.2+ CD8+ T cells or combined with Bu. (o) Cytotoxicity of CAR-claudin18.2+ CD8+ T cells or combined with Bu against MGC-803 or HGC-27 gastric cancer cells. (p-q) Flow cytometry analysis of IFN-γ and Granzyme B positive expression in CAR-claudin18.2+ CD8+ T cells after co-cultivation with MGC-803 or HGC-27 GC cells, either alone or combined with Bu. (r-t) groups: Bu+nc, Bu + 109a blocker, Bu+sh-hopx, Bu + 109a blocker+oe-hopx. (r) The altered cytotoxicity of GC cells induced by CAR-claudin18.2+ CD8+ T cells after treatment with Bu together with GPR109A inhibitors, HOPX knockdown, or HOPX overexpression, co-cultured with MGC-803 or HGC-27. (s-t) Changes in the proportion of IFN-γ+ or Granzyme B+ CAR-claudin18.2+ CD8+ T cells after the same treatment (r). Data indicate the mean ± SD. *p < .05, **p < .01, and ***p < .001, by 2-tailed Student’s t test or one-way ANOVA.
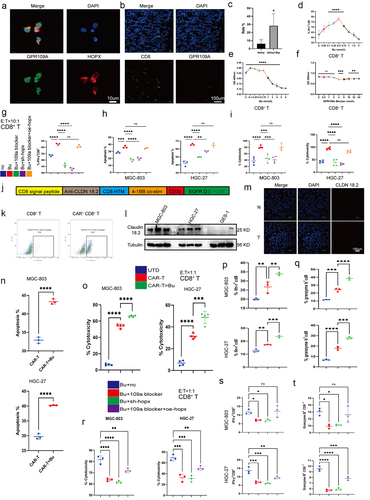
To investigate whether the role of GPR109A/HOPX in CD8+ T cells was similar to that in GC cells, experiments using GPR109A inhibitors, HOPX knockdown and overexpression, and Bu was performed. It was found that inhibiting GPR109A and HOPX suppressed the effects of Bu on the production of IFN-γ in CD8+ T cells, but in cells where GPR109A was inhibited and HOPX overexpressed, the promotion effect was restored (; Figure S18h). However, when excluding Bu and solely employing GPR109A inhibitors, HOPX knockdown and overexpression, the observed trend in knockdown or overexpression consistently aligned with the outcomes induced by Bu addition. Despite the statistical significance of GPR109A inhibition, its suppressive effect was markedly less pronounced compared to the sole downregulation of HOPX expression (Figure S18c, d). Hence, the results may remain congruent with their impact on GC cells, requiring the presence of Bu for GPR109A activation to exert downstream effects. Merely downregulating GPR109A expression without inhibiting its activation failed to manifest its pivotal role. In addition, Co-culture of activated CD8+ T cells with the GC cells MGC-803 and HGC-27 indicated a clear consistent trend between the promotion of apoptosis and cytotoxicity in GC cells and the production of IFN-γ (; Figure S18h, i).
Butyrate enhances CAR-Claudin 18.2+ CD8+ T cytotoxicity against GC cells through GPR109A/HOPX
In order to further analyze whether the direct cytotoxic effect of CD8+ T cells on gastric cancer cells can be enhanced by Bu, a literature review was conducted and confirmed that Claudin 18.2 serves as a specific target in gastric cancer (). Furthermore, its high expression in gastric cancer was demonstrated through WB and tissue fluorescence (; Figure S19a-c). Subsequently, CAR-Claudin 18.2 was introduced into isolated CD8+ T cells, granting them the capability to directly eliminate gastric cancer cells. Through co-culturing CAR-Claudin 18.2+ CD8+ T cells with gastric cancer cells and assessing the cytotoxicity toward gastric cancer cells, as well as the induction of apoptosis in gastric cancer cells, a significant increase in killing efficacy mediated by Bu was observed, accompanied by a notable elevation in the apoptosis of gastric cancer cells (; Figure S19d). Further analysis of the functional factors of CAR-Claudin 18.2+ CD8+ T cells revealed that the production of IFN-γ and Granzyme B was markedly augmented by 0.5 mmol/L Bu (; Figure S19e, f). Similarly, it was observed that the cytotoxicity of CAR-Claudin 18.2+ CD8+ T cells, as well as the production of IFN-γ and Granzyme B, were modulated by GPR109A/HOPX through the inhibition of GPR109A and the manipulation of HOPX expression via knockdown or overexpression. Furthermore, the augmenting effect of Bu on these cellular functions demonstrated a trend comparable to its influence on CD8+ T cell presentation (; Figure S19g, h).
Butyrate enhances CAR-Claudin 18.2+ CD8+ T cell activity in vivo
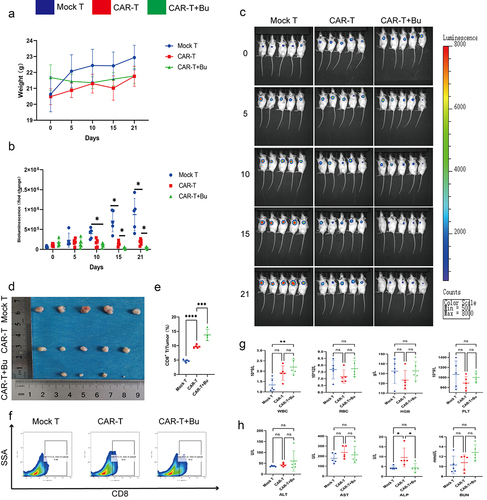
To validate the potential of Bu in enhancing the cytotoxicity of CAR-Claudin 18.2+ CD8+ T cells in vivo, we conducted a subcutaneous tumor experiment (). On the 10th day of treatment with CAR-Claudin 18.2+ CD8+ T cells or a combination of CAR-T cells and Bu, the CAR-T combined with Bu group exhibited noticeable therapeutic effects. Furthermore, on days 15 and 21, the CAR-T combined with Bu group demonstrated superior treatment efficacy compared to the CAR-T group, with significant statistical differences observed (). Concurrently, through flow cytometric analysis of intratumoral CD8+ T cell proportions, we observed a greater infiltration of CD8+ T cells in the CAR-T combined with Bu group compared to the CAR-T group (). Additionally, analysis of complete blood counts (WBC, RBC, HGB, and PLT), blood biochemistry (ALT, AST, ALP, and BUN), and body weight revealed no significant changes in the CAR-T combined with Bu group compared to the CAR-T group or the Mock-T group ().
Figure 10. CAR-claudin18.2+ CD8+ T cells were administered in conjunction with 0.5 mmol/L Butyrate for the treatment of subcutaneous MGC-803 tumors. groups: Mock T, CAR-T, CAR-T+Bu. (a) Analysis of body weight fluctuations. (b) Live imaging statistical analysis of (C). (c) In vivo imaging conducted on days 0, 5, 10, 15, and 21. (d) Tumor size was measured after 23 days of treatment. (e-f) Flow cytometry analysis revealed the proportion of CD8+ T cells within the tumor. (g) Hematological analysis showed variations in WBC, RBC, HGB, and PLT. (h) Blood biochemistry examination reflected changes in ALT, AST, ALP, and BUN levels. The data represent the mean ± SD. *p < .05, **p < .01, and ***p < .001, as determined by a two-tailed Student’s t-test or one-way ANOVA.
Discussion
The findings of the study showed that transplantation of a healthy human gut microbiome can suppress GC development as well as improve the immune-suppressive microenvironment of stomach carcinoma. We propose that this effect is due to the production of Bu by the intestinal microbiota, enhancing the cytotoxic function of CD8+ T cells through the GPR109A/HOPX axis and thus improving the immunosuppressive state. This not only demonstrates that the gut microbiota can remotely regulate GC through metabolites but also highlights the significant role of GPR109A in the immune regulation of GC. More importantly, current research suggests that regulating the composition of gut microbiota or supplementing gut bacterial metabolites such as butyric acid, may enhance the immune microenvironment of GC and may provide a novel theoretical basis for immunotherapy strategies for GC.
The microbiota of the gastrointestinal tract functions as a symbiotic organism within the body, where it is involved in establishing and regulating the host’s immune and digestive functions, as well as in regulating endocrine and neural signaling, metabolism, and the production of physiologically active substances.Citation28,Citation29 Given the multifaceted physiological functions of intestinal microorganisms, an increasing number of studies have demonstrated that they affect the development and progression of obesity, nonalcoholic fatty liver disease, metabolic syndrome, cardiovascular metabolic diseases (CMD), and cancer, among other pathologies.Citation30,Citation31 For instance, the feces of patients with colon cancer show reduced abundance of potentially protective bacteria, such as Roseburia, while the numbers of numerous potentially carcinogenic bacteria, including Bacteroides, Escherichia coli, Clostridium difficile, and Porphyromonas, markedly increases.Citation32 Currently, although numerous studies have demonstrated the effects of gut bacteria on colon cancer progression through the transplantation of both fecal microbiota and single bacterial strains, the mechanisms underlying the relationship between GC and gut bacteria remain poorly understood. Here, after establishing the ABX+ fecal transplant model and GC in model mice, it was observed that in mice receiving microbiota from GC patients, progression of GC tumors was enhanced, in contrast to mice that received microbiota from healthy individuals. These findings illustrate the significant role played by the gut microbiota in GC.
To elucidate the specific mechanisms, we analyzed the intestinal microbiota of both humans and mice using 16S rRNA sequencing. Markedly reduced abundance of Faecalibacterium, Ruminococcus, Subdoligranulum, Dorea, Roseburia, Phascolarctobacterium, and Butyrici-coccus were observed in the fecal samples of GC patients, as well as in transplanted mouse fecal samples of Ligilactobacillus, Clostridiales, Paramuribaculum, Butyricimonas, Anaeroplasma, and Lachnospiraceae_UCG-001. However, unexpectedly, there was a significant increase in the Akkermansia genus. Studies indicate that members of the phylum Firmicutes, specifically the genera Phascolarctobacterium, Roseburia, Blautia, Faecalibacterium, Clostridium, Subdoligranulum, Ruminococcus, and Coprococcus, as well as the phylum Bacteroidetes, particularly the genus Bacteroides, are capable of fermenting and producing SCFAs within the intestinal tract.Citation33,Citation34 Similarly, research on the microbiomes of mice also indicates the participation of the Lachnospiraceae_NK4A136_group, Paramuri-baculum, Ruminococcaceae and Butyricicoccus genera in the production of SCFAs.Citation35–38 However, increased numbers of Akkermansia were observed in the feces of both GC patients and transplanted mice, which contrasts with the previously observed decrease in Akkermansia in patients with colon cancer and diabetes.Citation39,Citation40 Further research on this topic is required. Research indicates that SCFAs can prevent the development and progression of colorectal cancer, as well as improve glycemic control in diabetes.Citation41,Citation42 SCFAs have been shown to have numerous functions in the maintenance of human health, acting as a nutrient and energy supply in the intestinal epithelium, protecting the mucosal barrier, reducing inflammation, and maintaining endocrine metabolism and immune regulation.Citation41,Citation43,Citation44 Here, GC-MS was performed to analyze the SCFAs present in the feces and sera of both human and transplanted mice. It was discovered that acetic acid and BC levels were lower in the samples collected from GC patients, as well as in their transplanted mouse fecal samples. However, only reduced levels of BC and increases in those of propionic acid were seen in the mouse sera. BC has been found to enhance apoptosis and reduce proliferation in colon cancer through the promotion of histone acetylation and enhancing the transcription of pro-apoptotic genes.Citation45,Citation46 Nevertheless, despite increased information on the effects of BC in colon cancer, its functions in GC remain poorly documented.
To explore the effects of BC on GC, we used an in situ GC induction model and GC cells. The findings indicated that supplementation with a high-fiber diet and Bu could significantly inhibit GC development. It was also found to promote apoptosis of GC cells and inhibit their proliferation. Fiber can produce SCFAs through fermentation by intestinal microbiota.Citation47 This study thus provides powerful evidence for the prevention of GC through a high-fiber diet. Here, Bu was found to have similar effects to those seen in colorectal cancer. In contrast to the earlier studies on colorectal cancer, the present study reports for the first time the inhibitory effect of BC on GC in a natural model simulating its development. Furthermore, the expression of BC receptors was investigated, showing that the levels of the G protein-coupled receptors 109A and 43 were reduced in GC, although they could be increased through exogenous supplementation. As shown in previous studies, Bu inhibited proliferation in colon cancer cells and promotes apoptosis through GPR109A and GPR43.Citation48 Although similar effects were observed after knockout of GPR109A, it was found that GPR109A knockout in GC mice reduced the effects of Bu. A recent study has shown that β-hydroxybutyric acid modulates HOPX through HCAR2 to inhibit the proliferation of colorectal cancer cells.Citation27 Consistent with this, it was found here that reduced HOPX expression in both GPR109A knockdown cells and GPR109A−/− mice, as well as overexpression of HOPX weakened the effects of GPR109A knockdown. Although the exogenous supplementation of Bu has also been shown to have similar effects on GPR109A/HOPX in GC cells, it is worth noting that the concentration of Bu required to inhibit GC cells is close to 5 mmol/L, which cannot be achieved in peripheral blood. Therefore, we believe that the levels of Bu produced by intestinal bacteria may not be directly responsible for its effects on GC.
However, research has shown that SCFAs from dietary sources can promote the memory function of CD8+ T cells activated by TCR.Citation49 Thus, the immune microenvironment of GC tumors was analyzed. Although no significant changes were observed in the numbers of Tregs, increased numbers of CD8+ T cells, as well as IFN-γ+ CD8+ T cells, were seen after supplementation of HF or Bu. After separating CD8+ T cells, it was found that 0.1 mmol/L of Bu enhanced the production of IFN-γ by CD8+ T cells and their killing of GC cells through GPR109A/HOPX. This finding may add a new mechanistic explanation for the impact of Bu on CD8+ T cell function. Furthermore, the ability to regulate CD8+ T cell function with just a Bu concentration of 0.1 mmol/L may provide a reasonable explanation for regulating gut microbiota to suppress GC. Currently, CAR-T has made significant advancements in the treatment of solid tumors. Research indicates that Claudin 18.2, a membrane protein, exhibited high expression in GC, pancreatic cancer, and esophageal cancer.Citation50,Citation51 Targeting this protein has yielded remarkable therapeutic effects in CAR-T treatment for GC.Citation52 Although in vitro and vivo studies have also demonstrated the potent cytotoxicity of CAR-Claudin 18.2+ CD8+ T cells against GC cells, our findings revealed that CAR-Claudin 18.2+ CD8+ T cells treated with 0.5 mmol/L Bu exhibited a significant enhancement in killing ability through modulation of GPR109A/HOPX, thereby augmenting the production of IFN-γ and Granzyme B. This discovery may provide a novel synergistic therapeutic approach to improve the efficacy of CAR-T in treating GC.
Abbreviations
| SCFAs | = | Short-chain fatty acids |
| GC | = | gastric cancer |
| GPR109A | = | G protein-coupled receptor 109A |
| MNU | = | N-methy-N-nitrosourean |
| Ac | = | acetate |
| Bu | = | butyrate |
| GC-MS | = | gas chromatography-mass spectrometry |
| PBMCs | = | peripheral blood mononuclear cells |
| PCoA | = | principal coordinate analysis |
| AC | = | acetic |
| BC | = | butyric |
| HF | = | high-fiber |
| HOPX | = | homologous domain protein homologous box |
Authors’ contributions
XY, GXL and YFH designed the studies. XY, JZO, LZW, ZYL and LX performed the research and analyzed the animal data. XY and YFH wrote the manuscript. All authors read and checked this manuscript.
R2 revision_supplemental figures and tables clean.docx
Download MS Word (90.4 MB)Acknowledgments
We appreciate the GPR109A−/− mice provided by Professor Guo-Qiang CHEN at School of Life Sciences, Tsinghua University.
Disclosure statement
No potential conflict of interest was reported by the author(s).
Data availability statement
The 16S rRNA sequencing data have been deposited in the NCBI BioProject database (https://www.ncbi.nlm.nih.gov/bioproject/) under accession numbers PRJNA976526 and PRJNA976543.
Supplementary material
Supplemental data for this article can be accessed online at https://doi.org/10.1080/19490976.2024.2307542
Additional information
Funding
References
- Sender R, Fuchs S, Milo R. Revised estimates for the number of human and bacteria cells in the body. PLoS Biol. 2016;14(8):e1002533. doi:10.1371/journal.pbio.1002533.
- Roy S, Trinchieri G. Microbiota: a key orchestrator of cancer therapy. Nat Rev Cancer. 2017;17(5):271–30. doi:10.1038/nrc.2017.13.
- Dzutsev A, Goldszmid R, Viaud S, Zitvogel L, Trinchieri G. The role of the microbiota in inflammation, carcinogenesis, and cancer therapy. Eur J Immunol. 2015;45(1):17–31. doi:10.1002/eji.201444972.
- Maeda Y, Kurakawa T, Umemoto E, Motooka D, Ito Y, Gotoh K, Hirota K, Matsushita M, Furuta Y, Narazaki M. et al. Dysbiosis contributes to arthritis development via activation of autoreactive T cells in the intestine. Arthritis & Rheumatology (Hoboken, N J). 2016;68(11):2646–2661. doi:10.1002/art.39783.
- Matsushita M, Fujita K, Hayashi T, Kayama H, Motooka D, Hase H, Jingushi K, Yamamichi G, Yumiba S, Tomiyama E. et al. Gut microbiota-derived short-chain fatty acids promote prostate cancer growth via IGF1 signaling. Cancer Res. 2021;81(15):4014–4026. doi:10.1158/0008-5472.CAN-20-4090.
- Ishikawa D, Sasaki T, Osada T, Kuwahara-Arai K, Haga K, Shibuya T, Hiramatsu K, Watanabe S. Changes in intestinal microbiota following combination therapy with fecal microbial transplantation and antibiotics for Ulcerative Colitis. Inflamm Bowel Dis. 2017;23(1):116–125. doi:10.1097/MIB.0000000000000975.
- Woelk C, Snyder A. Modulating gut microbiota to treat cancer. Sci (New York, NY). 2021;371(6529):573–574. doi:10.1126/science.abg2904.
- Yachida S, Mizutani S, Shiroma H, Shiba S, Nakajima T, Sakamoto T, Watanabe H, Masuda K, Nishimoto Y, Kubo M. et al. Metagenomic and metabolomic analyses reveal distinct stage-specific phenotypes of the gut microbiota in colorectal cancer. Nat Med. 2019;25(6):968–976. doi:10.1038/s41591-019-0458-7.
- Schulz M, Atay C, Heringer J, Romrig FK, Schwitalla S, Aydin B, Ziegler PK, Varga J, Reindl W, Pommerenke C. et al. High-fat-diet-mediated dysbiosis promotes intestinal carcinogenesis independently of obesity. Nature. 2014;514(7523):508–12. doi:10.1038/nature13398.
- Sivan A, Corrales L, Hubert N, Williams JB, Aquino-Michaels K, Earley ZM, Benyamin FW, Lei YM, Jabri B, Alegre M-L. et al. Commensal Bifidobacterium promotes antitumor immunity and facilitates anti-PD-L1 efficacy. Sci (New York, NY). 2015;350(6264):1084–9. doi:10.1126/science.aac4255.
- Dong X, Pan P, Zheng D, Bao P, Zeng X, Zhang X-Z. Bioinorganic hybrid bacteriophage for modulation of intestinal microbiota to remodel tumor-immune microenvironment against colorectal cancer. Sci Adv. 2020;6(20):eaba1590. doi:10.1126/sciadv.aba1590.
- Chen T, Li Q, Wu J, Wu Y, Peng W, Li H, Wang J, Tang X, Peng Y, Fu X. et al. Fusobacterium nucleatum promotes M2 polarization of macrophages in the microenvironment of colorectal tumours via a TLR4-dependent mechanism. Cancer Immunol Immunother. 2018;67(10):1635–1646. doi:10.1007/s00262-018-2233-x.
- Binnewies M, Roberts E, Kersten K, Chan V, Fearon DF, Merad M, Coussens LM, Gabrilovich DI, Ostrand-Rosenberg S, Hedrick CC. et al. Understanding the tumor immune microenvironment (TIME) for effective therapy. Nat Med. 2018;24(5):541–550. doi:10.1038/s41591-018-0014-x.
- Furusawa Y, Obata Y, Fukuda S, Endo TA, Nakato G, Takahashi D, Nakanishi Y, Uetake C, Kato K, Kato T. et al. Commensal microbe-derived butyrate induces the differentiation of colonic regulatory T cells. Nature. 2013;504(7480):446–50. doi:10.1038/nature12721.
- Yahoo N, Dudek M, Knolle P, Heikenwälder M. Role of immune responses in the development of NAFLD-associated liver cancer and prospects for therapeutic modulation. Journal Of Hepatology. 2023;79(2):538–551. doi:10.1016/j.jhep.2023.02.033.
- Hu C, Xu B, Wang X, Wan W-H, Lu J, Kong D, Jin Y, You W, Sun H, Mu X. et al. Gut microbiota-derived short-chain fatty acids regulate group 3 innate lymphoid cells in HCC. Hepatol. 2023;77(1):48–64. doi:10.1002/hep.32449.
- Balmer M, Ma E, Thompson A, Epple R, Unterstab G, Lötscher J, Dehio P, Schürch CM, Warncke JD, Perrin G. et al. Memory CD8+ T cells balance pro- and anti-inflammatory activity by reprogramming cellular acetate handling at sites of infection. Cell Metab. 2020;32(3):457–467.e5. doi:10.1016/j.cmet.2020.07.004.
- Tyagi A, Yu M, Darby T, Vaccaro C, Li J-Y, Owens JA, Hsu E, Adams J, Weitzmann MN, Jones RM. et al. The Microbial Metabolite Butyrate Stimulates Bone Formation via T Regulatory Cell-Mediated Regulation of WNT10B Expression. Immunity. 2018;49(6):1116–1131.e7. doi:10.1016/j.immuni.2018.10.013.
- Tan J, McKenzie C, Mariño E, Macia L, Mackay CR. Metabolite-sensing G protein–coupled receptors—facilitators of diet-related immune regulation. Annu Rev Immunol. 2017;35(1):371–402. doi:10.1146/annurev-immunol-051116-052235.
- Singh N, Gurav A, Sivaprakasam S, Brady E, Padia R, Shi H, Thangaraju M, Prasad P, Manicassamy S, Munn D. et al. Activation of Gpr109a, receptor for niacin and the commensal metabolite butyrate, suppresses colonic inflammation and carcinogenesis. Immunity. 2014;40(1):128–39. doi:10.1016/j.immuni.2013.12.007.
- Lu H, Xu X, Fu D, Gu Y, Fan R, Yi H, He X, Wang C, Ouyang B, Zhao P. et al. Butyrate-producing Eubacterium rectale suppresses lymphomagenesis by alleviating the TNF-induced TLR4/MyD88/NF-κB axis. Cell Host & Microbe. 2022;30(8):1139–1150.e7. doi:10.1016/j.chom.2022.07.003.
- Priyadarshini M, Kotlo K, Dudeja P, Layden BT. Role of short chain fatty acid receptors in intestinal physiology and pathophysiology. Compr Physiol. 2018;8(3):1091–1115. doi:10.1002/cphy.c170050.
- Docampo M, da Silva M, Lazrak A, Nichols KB, Lieberman SR, Slingerland AE, Armijo GK, Shono Y, Nguyen C, Monette S. et al. Alloreactive T cells deficient of the short-chain fatty acid receptor GPR109A induce less graft-versus-host disease. Blood. 2022;139(15):2392–2405. doi:10.1182/blood.2021010719.
- Miao Z, Sun J, Adkins-Threats M, Pang M-J, Zhao J-H, Wang X, Tang K-W, Wang Z-N, Mills JC. DDIT4 licenses only healthy cells to proliferate during injury-induced metaplasia. Gastroenterology. 2021;160(1):260–271.e10. doi:10.1053/j.gastro.2020.09.016.
- Ji L, Qian W, Gui L, Ji Z, Yin P, Lin GN, Wang Y, Ma B, Gao W-Q. Blockade of β-Catenin–Induced CCL28 suppresses gastric cancer progression via inhibition of treg cell infiltration. Cancer Res. 2020;80(10):2004–2016. doi:10.1158/0008-5472.CAN-19-3074.
- Hayakawa Y, Jin G, Wang H, Chen X, Westphalen CB, Asfaha S, Renz BW, Ariyama H, Dubeykovskaya ZA, Takemoto Y. et al. CCK2R identifies and regulates gastric antral stem cell states and carcinogenesis. Gut. 2015;64(4):544–53. doi:10.1136/gutjnl-2014-307190.
- Dmitrieva-Posocco O, Wong A, Lundgren P, Golos AM, Descamps HC, Dohnalová L, Cramer Z, Tian Y, Yueh B, Eskiocak O. et al. β-Hydroxybutyrate suppresses colorectal cancer. Nature. 2022;605(7908):160–165. doi:10.1038/s41586-022-04649-6.
- Lynch S, Pedersen O. The human intestinal microbiome in health and disease. N Engl J Med. 2016;375(24):2369–2379. doi:10.1056/NEJMra1600266.
- Fan Y, Pedersen O. Gut microbiota in human metabolic health and disease. Nat Rev Microbiol. 2021;19(1):55–71. doi:10.1038/s41579-020-0433-9.
- Perler B, Friedman E, Wu G. The role of the gut microbiota in the relationship between diet and human health. Annu Rev Physiol. 2023;85:449–468. doi:10.1146/annurev-physiol-031522-092054.
- Cani PD. Human gut microbiome: hopes, threats and promises. Gut. 2018;67(9):1716–1725. doi:10.1136/gutjnl-2018-316723.
- Wong S, Yu J. Gut microbiota in colorectal cancer: mechanisms of action and clinical applications. Nat Rev Gastro Hepat. 2019;16:690–704.
- Lu J, Zhang L, Zhai Q, Zhao J, Zhang H, Lee Y-K, Lu W, Li M, Chen W. Chinese gut microbiota and its associations with staple food type, ethnicity, and urbanization. npj Biofilm Microbio. 2021;7(1):71. doi:10.1038/s41522-021-00245-0.
- Zhang J, Guo Z, Xue Z, Sun Z, Zhang M, Wang L, Wang G, Wang F, Xu J, Cao H. et al. A phylo-functional core of gut microbiota in healthy young Chinese cohorts across lifestyles, geography and ethnicities. ISME J. 2015;9(9):1979–90. doi:10.1038/ismej.2015.11.
- Cai S, Fan Y, Zhang, B. et al. Appendectomy is associated with alteration of human gut bacterial and fungal communities. Front Microbiol. 2021;12:724980. doi:10.3389/fmicb.2021.724980.
- Lee J, d’Aigle J, Atadja L, Quaicoe V, Honarpisheh P, Ganesh BP, Hassan A, Graf J, Petrosino J, Putluri N. et al. Gut microbiota–derived short-chain fatty acids promote poststroke recovery in aged mice. Circ Res. 2020;127(4):453–465. doi:10.1161/CIRCRESAHA.119.316448.
- Louis P, Flint H. Formation of propionate and butyrate by the human colonic microbiota. Environ Microbiol. 2017;19(1):29–41. doi:10.1111/1462-2920.13589.
- Guo M, Li Z. Polysaccharides isolated from Nostoc commune Vaucher inhibit colitis-associated colon tumorigenesis in mice and modulate gut microbiota. Food Funct. 2019;10(10):6873–6881. doi:10.1039/C9FO00296K.
- Plovier H, Everard A, Druart C, Depommier C, Van Hul M, Geurts L, Chilloux J, Ottman N, Duparc T, Lichtenstein L. et al. A purified membrane protein from Akkermansia muciniphila or the pasteurized bacterium improves metabolism in obese and diabetic mice. Nat Med. 2017;23(1):107–113. doi:10.1038/nm.4236.
- Wang L, Tang L, Feng Y, Zhao S, Han M, Zhang C, Yuan G, Zhu J, Cao S, Wu Q. et al. A purified membrane protein from Akkermansia muciniphila or the pasteurised bacterium blunts colitis associated tumourigenesis by modulation of CD8+ T cells in mice. Gut. 2020;69(11):1988–1997. doi:10.1136/gutjnl-2019-320105.
- Zhao L, Zhang F, Ding X, Wu G, Lam YY, Wang X, Fu H, Xue X, Lu C, Ma J. et al. Gut bacteria selectively promoted by dietary fibers alleviate type 2 diabetes. Sci (New York, NY). 2018;359(6380):1151–1156. doi:10.1126/science.aao5774.
- Zheng D, Li R, An J, Xie T-Q, Han Z-Y, Xu R, Fang Y, Zhang X-Z. Prebiotics-Encapsulated Probiotic Spores Regulate Gut Microbiota and Suppress Colon Cancer. Adv Mater. 2020;32(45):e2004529. doi:10.1002/adma.202004529.
- Morrison D, Preston T. Formation of short chain fatty acids by the gut microbiota and their impact on human metabolism. Gut Microbes. 2016;7(3):189–200. doi:10.1080/19490976.2015.1134082.
- Zhao Y, Chen F, Wu W, Sun M, Bilotta AJ, Yao S, Xiao Y, Huang X, Eaves-Pyles TD, Golovko G. et al. GPR43 mediates microbiota metabolite SCFA regulation of antimicrobial peptide expression in intestinal epithelial cells via activation of mTOR and STAT3. Mucosal Immunol. 2018;11(3):752–762. doi:10.1038/mi.2017.118.
- Shao X, Sun S, Zhou Y, Wang H, Yu Y, Hu T, Yao Y, Zhou C. Bacteroides fragilis restricts colitis-associated cancer via negative regulation of the NLRP3 axis. Cancer Lett. 2021;523:170–181. doi:10.1016/j.canlet.2021.10.002.
- Donohoe DR, Holley D, Collins LB, Montgomery SA, Whitmore AC, Hillhouse A, Curry KP, Renner SW, Greenwalt A, Ryan EP. et al. A gnotobiotic mouse model demonstrates that dietary fiber protects against colorectal tumorigenesis in a microbiota- and butyrate-dependent manner. Cancer Discov. 2014;4(12):1387–97. doi:10.1158/2159-8290.CD-14-0501.
- Singh V, Yeoh B, Chassaing B, Xiao X, Saha P, Aguilera Olvera R, Lapek JD, Zhang L, Wang W-B, Hao S. et al. Dysregulated microbial fermentation of soluble fiber induces cholestatic liver cancer. Cell. 2018;175(3):679–694.e22. doi:10.1016/j.cell.2018.09.004.
- Chen D, Jin D, Huang S, Wu J, Xu M, Liu T, Dong W, Liu X, Wang S, Zhong W. et al. Clostridium butyricum, a butyrate-producing probiotic, inhibits intestinal tumor development through modulating Wnt signaling and gut microbiota. Cancer Lett. 2020;469:456–467. doi:10.1016/j.canlet.2019.11.019.
- Bachem A, Makhlouf C, Binger K, de Souza DP, Tull D, Hochheiser K, Whitney PG, Fernandez-Ruiz D, Dähling S, Kastenmüller W. et al. Microbiota-derived short-chain fatty acids promote the memory potential of antigen-activated CD8+ T cells. Immunity. 2019;51(2):285–297.e5. doi:10.1016/j.immuni.2019.06.002.
- Zolbetuximab Improves Survival in Gastric Cancer. Cancer discovery. Zolbetuximab improves survival in gastric cancer. Cancer Discov. 2023;13(3):520–521. doi:10.1158/2159-8290.CD-NB2023-0006.
- Sahin U, Türeci Ö, Manikhas G, Lordick F, Rusyn A, Vynnychenko I, Dudov A, Bazin I, Bondarenko I, Melichar B. et al. FAST: a randomised phase II study of zolbetuximab (IMAB362) plus EOX versus EOX alone for first-line treatment of advanced CLDN18.2-positive gastric and gastro-oesophageal adenocarcinoma. Ann Oncol. 2021;32(5):609–619. doi:10.1016/j.annonc.2021.02.005.
- Petrillo A, Smyth E, van Laarhoven H. Emerging targets in gastroesophageal adenocarcinoma: what the future looks like. Ther Adv Med Oncol. 2023;15:17588359231173177. doi:10.1177/17588359231173177.