
ABSTRACT
The fungal microbiota plays an important role in the pathogenesis of alcohol-associated liver disease (ALD) and nonalcoholic fatty liver disease (NAFLD). In this study, we aimed to compare changes of the fecal fungal microbiota between patients with ALD and NAFLD and to elucidate patterns in different disease stages between the two conditions. We analyzed fungal internal transcribed spacer 2 (ITS2) sequencing using fecal samples from a cohort of 48 patients with ALD, 78 patients with NAFLD, and 34 controls. The fungal microbiota differed significantly between ALD and NAFLD. The genera Saccharomyces, Kluyveromyces, Scopulariopsis, and the species Candida albicans (C. albicans), Malassezia restricta (M. restricta), Scopulariopsis cordiae (S. cordiae) were significantly increased in patients with ALD, whereas the genera Kazachstania and Mucor were significantly increased in the NAFLD cohort. We identified the fungal signature consisting of Scopulariopsis, Kluyveromyces, M. restricta, and Mucor to have the highest discriminative ability to detect ALD vs NAFLD with an area under the curve (AUC) of 0.93. When stratifying the ALD and NAFLD cohorts by fibrosis severity, the fungal signature with the highest AUC of 0.92 to distinguish ALD F0-F1 vs NAFLD F0-F1 comprised Scopulariopsis, Kluyveromyces, Mucor, M. restricta, and Kazachstania. For more advanced fibrosis stages (F2-F4), the fungal signature composed of Scopulariopsis, Kluyveromyces, Mucor, and M. restricta achieved the highest AUC of 0.99 to differentiate ALD from NAFLD. This is the first study to identify a fungal signature to differentiate two metabolic fatty liver diseases from each other, specifically ALD from NAFLD. This might have clinical utility in unclear cases and might hence help shape treatment approaches. However, larger studies are required to validate this fungal signature in other populations of ALD and NAFLD.
KEYWORDS:
Introduction
Alcohol-associated liver disease (ALD) and nonalcoholic fatty liver disease (NAFLD) are associated with significant morbidity and mortality and continue to become more common worldwide.Citation1–4 The prevalence of ALD is estimated to be 4.8% globally and that of NAFLD 30% globally.Citation1,Citation4 Better noninvasive biomarkers are required to more easily detect early and more advanced stages of liver disease.Citation5,Citation6 One noninvasive biomarker is the intestinal microbiota. The gut microbiota plays a role in many liver diseases, as evidenced by studies with germfree and conventional mice.Citation7 Specific bacterial signatures for the diagnosis of advanced fibrosis and cirrhosis were recently identified for NAFLD.Citation8,Citation9
We previously investigated the role of the fungal microbiome, or mycobiome, in ALDCitation10–12 and NAFLD.Citation13 Since a number of similar shifts of the fungal microbiome are associated with higher severity of both ALD and NAFLD, such as increased fecal proportions of Candida albicans (C. albicans),Citation10–13 we now aimed to compare the changes of the fungal microbiota between ALD and NAFLD and to elucidate patterns in different disease stages between the two conditions.
Material and methods
Patients
Our patient cohort and study design has been previously described in detail.Citation12–14 In brief, our cohort consisted of 34 control patients, 58 alcohol-associated liver disease (ALD) patients, and 78 nonalcoholic fatty liver disease (NAFLD) patients. All ALD patients were heavy drinkers consuming over 60 g of alcohol per day for more than 1 year and had associated liver disease as evidenced by serum aspartate aminotransferase (AST) level >40, alanine aminotransferase (ALT) level >40, controlled attenuation parameter (CAP) per FibroScan >250 dB/m (presence of steatosis further confirmed by Doppler ultrasound), liver stiffness measurement per FibroScan ≥7.6 kPa,Citation15 and/or serum caspase-cleaved and intact cytokeratin 18 (CK18-M65) ≥266.Citation16 Patients with alcohol use disorder (AUD) without evidence of ALD have been excluded for our analysis. The patients with ALD were prospectively enrolled at St. Luc University Hospital in Brussels, Belgium from April 2017 to January 2019, where they were admitted for a highly standardized and controlled 3-week detoxification and rehabilitation program, during which a FibroScan was performed, and a fasting blood sample was collected on the day of admission. Stool samples were obtained from the first bowl movement after admission. Exclusion criteria included use of antibiotics, probiotics, or prebiotics during the 2 months preceding enrollment, use of immunosuppressive medications, diabetes, inflammatory bowel disease, known liver disease of any other etiology, or clinically significant cardio-vascular, pulmonary, or renal co-morbidities, and age <18 y. NAFLD patients, diagnosed by the presence of steatosis in >5% of hepatocytes on liver biopsy or by clinical, laboratory, and imaging findings consistent with cirrhosis, were prospectively enrolled at the University Hospital of Cologne in Cologne, Germany from March 2015 to December 2018. Exclusion criteria included antibiotic use within 6 months prior to the study, known malignancy, pregnancy, and age <18 y. These subjects were compared with healthy volunteers enrolled in Cologne, Germany (n = 16) and Brussels, Belgium (n = 18), matched for gender, age, and body mass index (BMI), who drank less than 20 g of alcohol per day. Clinical, demographic and microbiota-related data from ALD patients and NAFLD patients have been reported upon in prior studies.Citation12–14
Ethics
The study protocol conforms to the ethical guidelines of the 1975 Declaration of Helsinki and was approved by the institution’s human research and ethical committee (Université Catholique de Louvain, Brussels, Belgium; B403201422657 and the local Ethics Committee at the University of Cologne, Germany; # 15–056), as previously described, and patients were enrolled after written informed consent was obtained.Citation12–14
Serum biomarkers
All blood samples were collected under fasting conditions. ALD patient blood samples were tested at the clinical laboratory associated with St. Luc University Hospital, Brussels, Belgium. NAFLD patient blood samples were tested at the University Hospital of Cologne, Germany.Citation12–14
Liver stiffness and steatosis measurement
Vibration-controlled transient elastography (FibroScan, Echosens, Paris, France) was performed in fasting patients by experienced operators, blinded to all clinical patient data. At least 10 valid measurements were performed, and the median value of these measurements was reported in kPa. Patients were first scanned with the M probe, and if indicated by the equipment, patients were rescanned with the XL probe, in accordance with the manufacturer’s protocol. Liver stiffness measurement cutoff of 7.6 kPa was used to discriminate mild fibrosis (stage F0-F1) from significant fibrosis (stage F2-F4) and controlled attenuation parameter cutoff of 250 dB/m was used for significant steatosis.Citation15,Citation17,Citation18
Fecal DNA extraction, fungal sequencing, and bioinformatic processing of ITS2 sequences
Internal transcribed spacer 2 (ITS2) sequencing data have been reported beforeCitation12,Citation13 and have been re-analyzed for this analysis. In brief, fecal DNA was extracted using the DNA fast stool mini kit (Qiagen, Hilden, Germany) according to the manufacturer’s protocol, as described.Citation12,Citation13,Citation19 Before DNA extraction, bead beating of fecal samples with lysis buffer was performed using 0.7 mm garnet PowerBead tubes (Qiagen, Hilden, Germany). Bead beating was performed using the BioSpec Mini-BeadBeater 96 for 2 × 30 seconds at 50 Hz. PCR and sequencing of the ITS2 genomic region was performed as previously described using the following primer pair (italics = overhang adapter sequence, bold = region-specific sequence): 5.8S-Fun (read 1) [TCGTCGGCAGCGTCAGATGTGTATAAGAGACAGAACTTTYRRCAAYGGATCWCT] and ITS4-Fun (read 2) [GTCTCGTGGGCTCGGAGATGTGTATAAGAGACAGGCCTCCGCTTATTGATATGCTTAART],Citation20 using Illumina’s Fungal Metagenomic Sequencing Demonstrated Protocol (https://support.illumina.com/downloads/fungal-metagenomic-sequencing-demonstrated-protocol-1000000064940.html). Amplification was performed using KAPA HiFi HotStart ReadyMix (Thermo Fisher Scientific, Waltham, USA). Illumina indices and sequencing adaptors were attached using the Nextera® XT v2 Index Kit following the Illumina ITS SOP. DNA from each sample was pooled into equimolar proportions and sequenced on an Illumina MiSeq platform (PE250) at the University of California, San Diego IGM Genomics Center.
CutAdapt v1.8.1Citation21 (cutadapt -a ^CCTCCGCTTATTGATATGCTTAART…AGWGATCCRTTGYYRAAAGTT – discard-untrimmed – minimum-length 50 -o trimR2_001.fastq.gz R2_001.fastq.gz) was used to trim amplicon reads of region-specific primer sequences and to discard short reads and reads lacking ITS target primer sequences. Species-level Operational taxonomic units (OTUs), clustered at 97% identity, were generated de novo from the adapter-trimmed reads using J. Craig Venter Institute’s (JCVI’s) pipeline adaptation of UPARSE (https://github.com/JCVenterInstitute/Uparse_16S_pipeline).Citation22–24 Briefly, trimmed R2 sequence reads (from ITS4-fun) were used as input. Sequences of low-quality were discarded and the remaining reads dereplicated prior to determination of abundances. Chimera filtering of the sequences was completed during clustering by the cluster_otus command within the UPARSE-OTU algorithm of USEARCH v8.1 (https://drive5.com/usearch/manual8.1/cmd_cluster_otus.html) while taxonomy was assigned to the OTUs with mothur v 1.36.1Citation25 using a customized subset of the UNITE fungal ITS databaseCitation26 as the reference (described below). OTUs and corresponding taxonomy assignment tables were generated and used in subsequent analyses. Downstream analyses (including principal coordinate analyses (PCoA) and predictive performance analyses of fungal markers for detecting ALD vs NAFLD based on relative abundance of fungal populations) were performed using the R statistical platform, as detailed below.Citation27
A custom ITS database was generated from the sh_refs_qiime_ver8_97_s_all_04.02.2020 version of the UNITE database that contained both full-length and partial matches to the ITS2 region at least 50 bp in length and only contained taxa known to be host-associated. This was accomplished by first extracting host-associated fungal taxa by selecting genus names matching those in the THF database v1.6.1.Citation28 Full and partial sequences at least 50 bp in length matching the ITS2 region were extracted by running the “host-associated” subset of the UNITE database through ITSx v1.1.2Citation29 using the command (ITSx -i sh_refs_qiime_ver8_97_s_all_04.02.2020.THF.fasta -o UNITE_THFdb – cpu 16 –multi_thread T – positions T – not_found T – detailed_results T – partial 49 –save_regions ITS2 –table T). Non-fungal populations detected by ITS2 primers were excluded from final figures. Only fungal populations that were detected in at least one sample in the ALD and the NALFD cohorts respectively were included in the analysis. Similarly, OTUs with less than 10 sequences in the study population were removed.
Data availability
Raw sequences from ITS2 gene sequencing were registered at NCBI under BioProjects PRJNA698272 (NAFLD cohort) and PRJNA703732 (ALD cohort).
Statistics
Two groups with continuous outcomes were compared using the Wilcoxon-Whitney-Mann rank-sum test. Three or more groups with continuous outcomes were compared using the Kruskal–Wallis test; if the Kruskal–Wallis test was statistically significant, a pairwise Wilcoxon-Whitney-Mann rank-sum test was performed with Holm correction. Results with continuous outcomes are expressed as median, and upper and lower quartiles in brackets, if not stated otherwise. Categorical variables were compared using the Pearson’s Chi-squared test and results are expressed as number and percentage, if not stated otherwise. All statistical tests were two-sided. A p value equal to or less than 0.05 was considered statistically significant, uncorrected for two groups and corrected after Holm adjustment for multiplicity for three or more groups. The fungal sequence reads were normalized to obtain the proportional, relative abundance of each fungus in each patient for further statistical analysis. Fungal diversity markers Shannon index and inverse Simpson index were calculated using the “phyloseq” package in R.Citation30 To calculate and visualize ß-diversity, we used principal coordinate analyses (PCoA) based on the Jaccard and Bray-Curtis dissimilarity matrices and p values were determined by nonparametric multivariate analysis of variance (MANOVA). Linear discriminant analysis (LDA) effect size (LEfSe) was used to identify fungal genera and species whose relative abundances differed significantly by at least 2.0 on the logarithmic LDA score between groups.Citation31 Area under the curve (AUC), best threshold to maximize the Youden index, sensitivity, specificity, accuracy, positive predictive value, negative predictive value, and p value between two AUCs of receiver operating characteristic (ROC) curves per DeLong method were calculated using the pROC library in R; and to identify fungal genera and species with the highest feature importance for detecting ALD cohorts vs NAFLD cohorts, the mean decrease accuracy was calculated with the randomForest library in R, as described.Citation32,Citation33 Statistical analysis was performed using R statistical software, R version 1.3.1093 for Mac, 2020 the R Foundation for Statistical Computing.
Results
Study population with alcohol-associated liver disease (ALD) and nonalcoholic fatty liver disease (NAFLD)
The study population consisted of 58 patients with ALD, 78 patients with NAFLD, and 34 control subjects (). Both liver disease groups had significantly higher age and body mass index (BMI) medians than controls, with the NAFLD patients having a significantly higher age and BMI median than the ALD patients (NAFLD 55.6 y vs ALD 43.5 y vs controls 33.5 y as well as NAFLD 30.1 kg/m2 vs ALD 24.2 kg/m2 vs controls 21.1 kg/m2). The liver disease markers aspartate aminotransferase (AST), alanine aminotransferase (ALT), gamma-glutamyltransferase (GGT), alkaline phosphatase (AP), total bilirubin levels and the steatosis marker controlled attenuation parameter (CAP) and liver stiffness per FibroScan were higher in the ALD and NAFLD cohorts compared with controls, respectively (all comparisons were significant, except bilirubin and liver stiffness only had a trend for control vs ALD). Of all liver laboratory and imaging markers, only AST and albumin were significantly higher in the ALD cohort vs the NAFLD cohort (53.5 IU/L vs 35.0 IU/L and 4.6 g/L vs 4.4 g/L, respectively) ().
*post-hoc p values.
Table 1. Baseline demographic and laboratory data of the study population.
The fungal microbiome is different in patients with ALD from NAFLD patients
The intestinal mycobiome of controls from the ALD cohort was not significantly different from controls from the NAFLD cohort per principal coordinate analysis (PCoA, n = 18 vs n = 16, p = 0.116, not shown). We therefore combined both control groups (n = 34, ). When comparing all 3 groups, there was a significant difference per nonparametric multivariate analysis of variance (MANOVA) using the Jaccard index (p = 0.029) (). The p value was 0.059 per Bray-Curtis dissimilarity. The fungal microbiome was significantly different between the ALD and NAFLD cohorts per Jaccard index (p = 0.026) (). The p value between ALD and NAFLD was 0.068 per Bray-Curtis dissimilarity. Furthermore, alpha diversity markers were different between the groups: The p value per Kruskal–Wallis test was 0.065 between the three groups for the Shannon Index. The Shannon Index was lower in the ALD cohort vs the NAFLD cohort (unadjusted p = 0.036, adjusted p = 0.11) (Supplementary Figure S1a). The inverse Simpson Index was significantly decreased in the ALD cohort vs the NAFLD cohort (adjusted p = 0.048) (Supplementary Figure S1b).
Figure 1. The intestinal fungal microbiome differs significantly between patients with ALD and NAFLD.
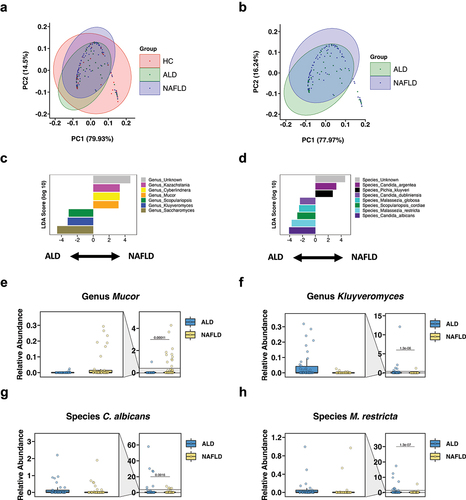
We then performed linear discriminant analysis (LDA) effect size (or LEfSe)Citation31 to identify which fungal genera and species were significantly different between the ALD and NAFLD cohorts. The genera Saccharomyces, Kluyveromyces, and Scopulariopsis were significantly increased in patients with ALD, whereas unidentified genera, Kazachstania, Cyberlindnera, and Mucor were significantly increased in the NAFLD cohort (). Similarly, the ALD group had significantly increased fungal species including Candida albicans (C. albicans), Malassezia restricta (M. restricta), Scopulariopsis cordiae (S. cordiae), M. globosa, and C. dubliniensis, while subjects with NAFLD had increased unknown species, C. argentea, and Pichia kluyveri (). Likewise, the relative abundance of the genus Mucor was low and that of Kluyveromyces elevated in the ALD group compared with the NAFLD group (). The relative abundances of the species C. albicans and M. restricta were significantly increased in the ALD cohort in relation to NAFLD ().
A fungal signature differentiates ALD from NAFLD
To identify fungal genera and species with the highest feature importance for detecting ALD vs NAFLD, we determined the mean decrease accuracy per random forest analysis, as described before.Citation32,Citation33 Among the top genera differentiating ALD from NAFLD were Scopularopsis, Kluyveromyces, unidentified genera, Mucor, Saccharomyces, and Kazachstania (). Among the fungal species with the highest feature importance for detecting ALD vs NAFLD were S. cordiae, M. restricta, unknown species, S. cerevisiae, and C. albicans (). In a second step, we determined their discriminative value for ALD vs NAFLD (). The highest area under the curve (AUC) value for single fungal predictors were 0.70 for M. restricta, 0.68 for Scopulariopsis and S. cordiae, and 0.67 for Kluveromyces (). We then compared various combinations of the fungal markers with the highest AUC values in order to maximize the discriminative ability for ALD vs NAFLD. We identified the fungal signature consisting of Scopulariopsis, Kluyveromyces, M. restricta, and Mucor to have the highest discriminative ability with an excellent AUC of 0.93, which was significantly better per DeLong test than the AUC of 0.89 for the fungal signature comprising Scopulariopsis, Kluyveromyces, and M. restricta, p = 0.038 (, ). The sensitivity, specificity, accuracy, positive, and negative predictive value (PPV and NPV) for this fungal signature consisting of Scopulariopsis, Kluyveromyces, M. restricta, and Mucor were 0.91, 0.91, 0.91, 0.88, and 0.93, respectively ().
Figure 2. A fungal signature differentiates ALD from NAFLD.
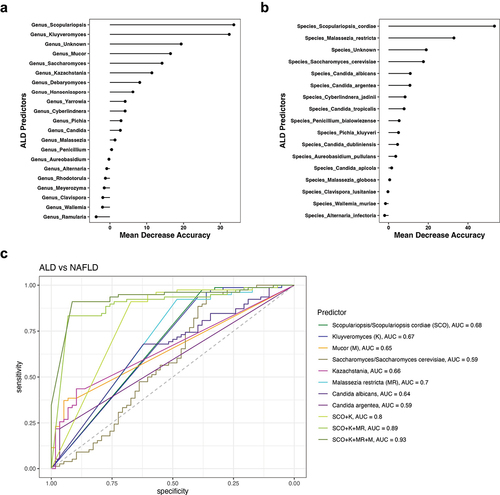
Table 2. ALD vs NAFLD predictors.
Fungal subpopulations distinguish ALD and NAFLD with no or mild fibrosis
We then stratified the ALD and NAFLD cohorts by fibrosis severity into fibrosis stages F0-F1 and F2-F4 in order to evaluate whether the fungal genera and species differ already significantly with no or mild fibrosis and whether the fungal differences are even more pronounced between ALD and NAFLD with more significant fibrosis. The demographic and laboratory data for each stratum is shown in . As expected, the BMIs were significantly higher in both F0-F1 and F2-F4 NAFLD cohorts relative to their respective ALD counterparts. The AST levels were significantly higher in the ALD F0-F1 group vs the NAFLD F0-F1 group. The AST and GGT levels were significantly higher in the ALD F2-F4 vs the NAFLD F2-F4 cohorts ().
*post-hoc p values.
Table 3. Baseline demographic and laboratory data of the study population stratified by fibrosis severity.
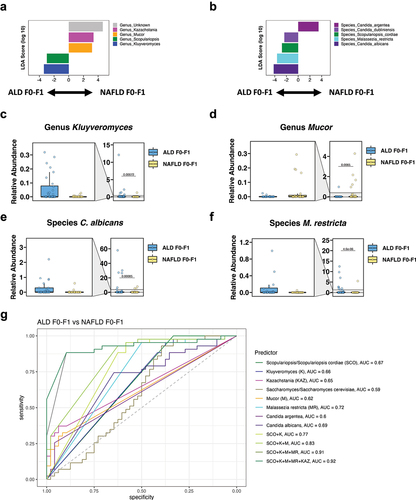
When comparing the cohorts with no or mild fibrosis, the ALD F0-F1 had significantly increased fungal genera Kluyveromyces and Scopulariopsis and significantly decreased unknown genera, Kazachstania, and Mucor compared with NAFLD F0-F1 per LEfSe (). Additionally, C. albicans, C. dubliniensis, M. restricta, and S. cordiae were significantly enriched and C. argentea was significantly reduced in the ALD F0-F1 vs the NAFLD F0-F1 groups per LEfSe (). Consistent with these results, the fecal relative abundance of Kluyveromyces, C. albicans, and M. restricta was significantly increased in the ALD F0-F1 cohort, whereas the fecal relative abundance of Mucor was significantly decreased in the ALD F0-F1 cohort compared with the NAFLD F0-F1 cohort (). The fungal genera and species with the highest feature importance for detecting ALD F0-F1 vs NAFLD F0-F1 as expressed as the highest mean decrease accuracy per random forest analysis were Scopulariopsis, Kluyveromyces, Kazachstania, Saccharomyces, and Mucor as well as S. cordiae, M. restricta, C. argentea, S. cerevisiae, and C. albicans (Supplementary Figure S2a-b). Finally, we determined their discriminative value for ALD F0-F1 vs NAFLD F0-F1 (). The highest AUC for single fungal predictors were 0.72 for M. restricta, 0.69 for C. albicans, and 0.67 for Scopulariopsis and S. cordiae. The fungal signature with the highest AUC of 0.92 to discriminate ALD F0-F1 from NAFLD F0-F1 comprised Scopulariopsis, Kluyveromyces, Mucor, M. restricta, and Kazachstania ().
Figure 3. Fungal subpopulations distinguish ALD and NAFLD with no or mild fibrosis.
A fungal signature differentiates ALD from NAFLD with significant fibrosis
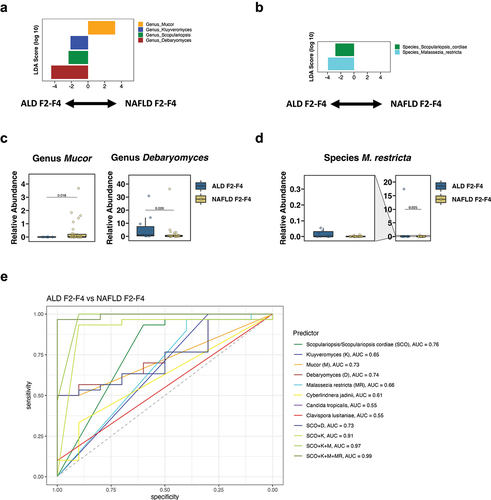
We next compared both liver disease cohorts with significant fibrosis. The ALD F2-F4 had significantly enriched fungal genera Debaryomyces, Scopulariopsis, and Kluyveromyces and significantly decreased Mucor compared with NAFLD F2-F4 per LEfSe (). Moreover, M. restricta, and S. cordiae were significantly increased in the ALD F2-F4 vs the NAFLD F2-F4 groups per LEfSe (). Likewise, the fecal relative abundances of Debaryomyces and M. restricta were significantly increased in the ALD F2-F4 cohort, whereas the fecal relative abundance of Mucor was significantly decreased in the ALD F2-F4 cohort compared with the NAFLD F2-F4 cohort (). The fungal genera and species with the highest feature importance for identifying ALD F2-F4 vs NAFLD F2-F4 per mean decrease accuracy were Scopulariopsis, Kluyveromyces, Mucor, and Debaryomyces as well as S. cordiae, M. restricta, and Cyberlindera jadinii (Supplementary Figure S2c-d). Lastly, we determined their discriminative value for ALD F2-F4 vs NAFLD F2-F4 (). The highest AUC for single fungal predictors were 0.76 for Scopulariopsis and S. cordiae, 0.74 for Debaryomyces, and 0.73 for Mucor. The fungal signature with the highest AUC of 0.99 to identify ALD F2-F4 vs NAFLD F2-F4 included Scopulariopsis, Kluyveromyces, Mucor, and M. restricta ().
Figure 4. A fungal signature differentiates ALD from NAFLD with significant fibrosis.
Discussion
Here, we report that the fungal microbiota differs significantly between ALD and NAFLD. Importantly, a specific fungal signature comprising Scopulariopsis, Kluyveromyces, Mucor, and M. restricta (with or without Kazachstania) can differentiate ALD from NAFLD in general as well as stratified by fibrosis severity with an excellent discriminative ability (AUC > 0.9). A bacterial microbiome signature for the diagnosis of advanced fibrosis and cirrhosis has been identified for NAFLD previously.Citation8,Citation9 However, this current study is the first to report a fungal signature in liver disease.
We have previously investigated the fungal microbiome in ALDCitation11,Citation12 and NAFLDCitation13 separately, and found that the relative abundance of C. albicans correlated with disease severity in both ALD and NAFLD. We found that fecal proportions of C. albicans, Mucor species, Pichia barkeri, and Cyberlindnera jadinii are significantly higher in patients with nonalcoholic steatohepatitis (NASH) vs nonalcoholic fatty liver and also higher in patients with NAFLD and fibrosis stages F2-F4 vs patients with NAFLD and fibrosis stages F0-F1.Citation13 Further, plasma anti-C. albicans immunoglobulin G levels are significantly higher in patients with NAFLD and advanced fibrosis vs patients with NAFLD and no, mild, or moderate fibrosis only or healthy controls.Citation13 Of note, we trialed a non-absorbable antifungal (amphotericin B) orally in a 20-week long western diet experiment in a prior study, and found that amphotericin B improves liver cell injury per ALT levels, hepatic triglycerides, liver inflammation and fibrosis in experimental diet-induced steatohepatitis in mice.Citation13 Antifungal therapy could hence represent an attractive new therapy in NAFLD. Similarly, the relative abundance of C. albicans correlates with disease severity in ALD and is especially high in alcohol-associated hepatitis, and the level of anti–S. cerevisiae IgG antibodies (ASCA) – that C. albicans is an important immunogen for – predicts survival in alcohol-associated hepatitis.Citation10–12 Likewise, use of antifungals improves experimental ethanol-induced steatohepatitis as well.Citation10
In the current study, C. albicans was increased in the entire ALD and the ALD F0-F1 cohorts compared with the entire NAFLD and the NAFLD F0-F1 cohorts, respectively, but we did not find a significant difference between both F2-F4 cohorts. This finding could be secondary to a type II error given a lower number of patients with ALD F2-F4 (n = 10).Citation34 Of note, C. albicans did not significantly improve the discriminative ability to distinguish ALD from NAFLD, nor when stratified by fibrosis severity.
Interestingly, the fungal signature can differentiate ALD from NAFLD already in early stages when no or only mild fibrosis is present. This means that fungal dysbiosis – or an imbalance of beneficial and potentially pathogenic microbes/fungiCitation19,Citation35 – is already present in early disease stages and specific for ALD and NAFLD. It is well known that diet shapes the bacterialCitation36 and fungal microbiome.Citation37 Fecal proportions of C. albicans are significantly higher in patients with ALD compared with control subjects.Citation11,Citation12 Intriguingly, only 2 weeks of alcohol abstinence significantly decrease the relative abundance of C. albicans but also that of Kluyveromyces and M. restricta in patients with alcohol use disorder,Citation12 indicating that alcohol as part of the diet molds the fungal microbiota. Similarly, vegetarian or animal-based diets affect the fungal microbiome structure as well.Citation38 However, although diet impacts the microbiota, the identified fungal signature consisting of Scopulariopsis, Kluyveromyces, Mucor, and M. restricta actually has a significantly better discriminative ability for ALD F2-F4 vs NAFLD F2-F4 than for ALD F0-F1 vs NAFLD F0-F1 (AUC = 0.99 vs AUC = 0.91), indicating that the disease-specific fungal structure is more solidified in more advanced disease stages than in earlier stages.
Previously, bacterial signatures have been identified for NAFLD and ALD. Advanced fibrosis in NAFLD has been associated with significantly lower proportions of Firmicutes, Ruminococcus obeum, Eubacterium rectale, and Faecalibacterium prausnitzii vs mild-to-moderate fibrosis, whereas Proteobacteria were more numerous.Citation8 NAFLD-cirrhosis is associated with an increased fecal relative abundance of Enterobacteriaceae, Veillonella parvula, Veillonella atypica, Ruminococcus gnavus, Clostridium bolteae and Acidaminococcus sp. D21 and a reduced relative abundance of Catenibacterium compared with controls, and lower Peptostreptococcaceae than patients with NAFLD but without advanced fibrosis.Citation9,Citation39 On the other hand, common fecal signatures of alcohol-associated hepatitis include increased Bacilli, Lactobacillales, Veillonella, and decreased Bacteroides, Akkermansia, Eubacterium, Oscillibacter and Clostridiales compared with healthy controls.Citation40,Citation41 Patients with alcohol use disorder also have decreased Akkermansia compared with controls but increased Bacteroides.Citation42 Enterococcus faecalis and presence of its secreted protein cytolysin predict disease severity and mortality in alcohol-associated hepatitis.Citation43
Further, it is important to note that the gut microbiota plays a central role in maintaining liver homeostasis, but it can also function as a reservoir of pathobionts and their products that can contribute to the pathogenesis of ALD and NAFLD. There is a bidirectional crosstalk between the intestine and the liver, which involves multiple molecules and products including nutrients, microbial antigens, metabolites, and bile acids, regulating metabolism and immune responses, thereby controlling gastrointestinal health and liver diseases.Citation44–46
In conclusion, this is the first study to identify a fungal signature to differentiate two fatty liver diseases from each other, specifically ALD from NAFLD. This might have clinical utility in unclear cases, as liver histology is oftentimes very similar in both conditions, and might hence help modify treatment approaches. However, larger clinical studies are required to validate this fungal signature in other populations of ALD and NAFLD.
Abbreviations
| ALD | = | alcohol-associated liver disease |
| ALT | = | alanine aminotransferase |
| AP | = | alkaline phosphatase |
| AST | = | aspartate aminotransferase |
| AUC | = | area under the curve |
| BMI | = | body mass index |
| CAP | = | controlled attenuation parameter |
| GGT | = | gamma-glutamyltransferase |
| INR | = | international normalized ratio |
| ITS | = | Internal transcribed spacer 2 |
| K | = | Kluyveromyces |
| KAZ | = | Kazachstania |
| LDA | = | Linear discriminant analysis |
| LEfSe | = | LDA effect size |
| M | = | Mucor |
| MANOVA | = | multivariate analysis of variance |
| MR | = | Malassezia restricta |
| NAFLD | = | nonalcoholic fatty liver disease |
| NPV | = | negative predictive value |
| PCoA | = | Principal coordinate analysis |
| PPV | = | positive predictive value |
| ROC | = | receiver operating characteristic |
| SCO | = | Scopulariopsis/S. cordiae. |
Author contributions
G.V. was responsible for data analysis, and writing and editing the manuscript; P.H. was responsible for data analysis, and writing and editing the manuscript; S.L. was responsible for collection and processing of fecal samples, data analysis, data interpretation and drafting of the manuscript; M.D. was responsible for collection of samples, data collection, interpretation of data and editing the manuscript; X.Z. provided assistance with statistical analysis; D.E.F. was responsible for bioinformatical analysis, interpretation of data and edited the manuscript; P.S. was responsible for collection of samples with alcohol use disorder and edited the manuscript; B.S. was responsible for study concept and design, interpretation of data, editing the manuscript, and study supervision.
Fungal signature differentiates Suppl Figures_R1.docx
Download MS Word (849.6 KB)Fungal signature differentiates ALD from NAFLD Suppl Material_R1.docx
Download MS Word (19.5 KB)Fungal signature differentiates Suppl Material_R1.docx
Download MS Word (19.5 KB)Acknowledgments
This work was supported by National Institutes of Health (NIH) grant K12 HD85036, University of California San Diego Altman Clinical and Translational Research Institute (ACTRI)/NIH grant KL2TR001444, and Pinnacle Research Award in Liver Diseases Grant #PNC22-159963 from the American Association for the Study of Liver Diseases (AASLD) Foundation, and Pilot/Feasibility Grant P30 DK120515 from the San Diego Digestive Diseases Research Center (SDDRC) (to P.H.), by a DFG fellowship (LA 4286/1-1) and the “Clinical and Translational Research Fellowship in Liver Disease” by the AASLD Foundation (to S.L.), by the “Marga und Walter Boll-Stiftung”, project number 210-03-2016, and the “Köln Fortune” research pool, Faculty of Medicine, University of Cologne, Germany, project number 160/2014 (to M.D.), by grants from the Fond National de Recherche Scientifique Belgium (J.0146.17 and T.0217.18) and Action de recherche concertée (ARC), Université Catholique de Louvain, Belgium (to P.S.), in part by NIH grants R01 AA024726, R01 AA020703, U01 AA026939, U01 AA026939-04S1, by Award Number B×004594 from the Biomedical Laboratory Research & Development Service of the VA Office of Research and Development (to B.S.) and services provided by NIH centers P30 DK120515 and P50 AA011999.
Disclosure statement
B.S. has been consulting for Ferring Research Institute, HOST Therabiomics, Intercept Pharmaceuticals, Mabwell Therapeutics, Patara Pharmaceuticals, Surrozen and Takeda. B.S.’s institution UC San Diego has received research support from Axial Biotherapeutics, BiomX, ChromoLogic, CymaBay Therapeutics, NGM Biopharmaceuticals, Prodigy Biotech and Synlogic Operating Company. B.S. is founder of Nterica Bio. UC San Diego has filed several patents with S.L. and B.S. as inventors related to this work.
Supplemental material
Supplemental data for this article can be accessed online at https://doi.org/10.1080/19490976.2024.2307586
Additional information
Funding
References
- Niu X, Zhu L, Xu Y, Zhang M, Hao Y, Ma L, Li Y, Xing H. Global prevalence, incidence, and outcomes of alcohol related liver diseases: a systematic review and meta-analysis. BMC Public Health. 2023;23(1):859. doi:10.1186/s12889-023-15749-x.
- Huang DQ, Mathurin P, Cortez-Pinto H, Loomba R. Global epidemiology of alcohol-associated cirrhosis and HCC: trends, projections and risk factors. Nat Rev Gastroenterol Hepatol. 2023;20(1):37–15. doi:10.1038/s41575-022-00688-6.
- Hartmann P, Zhang X, Loomba R, Schnabl B. Global and national prevalence of nonalcoholic fatty liver disease in adolescents: an analysis of the global burden of disease study 2019. Hepatology. 2023;78(4):1168–1181. doi:10.1097/HEP.0000000000000383.
- Younossi ZM, Golabi P, Paik JM, Henry A, Van Dongen C, Henry L. The global epidemiology of nonalcoholic fatty liver disease (NAFLD) and nonalcoholic steatohepatitis (NASH): a systematic review. Hepatology. 2023;77(4):1335–47. doi:10.1097/HEP.0000000000000004.
- Ginès P, Castera L, Lammert F, Graupera I, Serra-Burriel M, Allen AM, Wong VWS, Hartmann P, Thiele M, Caballeria L. et al. Population screening for liver fibrosis: toward early diagnosis and intervention for chronic liver diseases. Hepatology. 2022;75(1):219–228. doi:10.1002/hep.32163.
- Jayasekera D, Hartmann P. Noninvasive biomarkers in pediatric nonalcoholic fatty liver disease. World J Hepatol. 2023;15(5):609–40. doi:10.4254/wjh.v15.i5.609.
- Hartmann P, Chu H, Duan Y, Schnabl B. Gut microbiota in liver disease: too much is harmful, nothing at all is not helpful either. Am J Physiol Gastrointest Liver Physiol. 2019;316(5):G563–G73. doi:10.1152/ajpgi.00370.2018.
- Loomba R, Seguritan V, Li W, Long T, Klitgord N, Bhatt A, Dulai PS, Caussy C, Bettencourt R, Highlander SK. et al. Gut microbiome-based metagenomic signature for non-invasive detection of advanced fibrosis in human nonalcoholic fatty liver disease. Cell Metab. 2017;25(5):1054–62.e5. doi:10.1016/j.cmet.2017.04.001.
- Caussy C, Tripathi A, Humphrey G, Bassirian S, Singh S, Faulkner C, Bettencourt R, Rizo E, Richards L, Xu ZZ. et al. A gut microbiome signature for cirrhosis due to nonalcoholic fatty liver disease. Nat Commun. 2019;10(1):1406. doi:10.1038/s41467-019-09455-9.
- Yang AM, Inamine T, Hochrath K, Chen P, Wang L, Llorente C, Bluemel S, Hartmann P, Xu J, Koyama Y. et al. Intestinal fungi contribute to development of alcoholic liver disease. J Clin Invest. 2017;127(7):2829–41. doi:10.1172/JCI90562.
- Lang S, Duan Y, Liu J, Torralba MG, Kuelbs C, Ventura-Cots M, Abraldes JG, Bosques‐Padilla F, Verna EC, Brown RS. et al. Intestinal fungal dysbiosis and systemic immune response to fungi in patients with alcoholic hepatitis. Hepatology. 2020;71(2):522–38. doi:10.1002/hep.30832.
- Hartmann P, Lang S, Zeng S, Duan Y, Zhang X, Wang Y, Bondareva M, Kruglov A, Fouts, DE, Stärkel P. et al. Dynamic changes of the fungal microbiome in alcohol use disorder. Front Physiol. 2021;12:699253. doi:10.3389/fphys.2021.699253.
- Demir M, Lang S, Hartmann P, Duan Y, Martin A, Miyamoto Y, Bondareva M, Zhang X, Wang Y, Kasper P. et al. The fecal mycobiome in non-alcoholic fatty liver disease. J Hepatol. 2022;76(4):788–99. doi:10.1016/j.jhep.2021.11.029.
- Hsu CL, Lang S, Demir M, Fouts DE, Stärkel P, Schnabl B. Any alcohol use in NAFLD patients is associated with significant changes to the intestinal virome. Hepatology. 2023;77(6):2073–83. doi:10.1097/HEP.0000000000000238.
- Maccioni L, Gao B, Leclercq S, Pirlot B, Horsmans Y, De Timary P, Leclercq I, Fouts D, Schnabl B, Stärkel P. et al. Intestinal permeability, microbial translocation, changes in duodenal and fecal microbiota, and their associations with alcoholic liver disease progression in humans. Gut Microbes. 2020;12(1):1782157. doi:10.1080/19490976.2020.1782157.
- Maccioni L, Horsmans Y, Leclercq I, Schnabl B, Stärkel P. Serum keratin 18-M65 levels detect progressive forms of alcohol-associated liver disease in early noncirrhotic stages. Alcohol (Hanover). 2023;47(6):1079–1087. doi:10.1111/acer.15081.
- Naveau S, Lamouri K, Pourcher G, Njiké-Nakseu M, Ferretti S, Courie R, Tranchart H, Ghinoiu M, Balian A, Prévot S. et al. The diagnostic accuracy of transient elastography for the diagnosis of liver fibrosis in bariatric surgery candidates with suspected NAFLD. Obes Surg. 2014;24(10):1693–701. doi:10.1007/s11695-014-1235-9.
- Yang X, Chang X, Wu S, Sun X, Zhu X, Wang L, Xu Y, Yao X, Rao S, Hu X. et al. Performance of liver stiffness measurements obtained with FibroScan is affected by glucose metabolism in patients with nonalcoholic fatty liver disease. Lipids Health Dis. 2021;20(1):27. doi:10.1186/s12944-021-01453-5.
- Hartmann P, Schnabl B. New developments in microbiome in alcohol-associated and nonalcoholic fatty liver disease. Semin Liver Dis. 2021;41(1):87–102. doi:10.1055/s-0040-1719174.
- Taylor DL, Walters WA, Lennon NJ, Bochicchio J, Krohn A, Caporaso JG, Pennanen T. Accurate estimation of fungal diversity and abundance through improved lineage-specific primers optimized for Illumina Amplicon sequencing. Appl Environ Microb. 2016;82(24):7217–7226. doi:10.1128/AEM.02576-16.
- Martin M. Cutadapt removes adapter sequences from high-throughput sequencing reads. EMBnet J. 2011;17(1):3. doi:10.14806/ej.17.1.200.
- Edgar RC. UPARSE: highly accurate OTU sequences from microbial amplicon reads. Nat Methods. 2013;10(10):996–8. doi:10.1038/nmeth.2604.
- Freire M, Moustafa A, Harkins DM, Torralba MG, Zhang Y, Leong P, Saffery R, Bockmann M, Kuelbs C, Hughes T. et al. Longitudinal study of oral microbiome variation in twins. Sci Rep. 2020;10(1):7954. doi:10.1038/s41598-020-64747-1.
- Singh H, Torralba MG, Moncera KJ, DiLello L, Petrini J, Nelson KE, Pieper R. Gastro-intestinal and oral microbiome signatures associated with healthy aging. Geroscience. 2019;41(6):907–921. doi:10.1007/s11357-019-00098-8.
- Schloss PD, Westcott SL, Ryabin T, Hall JR, Hartmann M, Hollister EB, Lesniewski RA, Oakley BB, Parks DH, Robinson CJ. et al. Introducing mothur: open-source, platform-independent, community-supported software for describing and comparing microbial communities. Appl Environ Microb. 2009;75(23):7537–41. doi:10.1128/AEM.01541-09.
- Nilsson RH, Larsson KH, Taylor AFS, Bengtsson-Palme J, Jeppesen TS, Schigel D, Kennedy P, Picard K, Glöckner FO, Tedersoo L. et al. The UNITE database for molecular identification of fungi: handling dark taxa and parallel taxonomic classifications. Nucleic Acids Res. 2019;47(D1):D259–D264. doi:10.1093/nar/gky1022.
- R Core Team. R: a language and environment for statistical computing. Vienna, Austria: R Foundation for Statistical Computing; 2018. http://www.R-project.org/.
- Tang J, Iliev ID, Brown J, Underhill DM, Funari VA. Mycobiome: approaches to analysis of intestinal fungi. J Immunol Methods. 2015;421:112–121. doi:10.1016/j.jim.2015.04.004.
- Bengtsson-Palme J, Ryberg M, Hartmann M, Branco S, Wang Z, Godhe A, De Wit P, Sánchez‐García M, Ebersberger I, de Sousa F. et al. Improved software detection and extraction of ITS1 and ITS2 from ribosomal ITS sequences of fungi and other eukaryotes for analysis of environmental sequencing data. Methods Ecol Evol. 2013;4(10):914–919. doi:10.1111/2041-210X.12073.
- McMurdie PJ, Holmes S. Phyloseq: an R package for reproducible interactive analysis and graphics of microbiome census data. PloS ONE. 2013;8(4):e61217. doi:10.1371/journal.pone.0061217.
- Segata N, Izard J, Waldron L, Gevers D, Miropolsky L, Garrett WS, Huttenhower C. Metagenomic biomarker discovery and explanation. Genome Biol. 2011;12(6):R60. doi:10.1186/gb-2011-12-6-r60.
- Cabré N, Hartmann P, Llorente C, Kouno T, Wang Y, Zeng S, Kim HY, Zhang X, Kisseleva T, Iyer S. et al. IgY antibodies against cytolysin reduce ethanol-induced liver disease in mice. Hepatology. 2023;78(1):295–306. doi:10.1097/HEP.0000000000000324.
- Hartmann P, Lang S, Schierwagen R, Klein S, Praktiknjo M, Trebicka J, Schnabl B. Fecal cytolysin does not predict disease severity in acutely decompensated cirrhosis and acute-on-chronic liver failure. Hepatobiliary Pancreat Dis Int. 2023;22(5):474–481. doi:10.1016/j.hbpd.2023.05.003.
- Zhang X, Hartmann P. How to calculate sample size in animal and human studies. Front Med. 2023;10:1215927. doi:10.3389/fmed.2023.1215927.
- Hartmann P, Schnabl B. Risk factors for progression of and treatment options for NAFLD in children. Clin Liver Dis (Hoboken). 2018;11(1):11–5. doi:10.1002/cld.685.
- Kaufmann B, Seyfried N, Hartmann D, Hartmann P. Probiotics, prebiotics, and synbiotics in nonalcoholic fatty liver disease and alcohol-associated liver disease. Am J Physiol Gastrointest Liver Physiol. 2023;325(1):G42–G61. doi:10.1152/ajpgi.00017.2023.
- Hartmann P, Schnabl B. Fungal infections and the fungal microbiome in hepatobiliary disorders. J Hepatol. 2023;78:836–851. doi:10.1016/j.jhep.2022.12.006.
- David LA, Maurice CF, Carmody RN, Gootenberg DB, Button JE, Wolfe BE, Ling AV, Devlin AS, Varma Y, Fischbach MA. et al. Diet rapidly and reproducibly alters the human gut microbiome. Nature. 2014;505(7484):559–63. doi:10.1038/nature12820.
- Oh TG, Kim SM, Caussy C, Fu T, Guo J, Bassirian S, Singh S, Madamba EV, Bettencourt R, Richards L. et al. A Universal Gut-Microbiome-Derived Signature Predicts Cirrhosis. Cell Metab. 2020;32(5):878–88.e6. doi:10.1016/j.cmet.2020.06.005.
- Kim SS, Eun JW, Cho HJ, Song DS, Kim CW, Kim YS, Lee SW, Kim Y-K, Yang J, Choi J. et al. Microbiome as a potential diagnostic and predictive biomarker in severe alcoholic hepatitis. Aliment Pharmacol Ther. 2021;53(4):540–51. doi:10.1111/apt.16200.
- Lang S, Fairfied B, Gao B, Duan Y, Zhang X, Fouts DE, Schnabl B. Changes in the fecal bacterial microbiota associated with disease severity in alcoholic hepatitis patients. Gut Microbes. 2020;12(1):1785251. doi:10.1080/19490976.2020.1785251.
- Addolorato G, Ponziani FR, Dionisi T, Mosoni C, Vassallo GA, Sestito L, Petito V, Picca A, Marzetti E, Tarli C. et al. Gut microbiota compositional and functional fingerprint in patients with alcohol use disorder and alcohol-associated liver disease. Liver Int. 2020;40(4):878–88. doi:10.1111/liv.14383.
- Duan Y, Llorente C, Lang S, Brandl K, Chu H, Jiang L, White RC, Clarke TH, Nguyen K, Torralba M. et al. Bacteriophage targeting of gut bacterium attenuates alcoholic liver disease. Nature. 2019;575(7783):505–11. doi:10.1038/s41586-019-1742-x.
- Lang S, Schnabl B. Microbiota and fatty liver disease—the known, the unknown, and the future. Cell Host & Microbe. 2020;28(2):233–244. doi:10.1016/j.chom.2020.07.007.
- Tilg H, Adolph TE, Trauner M. Gut-liver axis: pathophysiological concepts and clinical implications. Cell Metab. 2022;34(11):1700–1718. doi:10.1016/j.cmet.2022.09.017.
- Bajaj JS, Khoruts A. Microbiota changes and intestinal microbiota transplantation in liver diseases and cirrhosis. J Hepatol. 2020;72(5):1003–27. doi:10.1016/j.jhep.2020.01.017.