
 ?Mathematical formulae have been encoded as MathML and are displayed in this HTML version using MathJax in order to improve their display. Uncheck the box to turn MathJax off. This feature requires Javascript. Click on a formula to zoom.
ABSTRACT
Up to 40% of transplant recipients treated long-term with tacrolimus (TAC) develop post-transplant diabetes mellitus (PTDM). TAC is an important risk factor for PTDM, but is also essential for immunosuppression after transplantation. Long-term TAC treatment alters the gut microbiome, but the mechanisms of TAC-induced gut microbiota in the pathogenesis of PTDM are poorly characterized. Here, we showed that vancomycin, an inhibitor of bacterial beta-glucuronidase (GUS), prevents TAC-induced glucose disorder and insulin resistance in mice. Metagenomics shows that GUS-producing bacteria are predominant and flourish in the TAC-induced hyperglycemia mouse model, with upregulation of intestinal GUS activity. Targeted metabolomics analysis revealed that in the presence of high GUS activity, the hydrolysis of bile acid (BAs)-glucuronic conjugates is increased and most BAs are overproduced in the serum and liver, which, in turn, activates the ileal farnesoid X receptor (FXR) and suppresses GLP-1 secretion by L-cells. The GUS inhibitor vancomycin significantly eliminated GUS-producing bacteria and inhibited bacterial GUS activity and BAs levels, thereby enhancing L-cell GLP-1 secretion and preventing hyperglycemia. Our results propose a novel clinical strategy for inhibiting the bacterial GUS enzyme to prevent hyperglycemia without requiring withdrawal of TAC treatment. This strategy exerted its effect through the ileal bile acid-FXR-GLP-1 pathway.
Introduction
Post-transplant diabetes mellitus (PTDM) is a common complication after solid organ transplantation (SOT), and is an independent risk factor for graft failure and patient mortality.Citation1 Risks contributing to PTDM include transplant candidate, age, family history of diabetes, genetics, and prescribed immunosuppressants.Citation2 The incidence of PTDM after kidney transplantation ranges from 10% to 40%, whereas after liver transplantation, it can be as high as 50%.Citation3 It has been reported that mycophenolate (MMF) has no significant effect on glucose metabolism, while tacrolimus (TAC) is closely related to PTDM and with a higher risk than cyclosporine A (CsA) and sirolimus (SIR).Citation4,Citation5 TAC is the most widely used immunosuppressant in SOT,but the exact mechanism by which TAC-induced PTDM occurs is not fully understood, several hypotheses have been proposed. (1) TAC reduces insulin secretion through the PI3K/Akt pathway.Citation6 TAC also caused damage to mitochondrial function and blocks insulin secretion.Citation7 (2) TAC directly induces apoptosis of human islet β cells by inhibiting of mTOR and activation of BMP/SMAD signaling to accelerate metabolic stress.Citation8,Citation9 (3) TAC caused hepatic insulin resistance through insulin receptor substrate (IRS)2/AKT and sterol regulatory element binding protein (SREBP1) signaling.Citation10 Antidiabetic medications such as metformin, sulfonylureas, and insulin are widely used in the management of PTDM, but effective strategies for the prevention of TAC-induced diabetes in post-transplant patients are still lacking.Citation2
TAC is mainly metabolized by the phase I metabolic enzyme cytochrome P450 (CYP) 3A subfamily in the liver and gut wall, including CYP3A5 and CYP3A4.Citation11 Approximately 15 metabolites are formed by mono-demethylation, di-demethylated, mono-hydroxylated metabolites and modified by multiple reactions.Citation12 The major metabolite is 13-O-desmethyl tacrolimus (M1), which has only 10% the activity of TAC.Citation12 UDP-glucuronosyltransferases (UGTs) mediate phase II metabolism of endogenous and exogenous substances, which is a classic detoxification process.Citation13 Chantal et. al confirmed that UGT1A4 is the most efficient enzyme for glucuronidation of TAC in vitro.Citation14 An un-resolved peak of TAC was detected in the bile of transplant patients, incubation the bile sample with beta-glucuronidase (GUS) resulted in a single peak and increased exposure of TAC.Citation15 TAC induces toxicity via its drug prototype rather than metabolites.Citation16,Citation17 Whether alterations in endogenous metabolite or exogenous drug exposure induced by UGTs would impact the toxicity of TAC remains unclear.Citation18 GUS enzyme is closely related to the hydrolysis of glucuronides and glucose metabolism.Citation19,Citation20 Berberine, a natural alkaloid extracted from Chinese herbal medicines, mainly used for the treatment of diarrheal.Citation21 It exerts anti-hyperglycemic effects and significantly decreased the activity of intestinal GUS in diabetic rats.Citation22 However, the mechanism of intestinal GUS in diabetes remains unknown. In addition, bacterial GUS enzymes directly modify drugs to produce toxic products have also been observed. Irinotecan (CPT-11) is a first-line chemotherapy for advanced colorectal cancer,Citation23 GUS could transfer its nontoxic metabolite SN-38 G into toxic SN-38 and induced delayed diarrhea.Citation24 Mycophenolate mofetil (MMF) is another important immunosuppressant to prevent organ transplant rejection. Consistent with irinotecan, MPA can be reactivated by GUS and mediate gastrointestinal toxicity.Citation25
An increasing number of studies have revealed that interfering with gut microbiota is an effective strategy for preventing and regulating glucose and lipid metabolism disorders.Citation26 Gut microbiota is involved in host metabolism and energy homeostasis. Intestinal dysbiosis is characterized by diversity of microbial communities and an increase in potentially harmful microbes, which can affect the progression of diabetes.Citation27 Furthermore, bacteria derived metabolites including lipopolysaccharide (LPS), short-chain fatty acids (SCFAs), free fatty acids (FFAs), and bile acids (BAs) has been partly revealed.Citation28 Excessive production of LPS is one of the features associated with microbiota dysbiosis, which triggers for endotoxin production and causes low-grade chronic inflammatory responses that induce insulin resistance.Citation29 Gut microbiota ferment nondigestible carbohydrates (e.g., dietary fiber) to produce a variety of metabolites such as SCFAs.Citation30 These metabolites can influence permeability of the intestinal barrier and gut hormone secretion, thereby affecting insulin sensitivity and glucose homeostasis.Citation31 High cholesterol levels are a risk factor for diabetes development.Citation32 The synthesis of BAs is the major pathway of cholesterol catabolism, which affecting host lipid metabolism by regulating farnesoid X receptor (FXR) and Takeda G-protein-coupled receptor (TGR5).Citation33 The role of bacterial metabolite SCFAs in the development of TAC-induced hyperglycemia has been demonstrated, and oral supplementation with butyrate can treat TAC induced hyperglycemia.Citation34 It remains unclear whether TAC-induced PTDM can be prevented by targeting the gut microbiota.
Therefore, this study aimed to investigate whether changes in the composition of gut microbiota could prevent TAC-induced hyperglycemia. We hypothesized that TAC-induced diabetes is related to bacterial GUS enzyme activity, and investigated whether targeting bacterial GUS could reverse TAC-induced hyperglycemia and the underlying mechanism.
Material and methods
Mice
Eight-week-old male C57BL/6J mice aged were purchased from GemPharmatech Biotechnology Co., Ltd. (Jiangsu, China) with permission number SYXK 2021–0057 and were acclimatized for a week before commencing any experiment. Animals were maintained in a specific pathogen-free facility room at the Laboratory Animal Center, Huazhong University of Science and Technology. Mice were housed in a controlled environment (temperature range of 20–22°C; relative humidity between 40%-60%; under a 12 h light/dark cycle). Food and water were provided ad libitum during the acclimatization period. The study protocol followed international ethical guidelines and was approved by the Animal Ethics Committee of Huazhong University of Science and Technology.
Animals study design
After acclimatization, mice were randomly assigned to three groups (n = 6 per group): (1) Control (CON) group: mice were injected intraperitoneally daily in the morning with saline; (2) Tacrolimus (TAC) group: mice were injected intraperitoneally daily in the morning with 2.0 mg/kg/d TAC; (3) Tacrolimus combined with vancomycin (TAC + VAN) group: mice were injected intraperitoneally daily in the morning with 2.0 mg/kg TAC and 500 mg/L of vancomycin (VIANEXS.A, Registration number H20140174) was administered in the drinking water ad libitum. All interventions lasted four weeks and body weight was regularly recorded every three days. The fresh feces of all mice were collected during the last week and stored at − 80°C until the analysis. All mice were fasted for 12 h and water was available before death. Mice were euthanized and blood samples were collected and centrifuged at 3000 rpm for 15 min to obtain serum. Tissues and organs, such as pancreas and intestines were flushed with phosphate-buffered saline (PBS, pH 7.4) and stored at − 80°C until subsequent analysis or in 4% paraformaldehyde for histological.
Fasting glucose and insulin assays
Mice were fasted for 12 h with free access to water and blood samples were collected from the tail vein to detect fasting blood glucose (FBG) weekly by a One Touch glucometer (Johnson & Johnson, USA). Fasting insulin levels were determined in the serum of mice fasted for 12 h using an enzyme-linked immunosorbent assay (ELISA) kit (Bioswamp, Cat# MU30432). According to the fasting insulin and glucose concentration, the insulin resistance index HOMA-IR was calculated according to EquationEquation (1)(1)
(1) :
Glucose and insulin tolerance tests
At week 4, we performed intraperitoneal glucose tolerance test (GTT) and insulin tolerance test (ITT) in mice respectively, according to the methods described by Le, JCitation35 and Mooli.Citation36 Mice were placed in clean cages and fasted with free access to water. For the GTT, mice were fasted for 12 h and baseline blood glucose was measured using a glucometer. They were then intraperitoneally administered 20% glucose (2 g/kg, body, weight) and blood glucose was measured through the lateral tail vein at 0, 30, 60, 90 and 120 min. For the ITT, mice were fasted for 6 h followed by an intraperitoneally injection of 0.75 IU/kg insulin and blood glucose were measured at 0, 30, 60, 90 and 120 min after injection.
Biochemical analysis
ELISAS was used to quantify the serum and fecal LPS (Enzyme Linked Biotechnology Co., Ltd, Cat# MM-0634M1), fecal β-Glucuronidases (Bioswamp, Cat# MU30770), GHbA1c (CUSABIO, Cat# CSB-E08141m), serum FGF15 (Bioswamp, Cat# MU31463) and serum GLP-1(Bioswamp, Cat# MU30354) according to the manufacturer’s instructions.
Histopathological examination and immunofluorescence stain
The pancreas, colon and ileum were fixed in 4% phosphate-buffered formalin acetate at 4°C overnight and embedded in paraffin wax. Paraffin sections (5 μm thick) were stained with hematoxylin and eosin (H&E), dehydrated and sealed, and microscope images were captured. The histopathology of the pancreas was evaluated using the scale proposed by Schmidt et al.,Citation37 which included inflammatory cell infiltration, edema, and acinolytic cell necrosis. Immunofluorescence staining was performed to evaluate insulin and glucagon secretion in pancreatic β cells and GLP-1 expression in the intestine. The fixed fresh tissue was stored in 4% paraformaldehyde overnight and, sliced after dehydration and OCT embedding. The tissue sections were antigen-repaired, cooled to room temperature and blocked with 3% BSA diluted in PBS for 30 min, followed by overnight staining with primary antibodies. Pancreas sections were immuno-labeled with a combination of rabbit pAb anti-insulin (Servicebio, cat# GB11334, 1:150) and rabbit pAb anti-glucagon (Servicebio, cat# GB113496, 1:1000) antibodies. The colon and ileum sections were incubated with a primary anti-GLP-1 rabbit pAb (Servicebio, cat# GB11335, 1:500). Incubated overnight at 4°C, washed three times with PBS, and incubated with fluorescein conjugated secondary antibodies of the corresponding species. The nuclei were counterstained with 4,6-diamino-2-phenyl indole (DAPI). All stained sections were observed under a Leica microscope, fluorescence intensity was quantified using the built-in analysis software LAS X, and cells were counted using Image J 1.8.0_345.
Imaging of intestinal microbial GUS enzyme activity in mice
The GUS activity of the mice was detected using fluorescein di-β-D-glucuronide (FDGlcU, Thermo Fisher Scientific, Cat#F2915) by the method of Chen et al. as reported.Citation38 Mice (n = 6, per group) were administrated orally 7.3 μmol/kg FDGlcU dissolved in distilled deionized water. The fluorescence intensity in the intestine was detected on a Spectrum imaging system (Lago X, Spectral Instruments Imaging) 3 h after probe administration (λex: λem = 465 nm: 530 nm), with an exposure time was 5s. Fluorescence intensity was quantified by intestinal fluorescence using the Aura assay software.
GUS enzyme activity assay in feces
GUS activity in feces was measured using the colorimetric method by monitoring the release of p-nitrophenol after reacting with the substrate 4-Nitrophenyl β-D-glucuronide (pNPG) modified according to the method of Cheng et al. Citation39 Briefly, fresh stools were collected, weighed, and homogenized in PBS buffer (1:9 w/v, containing 1% DMSO and 0.05% BSA). The fecal suspension (45 μL) was added to 50 μL of 20 mM pNPG. The mixture was incubated at 37°C for 1 h and was then centrifuged at 6000× g for 10 min. The resulting supernatant was collected and mixed with 5 μL of 2N sodium hydroxide. The OD value was measured at 405 nm.
Metagenomic analysis
Total genomic DNA was extracted from fecal samples using an E.Z.N.A. stool DNA kit (Omega Bio-Tek, Norcross, GA, USA). Successful DNA isolation was confirmed using agarose gel electrophoresis and Qubit® dsDNA Assay Kit in Qubit® 2.0 Fluorometer (Life Technologies, CA, USA). The NEBNext® Ultra™DNA Library Prep Kit for Illumina (NEB, USA) was used to build the paired end library. Metagenomic high-throughput sequencing was performed using the Illumina HiSeq sequencing platform (Illumina, USA) to remove the host reads from the metagenomic sequences, which were aligned genome of mice and filtered using Bowtie2 version v2.2.4. Clean metagenomic sequence reads were analyzed using the DIAMOND software (V0.9.9, https://github.com/bbuchfink/diamond/) taxonomic sequence classification approach on the NR database (Version: 2018-01-02, https://www.ncbi.nlm.nih.gov/) of NCBI comprising all complete bacterial, viral, and archaeal genomes in RefSeq. All coding regions of the metagenomic scaffolds longer than 200 bp were predicted using MetaGeneMark. The functional profiles of nonredundant genes were obtained by annotation against the Kyoto Encyclopedia of Genes and Genomes (KEGG) and Carbohydrate-Active EnZymes database (CAZy).
SCFAs assay
SCFAs determination was modified according to the method described by Jin et al. Citation40 2-ethylbutyric acid was used as the internal standard, and the SCFAs standard curve contained acetic acid, propionic acid, butyric acid, isobutyric acid, valeric acid, isovaleric acid, and caproic acid. Fecal samples (20 mg) were extracted with 200 μL of acetonitrile. Then the samples were vortexed for 2 min followed by centrifugation at 12,000 rpm for 10 min at 4°C. Next, 60 μL of the extracted suspension was mixed with 30 μL of 0.2 M derivatization reagent (3-Nitrophenylhydrazine) 3-NPH and 30 μL of 0.12 M ethyliminomethylideneamino)-N, N-dimethylpropan-1-amine, hydrochloride (EDC) on ice. The mixture reacted in a water bath at 40°C for 20 min. 30 μL of 3-NPH-dtervatived internal standards were added to each sample. Finally, the mixture was centrifuged for 10 min at 12,000 rpm and the suspension were analyzed using HPLC-MS The fecal SCFAs contents were determined using an ACQUITY HPLC system (Waters, USA) and an API 4000 triple quadrupole mass spectrometry system (Applied Biosystems, USA). Separation was conducted on an Inertsil ODS-SP column (100 mm × 2.1 mm, 3 μm) (Shimadzu). The mobile phase was composed of 0.1% formic acid in 10 mM ammonium acetate aqueous (A) and acetonitrile (B). The LC gradient profile was as follows: 0-2 min 15%B; 2–11 min 15–55%B; 11–12 min 55–100%B; 12–13 min 100%B; 13–13.5 min 100%-15%, re-equilibrate at 15% B for 5 min. The column temperature was 45°C and the injection volume was 5 μL.
BAs composition analysis
The BAs concentrations in samples were quantified using ultra performance liquid chromatography mass spectrometry (QTRAP 5500, AB Sciex). Acquity BEH C18 column (100 mm × 2.1 mm, 1.7 μm, Waters.) was used at temperature of 35°C and the flow rate of 0.1 mL/min. Briefly, the serum, liver and feces were homogenized in cold normal saline, precipitated with alkaline acetonitrile, centrifuged, and supernatant evaporated under nitrogen steam until dry. The resulting residue was resuspended in 85% methanol and injected into a UPLC-MS system. The mobile phase consisted of methanol (A) and 5 mM ammonium acetate, containing 0.1%formic acid (B). The flow rate was 0.1 mL/min. The LC gradient profile was as follows: 0-1 min 10%A; 1–2 min 50%A; 2–3 min 65%B; 3–6 min 70%A; 6–11 min 75%A, 11-20 min 80%A; 20-40 min 92%A; 40–42.5 min 95%; 43.5-45 min 10%A. DHCA was used for internal standard.
Q-PCR and western blot analyses
Total RNA was extracted using specialized fecal RNA isolation Kit (absin, Cat# abs60290) and qPCR was performed with the CFX96 (Bio-Rad, Hercules, CA). The quality of the amplified product was assessed by melting curve analysis at the end of amplification. Target primer sequence of beta-glucuronidase (GUSB) F: TTCAGAGCGAGTATGGAGCA; GUSB R: CTCTCGTCGGTGACTGTTCA. All samples were performed in duplicate, and data were normalized to GADPH and analyzed according to the 2− ΔΔCT method.
Intestine tissues including ileum and colon were lysed in RIPA buffer containing protease and phosphatase inhibitors and PMSF. The total protein was determined using the BCA assay kit (Beyotime Biotechnology) described previously.Citation41 After boiling at 95°C for 10 min, equal amounts of protein were electrophoresed on 12% SDS-page gels and transferred to a polyvinylidene fluoride (PVDF) membrane. The membranes were blocked at room temperature with 5% nonfat milk and the membranes were incubated with antibodies against FXR (Abcam, Cat# ab228949, 1:100), TGR5 (ABclonal technology, Cat# A20778, 1:1000), CYP7A1 (ABclonal technology, Cat# A10615, 1:1000), SHP1 (ABclonal technology, Cat# A1836, 1:500), GUSB (Proteintech, Cat# 16332–1-A P1:500) and β-actin (Abcam, Cat ab115777, 1:4000) at 4°C overnight. The membranes were washed three times 5 min with TBST buffer three times for 5 min each time and followed by a 2 h incubation at room temperature with HRP conjugated secondary antibody (Proteintech, Cat# 20536–1-AP, 1:20000).
Statistical analysis
All data are presented as the mean ± SD. Statistical analysis and all bar plots were performed using GraphPad Prism (GraphPad Software, San Diego, USA, Version 8.3.0 (538). The area under the curve was calculated using this software. Student’s t-test and one-way ANOVA with Tukey’s post-hoc analysis was used for all comparisons. Differences between the groups were considered statistically significant at p < 0.05. For metagenomic analysis, R software (Version 2.15.3) was adopted for data statistics. Krona analysis, the exhibition of the generation situation of relative abundance, the exhibition of abundance cluster heat map, Principal Component Analysis (PCA) decrease-dimension analysis were based on the abundance table of each taxonomic hierarchy. The differences between groups were tested using Anosim analysis (R vegan package, Version 2.15.3). (Linear discriminant analysis) LEfSe analysis were used to look for the different species between groups by LEfSe software (the default LDA score is 3). Orthogonal projection to latent structures discriminant analysis (OPLS-DA) was used to determine taxonomic changes, and VIP (variable importance) scores were used to rank the ability of different taxa to discriminate between different groups. Correlation analysis of bile acid and gut microbiota was investigated using Spearman correlation analysis and only correlations with p < 0.05 and r > 0.6 were displayed.
Results
Vancomycin treatment is sufficient to prevent TAC-induced hyperglycemia
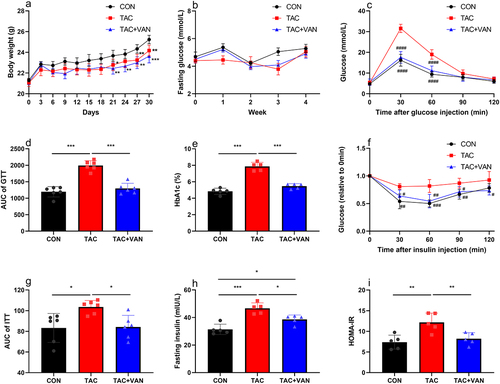
After 4 weeks treatment, the body weight of mice both in the TAC and TAC+VAN groups significantly decreased compare to the CON group (). TAC induced weight loss was common in the diabetic model, and vancomycin did not reverse it here.Citation42,Citation43 No discernible differences in fasting glucose levels were observed among the three groups (). A set of tests was performed to assess the effects of TAC on glucose homeostasis and insulin sensitivity. GTT was conducted to evaluate the host glucose loading capacity, which is considered as the gold standard for diagnosing PTDM. As expected, TAC significantly increased blood glucose levels both at 30 and 60 min compared to the CON group, as well as larger areas under the GTT curves (). Vancomycin coadministration effectively improved TAC-induced impaired glucose tolerance. Consistent with the improvement in glucose tolerance, vancomycin co-administration markedly enhanced insulin sensitivity. After insulin injection, the TAC group showed higher glucose levels () and larger areas under the ITT curves () than the CON group, while vancomycin co-administration significantly reduced the ITT levels back to the CON group. TAC group showed a higher fasting insulin level () and HOMA-IR () index than the CON group, and vancomycin co-administration prevented this effect. In addition, HbA1c levels were 4.83% and 5.46% in CON group and TAC+VAN groups, respectively, which were lower than the 7.65% observed the TAC group (). These results demonstrated that vancomycin intervention can prevent TAC-induced glucose metabolism disorders, insulin secretion dysfunction and insulin resistance.
Figure 1. TAC-induced disturbance of glucose homeostasis. a body weight of mice over 4 weeks. b fasting blood glucose. c intraperitoneal glucose tolerance test (GTT). d area under the curve (AUC) for the GTT curves. e HbA1c. f intraperitoneal insulin tolerance test (ITT). g area under the curve (AUC) for the ITT curves. h fasting serum insulin. i HOMA-R index. Data are presented as the mean± SD (n = 6 biologically independent animals). *p<.05, **p<.01, ***p<.001 verse control group, #p<.05, ##p<.01, ###p<.001, ####p<.0001 verse TAC group.
Vancomycin remodels insulin secretion and survival of β-cells
TAC is directly toxic to islets. After 4 weeks of TAC treatment, an aberrant structure and diminished size of islets were observed, with significantly fewer islet cells (). Interestingly, no obvious pancreatic histological lesions were detected between the CON and TAC+VAN groups, with an orderly arrangement of islet cells that appeared in distinct clusters with prominent lesions. Compared with the TAC group, TAC+VAN group showed significant restoration of the pancreatic architecture, an obvious increase in the number of β cells, and uniform nuclear staining.
Figure 2. Vancomycin prevention of TAC-induced insulin and glucagon secretion dysfunction. a Histological analysis of β cell proliferation in the pancreatic tissues of mice. (magnification 40×, scale bar = 50 μm). b Representative image of an islet immunostained for glucagon and insulin. Scale bar = 100 μm. c quantification of α cells and β cells per islet slice, and the ratio of β cells and α cells. Data are presented as the mean± SD (n = 3 biologically independent animals). *p < .05, **p < .01, ***p < .001.
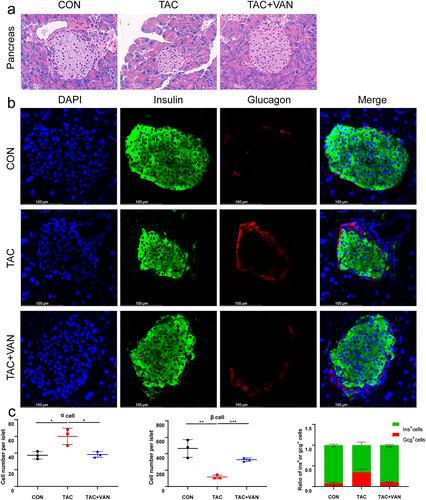
Quantitative analysis revealed a marked reduction in the area of islets stained for insulin and an equivalent increase in the area stained for glucagon in the TAC group. Concomitantly, vancomycin administration significantly increased insulin secretion and decreased glucagon levels (). Compared to the CON group, β cell numbers were reduced from 92.22% to 65.67%, and α cell numbers increased from 7.78% to 34.33% alter TAC treatment. TAC+VAN treatment induced a marked expansion in the number of β cells (89.51%) per islet slice and a significant decrease in the number of α cells (10.49%), thereby increasing the ratio of β to α cells (). These results indicated that vancomycin coadministration restored TAC-induced islet injury.
Vancomycin abolishes TAC-induced increment of GUS-producing gut bacteria
We performed metagenomic sequencing to examine the composition of gut microbiota in the three groups. A total of 1,341,547 gene catalogs were constructed after deredundancy. Venn diagram analysis showed that the three groups shared 95,978 genes, with 120,057 unique genes in the CON group 93,865 unique genes in the TAC group, and 70,816 unique genes in the TAC+VAN group (). There were no statistical differences in the number of genes between control and TAC groups, while the TAC+VAN group had a significantly decreased number of genes compared to the other groups (). Principal component analysis (PCA) at the phylum level showed that microbiota composition differed among the three groups (). At the phylum level, 80% of the bacteria in the CON and TAC groups were mainly composed of Bacteroidetes, Firmicutes, Actinobacteria and Proteobacteria, with Bacteroidetes being the dominant phylum, accounting for more than 40% of each group (Fig. S1a). The TAC + VAN group was mainly composed of Firmicutes, Proteobacteria and Actinobacteria, and with minimal Bacteroidetes content (). Bacteroidetes increased significantly in the TAC group and decreased sharply after vancomycin treatment. While the relative abundance of Firmicutes showed a downward trend in the TAC group, it recovered in the TAC + VAN group. (Fig. S1b).
Figure 3. Taxonomic composition of the gut microbiota of mice. a Venn diagram of the composition of gut microbiota in the three groups. b analysis of the differential number of genes. c Principal component analysis (PCA) at phylum level. d composition summary showing the top 10 phyla detected in the gut microbiota. e Cladograms generated by LEfSe depicting taxonomic associations among the three groups of mice microbial communities. f an LDA score based on the LEfSe method is shown and highlights the taxonomic groups in the CON, TAC and TAC+VAN group. Red bars indicate taxa predominant in CON mice. Green bars indicate taxa predominant in TAC mice. Blue bars indicate taxa predominant in TAC+VAN mice (LDA >3). Data are presented as the mean± SD (n = 6 biologically independent animals). *p<.05, **p<.01, ***p<.001.
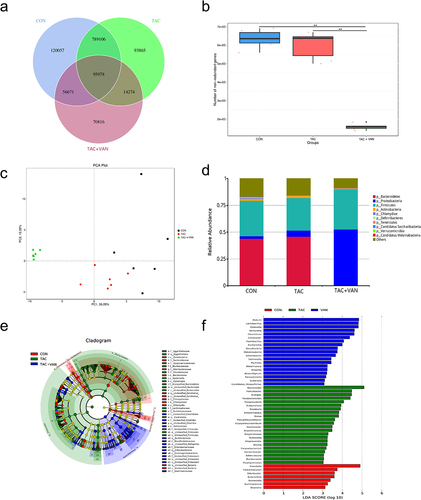
Linear discriminant effect size (LEfSe) analysis was used to screen for the differential gut microbiota biomarkers in each group to explore the specific bacteria associated with the occurrence of PTDM (). The LEfSe results showed that the classes Bacteroidia and Clostridia were enriched in the TAC group, both decreased in the TAC+VAN group. The dominant bacteria in the TAC+VAN group included Gammaproteobacteria and Unclassified_Proteobacteria, which were significantly lower in the TAC group (). At the genus level, we found that Bacteroides, Alistipes, Parabacteroides and Paraprevotella below the phylum Bacteroides, one genus Helicobacter belonging to the phylum Proteobacteria, showed high abundance in the TAC group (), as well as two genera Dubosiella and Hungatella belonging to the phylum Firmicutes. All of these genera were substantially reduced after the addition of vancomycin (Fig. S1c). At the family level, the dominant bacteria were Desulfovibrionaceae, Enterobacteriaceae, Unclassified Proteobacteria and Akkermansiaceae, which were increased in the TAC+VAN group. Additionally, the genera Beduini, Lactobacillus, Veillonella and Clostridium below the phylum Firmicutes were abundant in the TAC+VAN group.
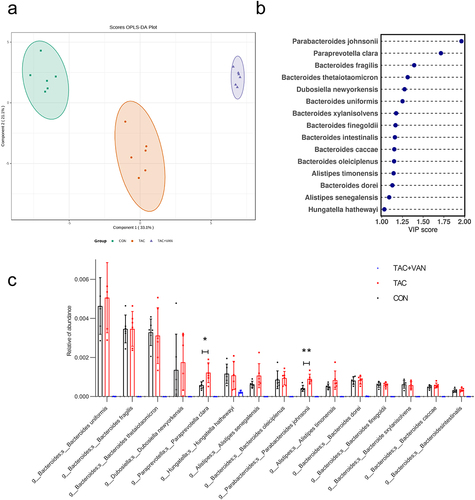
The common function of these increased microbial genera in the TAC group is related to the generation of GUS enzymes, and vancomycin is used as a GUS enzyme inhibitor to alleviate GUS-mediated drug toxicity.Citation25,Citation44,Citation45 We identified GUS-enriched bacteria among the top 200 species in the TAC group by searching the NCBI database gene information. We performed Orthogonal Partial Least Squares Discrimination Analysis (OPLS-DA) of the gut microbiota composition at the species level in the CON, TAC and TAC+VAN groups (). Remarkable changes in the microbiota structure were induced by TAC and TAC+VAN. The variable important in projection (VIP) scores greater than 1.0 from the OPLS-DA analysis are shown in . Fifteen key GUS-enriched species were screened, and the species Parabacteroides johnsonii and Paraprevotella clara were the top gut microbiota that resulted in group separation before and after TAC treatment (). Accordingly, the TAC group showed a marked increase in the relative abundance of Parabacteroides johnsonii and Paraprevotella clara, whereas concomitant administration of vancomycin significantly reduced their abundance. ().
Figure 4. GUS-producing species are enriched in TAC-induced PTDM mouse model. a OPLS-DA plot on species level in the three groups. b the species rank of VIP scores of the OPLS-DA analysis between CON and TAC groups. c different species abundance of GUS producing bacteria based on metagenomic data. Data are presented as the mean± SD (n = 6 biologically independent animals). *p<.05, **p<.01, ***p<.001.
Vancomycin decreases GUS-produced gene abundance and enzyme activity increased by TAC
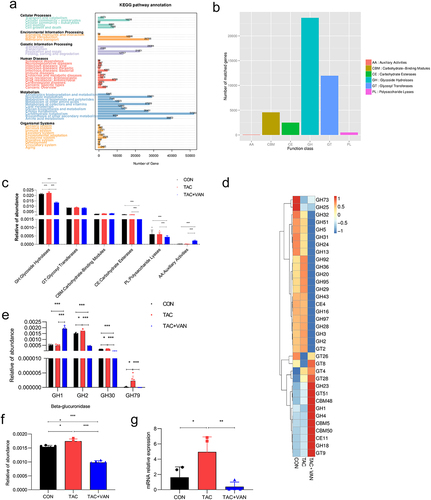
The results of KEGG analysis suggested that metabolism-related pathways, including carbohydrate metabolism, amino acid metabolism and nucleotide metabolism, were the key metabolic pathways affected by the changes in gut microbiota in mice (). Homeostasis of the microbiota is a key factor in the production of Carbohydrate-Active Enzymes (CAZy), which interfere with complex carbohydrate metabolism. The proportions of carbohydrate enzymes in the three groups, from highest to lowest, were as follows: glycoside hydrolase (GH) > glycosyltransferase (GT) > carbohydrate binding module (CBM) > carbohydrate esterase (CE) > polysaccharide lyase (PL) > auxiliary redox reductase (AA) (). The bacterial GUS enzyme belongs to the GH family. The abundance of GH family was significantly enhanced in the TAC group and was reversed by vancomycin co-administration (). Functional annotation of CAZys was performed, and a clustering heat map was drawn from the functional difference level according to the abundance (). GUS is classified into glycosyl hydrolase family 1 (GH1), family 2 (GH2), family 30 and family 79 (GH79), with the largest proportion of GH2. Further annotation of the GH family showed that GH2, GH30 and GH79 were enriched in TAC group, while vancomycin co-administration significantly reduced these gene abundance of GH enzymes (). Similarly, the relative abundance of GUS in the TAC group was significantly higher than that in the CON group, and vancomycin coadministration effectively inhibited GUS (). Furthermore, we quantified the fecal GUS enzymes by Q-PCR. Compared to control group, tacrolimus administration significantly increased the mRNA expression of GUS in fecal, and vancomycin significantly reduced the GUS enzymes ().
Figure 5. Vancomycin inhibited GUS gene expression up-regulated by TAC. a KEGG pathway classification in three groups. b CAZy category. (GH, Glycosyl Hydrolases; GT, Glycosyl Transferase; CBM, carbohydrate-binding Modules; CE, carbohydrate Esterases; AA, auxiliary activities). c relative abundance of genes encoding carbohydrate enzymes at CAZyme level 2. d clustering heat maps of CAZy families. e gene abundance of the GH family, to which the GUS enzymes belong. g GUSB gene expression in feces by qPCR. Data are presented as mean± SD (n = 6 biologically independent animals). *p<.05, **p<.01, ***p<.001.
Vancomycin reduces the abnormally increased intestinal GUS activity of TAC
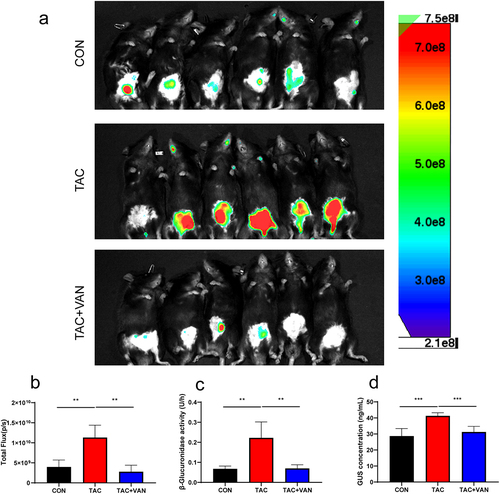
The effect of TAC and vancomycin on intestinal GUS activity in intact animals was assessed using the FDGlcU, which is hydrolyzed by GUS enzymes to produce a fluorescent signal. Real-time fluorescence imaging of the mouse abdomen of the three groups is shown in . Compared with the CON group, mice exposed to TAC demonstrated a significant increase in fluorescent signal. Notably, vancomycin coadministration effectively decreased the abdominal fluorescent signals compared to that in the TAC group. Concordant with reduced abdominal GUS activity, GUS activity () and concentration () in fecal pellets were markedly enhanced by TAC, and vancomycin coadministration significantly reduced GUS activity and concentration compared to that in the TAC group. Endotoxin LPS are almost exclusively derived from the intestinal bacteria of Gram-negative bacteria cell wall composition, are closely associated with hyperglycemia.Citation46 Bacterial LPS expression was positively correlated with GUS.Citation47,Citation48 Both serum and fecal levels of LPS were dramatically increased in TAC-treated mice compared with control mice, and vancomycin co-administration significantly abolished TAC-induced LPS increment in serum and feces (Fig. S2a, b). The ratio of LPS/GUS in fecal samples were calculated, and there is no significant difference observed among these groups (Fig. S2c). Compared to the control group, TAC upregulated the protein expression of GUS both in colon (Fig. S2d, e) and ileum (Fig. S2f, g) tissues, whereas vancomycin significantly reduced GUS protein expression in colon, restoring it to control levels.
Figure 6. Vancomycin inhibited intestinal bacterial GUS activity. a GUS activity of the CON, TAC and TAC+VAN group was then imaged using the fluorescent substrate FDGlcU. b mean fluorescence intensity of the three groups. c fecal pellets were collected to evaluate the GUS activity in mice by pNPG assay. d concentration of GUS in fecal were determined by ELISA. Data are presented as the mean± SD (n = 6 biologically independent animals). *p<.05, **p<.01, ***p<.001.
Vancomycin alters luminal secondary metabolites
Short-chain fatty acids are important secondary metabolites of the gut microbiota. Seven types of SCFAs were measured in the feces of the three groups after 4 weeks of intervention (). There was no significant change in the seven SCFAs after TAC administration compared to that in the CON group. Vancomycin coadministration significantly reduced fecal SCFAs content, including acetic acid, propionic acid, butyric acid and valeric acid, to a very low level.
Figure 7. SCFAs and BAs levels. a quantification of the level of different SCFA in the fecal content. b, c primary and secondary bile acid levels in the serum and liver (n = 6 biologically independent animals). d FXR and TGR5 protein expression in the ileum were detected by western blot. e expression of CYP7A1 and SHP1 in liver were detected by western blot. f serum FGF15 levels were detected by ELISA. Data are presented as the mean± SD (n = 3 biologically independent animals). *p<.05, **p<.01, ***p<.001.
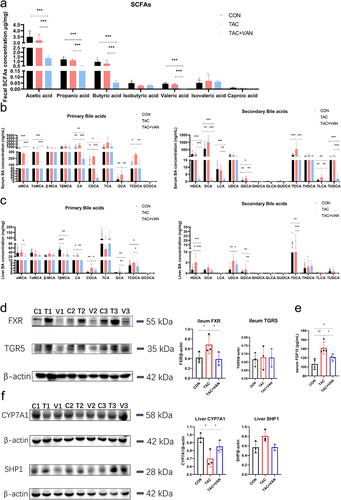
We then determined the BAs profiles in the serum, liver tissue and fecal contents using ultra-performance liquid chromatography-triple-quadrupole mass spectrometry. In general, tacrolimus treatment led to increased total bile acid levels both in liver and plasma, while vancomycin concomitantly treatment significantly decreased these (Fig. S3a, b). Nevertheless, there was no significant difference in stool total bile acid among the three groups (Fig. S3c). In liver and serum, the primary bile acids levels showed an increasing trend after tacrolimus treatment (Fig. S3d, e). Tacrolimus significantly elevated the secondary bile acids levels, while co-administration tacrolimus with vancomycin substantially reduced the primary and secondary bile acids levels. Although the total bile acid level in cecal contents was not affected by tacrolimus or vancomycin treatment, there was a significant reduction in the proportion of secondary bile acids by vancomycin treatment (Fig. S3f). TAC notably elevated the levels of primary BAs CA, CDCA, GCA and TCDCA and secondary BAs DCA in serum and liver tissue. Secondary BAs GDCA and TDCA were enriched in the serum, while HDCA and UDCA were highly present in liver after TAC treatment (). In the TAC+VAN group, we observed a significant decrease in primary BAs, except for β-MCA and T-βMCA compared with the TAC group. Additionally, secondary BA particularly DCA, LCA and HDCA, were severely diminished. Serum UDCA levels were not affected by either TAC or vancomycin co-administration, however, TAC increased hepatic HDCA levels, while vancomycin concomitant administration reversed this effect. In the fecal contents, most of the secondary BAs and the primary BAs were similar between the CON and TAC groups, but within the secondary BAs, DCA levels were enriched in the TAC group. Vancomycin continued to reduce the majority of secondary BAs in fecal contents, while UDCA levels were enhanced. In contrast to what was observed in the liver and serum, vancomycin up-regulated some of the primary BAs. In detail, fecal primary BAs were presented as elevated β-MCA, T-βMCA, CA and CDCA and declined TCA and TCDCA (Fig.S3g).
Changes in BAs levels correlate with GUS-enriched bacteria
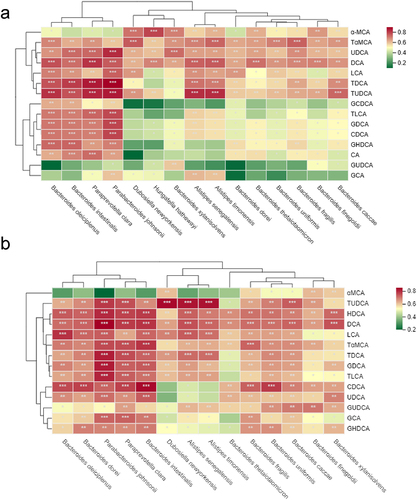
Multivariate correlation analysis based on generalized estimating equations revealed that TAC-induced upregulation of GUS-enriched bacteria correlated with changes in liver and serum BA composition (, p < .05, ρ>.6). In liver, most secondary BAs and three primary BAs (CDCA, T-aMCA and GCA) were strongly correlated with the 15 GUS-enriched species (). The related secondary liver BAs were HDCA, UDCA, DCA, LCA, taurine-secondary BAs (TUDCA, TDCA and TLCA) and glycine-secondary BAs (GDCA, GUDCA and GHDCA). In serum, we found that secondary BAs including UDCA, DCA, LCA, TDCA and TUDCA and primary BAs α-MCA and tacrine-α-MCA had a significant positive correlation with the 15 GUS-enriched species (). Moreover, the primary BAs CA and CDCA and most conjugated BAs were also related to Bacteroides oleicipienus, Bacteroides intestinalis, Paraprevotella clara and Parabacteroides johnsonii.
Figure 8. GUS-producing bacteria are significantly correlated with BAs profile. Heatmap of spearman’s correlation coefficients between the serum (a) and liver BAs (b) and the GUS-producing bacteria, the color of each spot in the heatmap corresponds to the r value (ρ>.6). The correlations were analyzed using Spearman’s correlation. FDR-adjusted p < 0.05 (*p < 0.05, **p < .01, ***p < .001) was shown.
Vancomycin decreases ileum FXR signaling and restores intestinal GLP-1 secretion
As BAs are endogenous FXR and TGR5 ligands, we measured FXR and TGR5 expression in the colon and ileum. After secretion into the intestinal lumen, approximately 95% of BAs are reabsorbed in the ileum and returned to the liver, and only 5% enter the colon and are excreted in stool. Consistent with the BA profiles of liver, signals in the ileum FXR axis were up-regulated by TAC and reversed upon vancomycin co-administration (). Interestingly, the expression levels of TGR5 were not differ significantly after TAC or vancomycin exposure (). The protein expression of FXR and TGR5 in the colon was not significantly different among the three groups (Fig. S3h, i). Binding of bile acids to ileal FXR induces expression of fibroblast growth factor (FGF15/19). FGF15/19 can inhibit the rate-limiting enzyme cholesterol 7α- hydroxylase (Cyp7A1), and can also increase the stability of hepatic SHP, ultimately affecting BA synthesis.Citation49,Citation50 Accordingly, serum FGF15 levels were significantly increased by tacrolimus treatment, and decreased by vancomycin concomitantly treatment (). Tacrolimus enhanced hepatic SHP1 expression, which was prohibited by co-administration with vancomycin. The hepatic protein expression of Cyp7A1 was remarkably decreased by tacrolimus treatment compared to the control group. While vancomycin treatment upregulated the hepatic Cyp7A1 expression ().
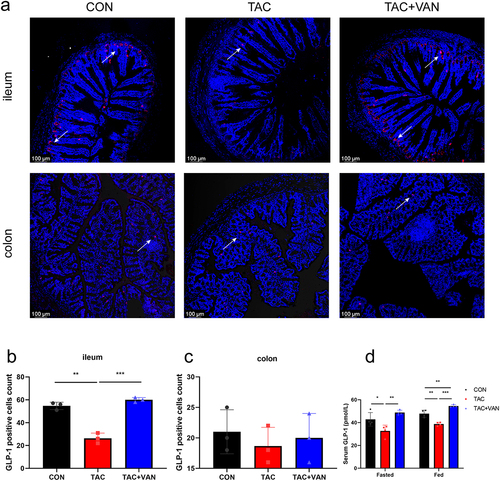
The activation of FXR in enteroendocrine cells leads to a decrease in GLP-1 release, which impairs pancreatic β-cell function and worsens insulin resistance. As shown in , ileal GLP-1 was significantly decreased by TAC administration, whereas vancomycin co-administration enhanced GLP-1 secretion (). No significant differences in colonic GLP-1 expression were observed between groups (). We measured the baseline level of GLP-1 in the GTT experiment and 30 min after glucose injection. Either in fasting or fed state, tacrolimus administration led to a significant decrease in GLP-1 secretion, while vancomycin concomitantly treatment significantly elevated serum GLP-1 levels ().
Figure 9. Effects of vancomycin on the protein expression of GLP-1 in the ileum and colon. A Representative photographs of ileum and colon sections stained with an anti-GLP-1 antibody. The blue fluorescence indicates DAPI, and the red fluorescence indicates GLP-1. (a: 200 × objective, scale bar = 100 μm). b, c quantitation of GLP-1 cell numbers per field of ileal and colonic tissue. d serum level of GLP-1 after fasting or 30 min after an injection of glucose. Data are presented as the mean± SD (n = 3 biologically independent animals). *p < .05, **p < .01, ***p < .001.
Discussion
PTDM is a frequent and fatal complication after transplantation. It can increase risk of infection and rejection, dysfunction of transplanted organs, and other complications.Citation51 TAC is an immunosuppressant that is commonly continued after SOT to prevent organ rejection. It is well known that TAC is an important risk factor for PTDM. However, it is difficult to avoid this risk. Insulin and oral hypoglycemic agents are used to treat PTDM, but their side effects and risk of interaction with other medications used to prevent organ rejection pose significant clinical challenges.Citation52 Ideally, a new clinical strategy to prevent PTDM without withdrawing the use of TAC can improve outcomes for transplant patients and increase the long-term success of the transplanted organ. In the present study, we successfully prevented TAC-induced hyperglycemia using vancomycin combination therapy. Administering vancomycin concurrently prevented TAC-induced hyperglycemia through targeted elimination of GUS-producing bacteria, reduction of GUS enzyme activity, resulting in inhibition of the intestinal BAs-FXR signaling pathway and elevated ileal GLP-1 secretion.
Consistent with a previous study, TAC significantly increased GTT and HbA1c levels, supporting the effect of TAC on glucose disorder.Citation10,Citation34 However, we found that TAC did not significantly alter FBG levels, but showed a downward trend, which is consistent with the findings of Wang et al. Citation10 In our study, hyperglycemia cases were diagnosed by GTT, which is still the gold standard for assessing of abnormalities in glucose metabolism. FBG may have underestimated the occurrence of PTDM after transplantation. Here, we also demonstrated that vancomycin could prevent TAC-induced increase in HbA1c and GTT levels, suggesting that vancomycin combination therapy improved the impaired glucose tolerance and glucose disorder. In the TAC+VAN group, ITT levels, fasting insulin levels and HOMA-IR also decreased back to control levels, indicating the recovery of insulin sensitivity and secretion. The influence of vancomycin on glucose homeostasis is controversial, and oral administration of vancomycin has been proved to induce insulin resistance by upregulating liver FXR-FGF19 signaling with a marked change in intestinal microbiota composition.Citation53 While oral vancomycin reversed high-fat diet (HFD)-induced diabetes by decreasing GLP-1 and PYY levels and enhancing glucose-dependent insulinotropic peptide in the plasma.Citation54 Zarrinpar et al. also suggested that antibiotic-induced microbiome depletion could alter glucose homeostasis by potentially altering plasma GLP-1 levels.Citation55
GUS activity in the duodenum, jejunum and ileum of diabetic rats was 1.7-fold, 1.5-fold and 1.9-fold, respectively, of that in normal rats.Citation22 Higher bacterial enzyme GUS activity in HFD rats is also observed in overweight children.Citation56 Elevated GUS activity has been reported to be closely associated with the development of diabetes mellitus, and increased levels of GUS activity have been postulated to be a result of hyperglycemia. In this study, a significant increase in intestinal GUS enzyme activity was observed in TAC-induced hyperglycemia mice. Vancomycin, a known GUS enzyme inhibitor,Citation25,Citation45 decreased TAC-induced GUS enzyme activity and prevented hyperglycemia. Thus, we propose that long-term TAC administration up-regulates intestinal GUS-producing bacteria, thereby increasing intestinal GUS enzyme activity, and that increased GUS levels are the cause rather than the consequence of hyperglycemia.
Bacteroidetes and Firmicutes are major sources of GUS. Using metagenomics, we found that TAC led to an increase in the abundance of Bacteroidetes at phylum level compared with that in the control group. The relative abundances of GUS-producing genera Bacteroides, Alistipes, Parabacteroides, Paraprevotella, Dubosiella and Hungatella were significantly increased in the TAC group, but were severely depleted by vancomycin combination treatment. In line with our results, Han, et al. has reported that the phylum Bacteroidetes and genus Bacteroides and Helicobacter were significantly increased in TAC-treated diabetic mice.Citation57 The genera Bacteroides and Alistipes were significantly enriched in TAC-induced hyperglycemia mice were also reported.Citation34 16S rRNA amplicon sequencing revealed that vancomycin specifically inhibited the abundance of Bacteroides spp and Roseburia spp.Citation25 Additionally, both intestinal GUS expression and activity were elevated by TAC treatment and decreased by the combination therapy with vancomycin.
Gut microbiota derived metabolites play an important role in maintaining intestinal homeostasis and in modulating the progression of metabolic syndrome and type 2 diabetes (T2D). Butyrate supplementation is an effective strategy for the treatment of T2D.Citation58 Oral butyrate supplementation has been shown to ameliorate TAC-induced PTDM in mice.Citation34 Therefore, we quantified endogenous SCFAs in feces using LC-MS/MS, but no significant difference was observed between the TAC and control groups. This discrepancy may be due to differences in the detection strategies for SCFAs. We used LC-MS/MS, but not GC-MS/MS, for SCFAs quantification. BAs, another important microbiota-derived metabolite, are metabolic integrators that regulate lipid, glucose and energy homeostasis and are novel therapy target for T2D. Bile acid differences between species, particularly in composition, may limit the interpretation of mouse BAs data.Citation59 In the serum and liver tissues, TAC treatment upregulated the levels of most primary and secondary BAs, including CA, CDCA, taurine-CA/CDCA, glycine-CA/CDCA, DCA, UDCA, HDCA, glycine-DCA and taurine-DCA. Previous research also demonstrated that TAC affects bile flow in rats in a dose-dependent manner, and high dosage of TAC induced cholestasis by significantly increasing CA, CDCA, and HDCA levels in bile and liver.Citation60 It’s worth noting that LCA and α/β-MCA levels were not affected by either TAC treatment, further proving that the hydrolysis effect of GUS on glucuronidation was the cause of the change in BAs. There were significant differences in the efficiency of different microbial GUS enzyme ortholog for the disposal of BAs and other substrates. In adult specimens, DCA, CA, CDCA and their taurine/glycine conjugates account for approximately 80% of the total bile acid -glucuronides. Some minor bile acids such as HDCA 6α-O-glucuronide and UDCA 3α-O-glucuronide, can also be detected.Citation61 However, neither amidated nor nonamidated types of LCA- glucuronide have been found.Citation61,Citation62 Single glucuronic acid was attached to BA by the UGT enzyme in the liver and intestine. The formed BA O- or S- glucuronides can then be transferred to the intestine and deconjugated by GUS enzyme. We suggest that long-term TAC therapy upregulates GUS-producing bacteria, thereby elevating GUS enzyme expression and activity. An increase in the GUS enzyme, which could liberate the BAs from BA O- or S- glucuronide conjugates, resulted in enhance BAs levels. Correlation analysis also demonstrated a significant positive correlation between the relative abundance of TAC induced GUS-enriched bacteria and BAs levels.
BAs are ligands for FXR and TGR5. GLP-1 is a key incretin that regulates blood glucose homeostasis, and is regulated by TGR5 and FXR. The primary source of circulating GLP-1 is enteroendocrine L cells.Citation63 Our data suggest that ileal GLP-1 expression and serum GLP-1 levels were markedly reduced by TAC treatment, vancomycin promoted ileal and serum GLP-1 production. Activation of TGR5 in L-cells triggered the secretion of GLP-1, while FXR exerted an inhibition effect on L-cells GLP-1 production.Citation64 Ileal FXR signaling was strongly activated by TAC and decreased after combination therapy with vancomycin. Accordingly, CDCA, CA, DCA and TCDCA have been reported as agonists of FXR in vitro and in vivo and the activation of FXR signaling in the intestine leads to the blockade of GLP-1 secretion.Citation65,Citation66
Our study has several limitations. Firstly, we did not perform fecal microbiota transplantation (FMT) to ensure the intestinal bacterial GUS enzyme, rather than host GUS enzyme, is the cause of TAC-induced PTDM. Secondly, vancomycin, a broad-spectrum Gram-positive antibiotic, cannot be used with TAC for long-term in clinical. Our future work will focus on exploring more reliable and effective ways to target and modulate GUS activity. Whether inhibiting bacterial GUS enzymes through the specific bacterial strain transplantation could prevent TAC-induced PTDM. Moreover, the effect of blocking the key bile acids or bile acid-glucuronides, which could be regulated by intestinal GUS enzymes, on TAC-induced PTDM will be addressed in our future studies. Lastly, our study demonstrates the importance of GUS enzyme in murine models, but the relevance of fecal GUS activity to TAC-induced diabetes of transplant patients will need to be analyzed in prospective human studies.
In summary, we provide experimental evidence that the targeted elimination of GUS activity by vancomycin can restore BAs hemostasis, which is greatly enhanced by TAC treatment, thereby increasing GLP-1 secretion and minimizing the risk of hyperglycemia. These results suggest that reducing GUS enzymes by interfering with GUS-producing bacteria may be a novel clinical approach to prevent PTDM, without altering the immunosuppressive regimens.
Author contributions
Shaojun Shi, and Yani Liu conceptualized the study and designed the research. Peixia Li and Rui Zhang organized all in vivo and in vitro studies and critically discussed of the results. Peixia Li and Rui Zhang performed the experiments and the overall analysis. Jingping Zhou and Pengpeng Guo contributed to the animal experiments. Peixia Li and Shaojun Shi wrote and revised the manuscript with the input of other coauthors.
Materials & correspondence
Correspondence and requests for materials should be addressed to Yani Liu or Shaojun Shi.
Supplemental Material
Download Zip (5.1 MB)Disclosure statement
The authors declare that the research was conducted in the absence of any commercial or financial relationships that could be construed as potential conflicts of interest.
Data availability statement
The datasets used and analyzed during the current study are available from the corresponding author on reasonable request.
Supplementary material
Supplemental data for this article can be accessed online at https://doi.org/10.1080/19490976.2024.2310277
Additional information
Funding
References
- Werzowa J, Hecking M, Haidinger M, Doeller D, Sharif A, Tura A, Säemann MD. The diagnosis of posttransplantation diabetes mellitus: meeting the challenges. Curr Diab Rep. 2015;15(5):15. doi:10.1007/s11892-015-0601-x.
- Shivaswamy V, Boerner B, Larsen J. Post-transplant diabetes mellitus: causes, treatment, and impact on outcomes. Endocr Rev. 2016;37(1):37–23. doi:10.1210/er.2015-1084.
- Ahmed SH, Biddle K, Augustine T, Azmi S. Post-Transplantation Diabetes Mellitus. Diabetes Ther. 2020;11(4):779–801. doi:10.1007/s13300-020-00790-5.
- Chevallier E, Jouve T, Rostaing L, Malvezzi P, Noble J. Pre-existing diabetes and PTDM in kidney transplant recipients: how to handle immunosuppression. Expert Rev Clin Pharmacol. 2021;14(1):55–66. doi:10.1080/17512433.2021.1851596.
- Kotha S, Lawendy B, Asim S, Gomes C, Yu J, Orchanian-Cheff A, Tomlinson G, Bhat M. Impact of immunosuppression on incidence of post-transplant diabetes mellitus in solid organ transplant recipients: systematic review and meta-analysis. World J Transplant. 2021;11(10):432–442. doi:10.5500/wjt.v11.i10.432.
- Tong L, Li W, Zhang Y, Zhou F, Zhao Y, Zhao L, Liu J, Song Z, Yu M, Zhou C. et al. Tacrolimus inhibits insulin release and promotes apoptosis of Min6 cells through the inhibition of the PI3K/Akt/mTOR pathway. Mol Med Rep. 2021;24(3):24. doi:10.3892/mmr.2021.12297.
- Rostambeigi N, Lanza IR, Dzeja PP, Deeds MC, Irving BA, Reddi HV, Madde P, Zhang S, Asmann YW, Anderson JM. et al. Unique Cellular and Mitochondrial Defects Mediate FK506-Induced Islet β-Cell Dysfunction. Transplantation. 2011;91(6):615–623. doi:10.1097/TP.0b013e3182094a33.
- Rodriguez-Rodriguez AE, Donate-Correa J, Rovira J, Cuesto G, Luis-Ravelo D, Fernandes MX, Acevedo-Arozena A, Diekmann F, Acebes A, Torres A. et al. Inhibition of the mTOR pathway: a new mechanism of β cell toxicity induced by tacrolimus. Am J Transplant. 2019;19(12):3240–3249. doi:10.1111/ajt.15483.
- Trinanes J, ten Dijke P, Groen N, Hanegraaf M, Porrini E, Rodriguez-Rodriguez AE, Drachenberg C, Rabelink TJ, de Koning E, Carlotti F. et al. Tacrolimus-induced BMP/SMAD signaling associates with metabolic stress–activated FOXO1 to trigger β-cell failure. Diabetes. 2020;69(2):193–204. doi:10.2337/db19-0828.
- Ling Q, Huang H, Han Y, Zhang C, Zhang X, Chen K, Wu L, Tang R, Zheng Z, Zheng S. et al. The tacrolimus-induced glucose homeostasis imbalance in terms of the liver: from bench to bedside. Am J Transplant. 2020;20(3):701–13. doi:10.1111/ajt.15665.
- Prytula A, van Gelder T. Clinical aspects of tacrolimus use in paediatric renal transplant recipients. Pediatr Nephrol. 2019;34(1):31–43. doi:10.1007/s00467-018-3892-8.
- Iwasaki K. Metabolism of tacrolimus (FK506) and recent topics in clinical pharmacokinetics. Drug Metab Pharmacokinet. 2007;22(5):328–35. doi:10.2133/dmpk.22.328.
- Rowland A, Miners JO, Mackenzie PI. The UDP-glucuronosyltransferases: their role in drug metabolism and detoxification. Int J Biochem Cell Biol. 2013;45(6):1121–32. doi:10.1016/j.biocel.2013.02.019.
- Laverdiere I, Caron P, Harvey M, Levesque E, Guillemette C. In Vitro Investigation of Human UDP-Glucuronosyltransferase Isoforms Responsible for Tacrolimus Glucuronidation: Predominant Contribution of UGT1A4. Drug Metab Dispos. 2011;39(7):1127–1130. doi:10.1124/dmd.111.039040.
- Tron C, Rayar M, Petitcollin A, Beaurepaire J-M, Cusumano C, Verdier M-C, Houssel-Debry P, Camus C, Boudjema K, Bellissant E. et al. A high performance liquid chromatography tandem mass spectrometry for the quantification of tacrolimus in human bile in liver transplant recipients. J Chromatogr A. 2016;1475:55–63. doi:10.1016/j.chroma.2016.10.075.
- Xie D, Guo J, Dang R, Li Y, Si Q, Han W, Wang S, Wei N, Meng J, Wu L. et al. The effect of tacrolimus-induced toxicity on metabolic profiling in target tissues of mice. BMC Pharmacol Toxicol. 2022;23(1):23. doi:10.1186/s40360-022-00626-x.
- Rangel EB. Tacrolimus in pancreas transplant: a focus on toxicity, diabetogenic effect and drug-drug interactions. Expert Opin Drug Metab Toxicol. 2014;10:1585–1605. doi:10.1517/17425255.2014.964205.
- Tukey RH, Strassburg CP. Human UDP-glucuronosyltransferases: Metabolism, expression, and disease. Annu Rev Pharmacol Toxicol. 2000;40(1):581–616. doi:10.1146/annurev.pharmtox.40.1.581.
- Pellock SJ, Redinbo MR. Glucuronides in the gut: Sugar-driven symbioses between microbe and host. J Biol Chem. 2017;292(21):8569–76. doi:10.1074/jbc.R116.767434.
- Hagenfeldt L, Wahlberg F. Serum β-glucuronidase, glucose tolerance, and atherosclerotic disease. Lancet. 1965;285(7389):788–789. doi:10.1016/S0140-6736(65)92959-4.
- Imanshahidi M, Hosseinzadeh H. Pharmacological and therapeutic effects of berberis vulgaris and its active constituent, berberine. Phytother Res. 2008;22(8):999–1012. doi:10.1002/ptr.2399.
- Liu L, Deng YX, Yu S, Lu SS, Xie L, Liu XD. Berberine attenuates intestinal disaccharidases in streptozotocin-induced diabetic rats. Pharmazie. 2008;63:384–388.
- Wallace BD, Wang H, Lane KT, Scott JE, Orans J, Koo JS, Venkatesh M, Jobin C, Yeh L-A, Mani S. et al. Alleviating cancer drug toxicity by inhibiting a bacterial enzyme. Sci. 2010;330(6005):831–5. doi:10.1126/science.1191175.
- Bhatt AP, Pellock SJ, Biernat KA, Walton WG, Wallace BD, Creekmore BC, Letertre MM, Swann JR, Wilson ID, Roques JR. et al. Targeted inhibition of gut bacterial β-glucuronidase activity enhances anticancer drug efficacy. Proc Natl Acad Sci USA. 2020;117(13):7374–7381. doi:10.1073/pnas.1918095117.
- Taylor MR, Flannigan KL, Rahim H, Mohamud A, Lewis IA, Hirota SA, Greenway SC. Vancomycin relieves mycophenolate mofetil–induced gastrointestinal toxicity by eliminating gut bacterial β-glucuronidase activity. Sci Adv. 2019;5(8):5. doi:10.1126/sciadv.aax2358.
- Howard EJ, Lam TKT, Duca FA. The Gut Microbiome: Connecting Diet, Glucose Homeostasis, and Disease. Annu Rev Med. 2022;73(1):469–81. doi:10.1146/annurev-med-042220-012821.
- Lee J-Y, Tsolis RM, Baumler AJ. GUT PHYSIOLOGY the microbiome and gut homeostasis. Sci. 2022;377(6601):44±. doi:10.1126/science.abp9960.
- Canfora EE, Meex RCR, Venema K, Blaak EE. Gut microbial metabolites in obesity, NAFLD and T2DM. Nat Rev Endocrinol. 2019;15(5):261–73. doi:10.1038/s41574-019-0156-z.
- Cani PD, Amar J, Iglesias MA, Poggi M, Knauf C, Bastelica D, Neyrinck AM, Fava F, Tuohy KM, Chabo C. et al. Metabolic endotoxemia initiates obesity and insulin resistance. Diabetes. 2007;56(7):1761–72. doi:10.2337/db06-1491.
- Palmnas-Bedard MSA, Costabile G, Vetrani C, Aberg S, Hjalmarsson Y, Dicksved J, Riccardi G, Landberg R. The human gut microbiota and glucose metabolism: a scoping review of key bacteria and the potential role of SCFAs. Am J Clin Nutr. 2022;116(4):862–874. doi:10.1093/ajcn/nqac217.
- Han H, Yi B, Zhong R, Wang M, Zhang S, Ma J, Yin Y, Yin J, Chen L, Zhang H. et al. From gut microbiota to host appetite: gut microbiota-derived metabolites as key regulators. Microbiome. 2021;9(1). doi:10.1186/s40168-021-01093-y.
- Luo J, Yang H, Song B-L. Mechanisms and regulation of cholesterol homeostasis. Nat Rev Mol Cell Biol. 2020;21(4):225–45. doi:10.1038/s41580-019-0190-7.
- Ahmad TR, Haeusler RA. Bile acids in glucose metabolism and insulin signalling — mechanisms and research needs. Nat Rev Endocrinol. 2019;15(12):701–712. doi:10.1038/s41574-019-0266-7.
- Jiao W, Zhang Z, Xu Y, Gong L, Zhang W, Tang H, Zeng S, Zhang Q, Sun Z, Liu L. et al. Butyric acid normalizes hyperglycemia caused by the tacrolimus-induced gut microbiota. Am J Transplant. 2020;20(9):2413–24. doi:10.1111/ajt.15880.
- Le J, Zhang X, Jia W, Zhang Y, Luo J, Sun Y, Ye J. Regulation of microbiota–GLP1 axis by sennoside A in diet-induced obese mice. Acta Pharm Sin B. 2019;9(4):758–768. doi:10.1016/j.apsb.2019.01.014.
- Mooli RGR, Mukhi D, Pasupulati AK, Evers SS, Sipula IJ, Jurczak M, Seeley RJ, Shah YM, Ramakrishnan SK. Intestinal HIF-2α Regulates GLP-1 Secretion via Lipid Sensing in L-Cells. Cell Mol Gastroenterol Hepatol. 2022;13(4):1057–1072. doi:10.1016/j.jcmgh.2021.12.004.
- Schmidt J, Rattner DW, Lewandrowski K, Compton CC, Mandavilli U, Knoefel WT, WARSHAW AL. A better model of acute pancreatitis for evaluating therapy. Ann Surg. 1992;215(1):44–56. doi:10.1097/00000658-199201000-00007.
- Chen M, Cheng K-W, Chen Y-J, Wang C-H, Cheng T-C, Chang K-C, Kao A-P, Chuang K-H. Real-time imaging of intestinal bacterial β-glucuronidase activity by hydrolysis of a fluorescent probe. Sci Rep. 2017;7(1):3142. doi:10.1038/s41598-017-03252-4.
- Cheng K-W, Tseng C-H, Chen IJ, Huang B-C, Liu H-J, Ho K-W, Lin W-W, Chuang C-H, Huang M-Y, Leu Y-L. et al. Inhibition of gut microbial β-glucuronidase effectively prevents carcinogen-induced microbial dysbiosis and intestinal tumorigenesis. Pharmacol Res. 2022;177:177. doi:10.1016/j.phrs.2022.106115.
- Jin Y-Y, Shi Z-Q, Chang W-Q, Guo L-X, Zhou J-L, Liu J-Q, Liu L-F, Xin G-Z. A chemical derivatization based UHPLC-LTQ-Orbitrap mass spectrometry method for accurate quantification of short-chain fatty acids in bronchoalveolar lavage fluid of asthma mice. J Pharmaceut Biomed. 2018;161:336–343. doi:10.1016/j.jpba.2018.08.057.
- Smith PK, Krohn RI, Hermanson GT, Mallia AK, Gartner FH, Provenzano MD, Fujimoto EK, Goeke NM, Olson BJ, Klenk DC. et al. Measurement of protein using bicinchoninic acid. Anal Biochem. 1985;150(1):76–85. doi:10.1016/0003-2697(85)90442-7.
- Zheng CL, Wang C, Zhang T, Li D, Ni XF, Lin JH, Sun L, Chen B. Exploring the Mechanism of Skeletal Muscle in a tacrolimus-induced posttransplantation diabetes mellitus Model on gene expression profiles. J Diabetes Res. 2020;2020:1–11. doi:10.1155/2020/6542346.
- Zhang L, He Y, Wu C, Wu M, Chen X, Luo J, Cai Y, Xia P, Chen B. Altered expression of glucose metabolism associated genes in a tacrolimus‑induced post‑transplantation diabetes mellitus in rat model. Int J Mol Med. 2019;44:1495–1504. doi:10.3892/ijmm.2019.4313.
- Pollet RM, D’Agostino EH, Walton WG, Xu Y, Little MS, Biernat KA, Pellock SJ, Patterson LM, Creekmore BC, Isenberg HN. et al. An atlas of β-glucuronidases in the human intestinal microbiome. Structure. 2017;25(7):967–977.e5. doi:10.1016/j.str.2017.05.003.
- Yip LY, Aw CC, Lee SH, Hong YS, Ku HC, Xu WH, Chan JMX, Cheong EJY, Chng KR, Ng AHQ. et al. The liver–gut microbiota axis modulates hepatotoxicity of tacrine in the rat. Hepatology. 2018;67(1):282–295. doi:10.1002/hep.29327.
- Cani PD, Bibiloni R, Knauf C, Waget A, Neyrinck AM, Delzenne NM, Burcelin R. Changes in gut microbiota control metabolic endotoxemia-induced inflammation in high-fat diet–induced obesity and diabetes in mice. Diabetes. 2008;57(6):1470–1481. doi:10.2337/db07-1403.
- Dongxu CUI, Shaolong SUN, Xiaobo Z, Shuodong WU, Xianwei DAI. Experimental research of blood cell releasing beta-glucuronidase regulated by endotoxin. China J Modern Med. 2008;18:283–285.
- Criswell DS, Henry KM, DiMarco NM, Grossie VB. Chronic exercise and the pro-inflammatory response to endotoxin in the serum and heart. Immunol Lett. 2004;95(2):213–20. doi:10.1016/j.imlet.2004.07.012.
- 민계식. Effects of cholic Acid/CDCA and FGF-19 on the protein levels of the endogenous small heterodimer partner (SHP) in the mouse liver and HepG2 cells. Journal Of Life Science. 2009;19(12):1731–1736. doi:10.5352/JLS.2009.19.12.1731.
- Kong B, Wang L, Chiang JYL, Zhang YC, Klaassen CD, Guo GL. Mechanism of tissue-specific farnesoid X receptor in suppressing the expression of genes in bile-acid synthesis in mice. Hepatology. 2012;56(3):1034–43. doi:10.1002/hep.25740.
- Jenssen T, Hartmann A. Post-transplant diabetes mellitus in patients with solid organ transplants. Nat Rev Endocrinol. 2019;15(3):172–88. doi:10.1038/s41574-018-0137-7.
- Jenssen T, Hartmann A. Emerging treatments for post-transplantation diabetes mellitus. Nat Rev Nephrol. 2015;11(8):465–77. doi:10.1038/nrneph.2015.59.
- Vrieze A, Out C, Fuentes S, Jonker L, Reuling I, Kootte RS, van Nood E, Holleman F, Knaapen M, Romijn JA. et al. Impact of oral vancomycin on gut microbiota, bile acid metabolism, and insulin sensitivity. J Hepatol. 2014;60(4):824–31. doi:10.1016/j.jhep.2013.11.034.
- Basolo A, Hohenadel M, Ang QY, Piaggi P, Heinitz S, Walter M, Walter P, Parrington S, Trinidad DD, von Schwartzenberg RJ. et al. Effects of underfeeding and oral vancomycin on gut microbiome and nutrient absorption in humans. Nat Med. 2020;26(4):589–598. doi:10.1038/s41591-020-0801-z.
- Zarrinpar A, Chaix A, Xu ZZ, Chang MW, Marotz CA, Saghatelian A, Knight R, Panda S. Antibiotic-induced microbiome depletion alters metabolic homeostasis by affecting gut signaling and colonic metabolism. Nat Commun. 2018;9(1):2872. doi:10.1038/s41467-018-05336-9.
- Zacarias MF, Carmen Collado M, Gomez-Gallego C, Flinck H, Aittoniemi J, Isolauri E, Salminen S. Pregestational overweight and obesity are associated with differences in gut microbiota composition and systemic inflammation in the third trimester. PloS ONE. 2018;13(7):13. doi:10.1371/journal.pone.0200305.
- Han Y, Jiang X, Ling Q, Wu L, Wu P, Tang R, Xu X, Yang M, Zhang L, Zhu W. et al. Antibiotics-mediated intestinal microbiome perturbation aggravates tacrolimus-induced glucose disorders in mice. Front Med. 2019;13(4):471–81. doi:10.1007/s11684-019-0686-8.
- Roshanravan N, Alamdari NM, Jafarabadi MA, Mohammadi A, Shabestari BR, Nasirzadeh N, Asghari S, Mansoori B, Akbarzadeh M, Ghavami A. et al. Effects of oral butyrate and inulin supplementation on inflammation-induced pyroptosis pathway in type 2 diabetes: a randomized, double-blind, placebo-controlled trial. Cytokine. 2020;131:131. doi:10.1016/j.cyto.2020.155101.
- Li J, Dawson PA. Animal models to study bile acid metabolism. Bba-mol Basis Dis. 2019;1865(5):895–911. doi:10.1016/j.bbadis.2018.05.011.
- Mizuta K, Kobayashi E, Uchida H, Hishikawa S, Kawarasaki H. Increase of bile acid production by tacrolimus in the rat liver. Transplant Proc. 2003;35(1):437–438. doi:10.1016/S0041-1345(02)03794-6.
- Muto Y, Suzuki M, Kakiyama G, Sasaki T, Murai T, Takei H, Nittono H. Profiling of urinary glucuronidated bile acids across age groups. Metabolites. 2022;12(12):12. doi:10.3390/metabo12121230.
- Radominska-Pandya A, Little JM, Pandya JT, Tephly TR, King CD, Barone GW, Raufman J-P. UDP-glucuronosyltransferases in human intestinal mucosa. Biochimica Et Biophysica Acta-Lipids And Lipid Metab. 1998;1394(2–3):199–208. doi:10.1016/S0005-2760(98)00115-5.
- Gribble FM, Reimann F. Metabolic Messengers: glucagon-like peptide 1. Nat Metab. 2021;3(2):142–148. doi:10.1038/s42255-020-00327-x.
- Perino A, Demagny H, Velazquez-Villegas L, Schoonjans K. Molecular Physiology of Bile Acid Signaling in Health, disease, and aging. Physiol Rev. 2021;101(2):683–731. doi:10.1152/physrev.00049.2019.
- Trabelsi M-S, Daoudi M, Prawitt J, Ducastel S, Touche V, Sayin SI, Perino A, Brighton CA, Sebti Y, Kluza J. et al. Farnesoid X receptor inhibits glucagon-like peptide-1 production by enteroendocrine L cells. Nat Commun. 2015;6(1):6. doi:10.1038/ncomms8629.
- Zhang S-Y, Li RJW, Lim Y-M, Batchuluun B, Liu H, Waise TMZ, Lam TKT. FXR in the dorsal vagal complex is sufficient and necessary for upper small intestinal microbiome-mediated changes of TCDCA to alter insulin action in rats. Gut. 2021;70(9):1675–1683. doi:10.1136/gutjnl-2020-321757.