
ABSTRACT
Gut microbiota and related metabolites are both crucial factors that significantly influence how individuals with Crohn’s disease respond to immunotherapy. However, little is known about the interplay among gut microbiota, metabolites, Crohn’s disease, and the response to anti-α4β7-integrin in current studies. Our research utilized 2,4,6-trinitrobenzene sulfonic acid to induce colitis based on the humanized immune system mouse model and employed a combination of whole-genome shotgun metagenomics and non-targeted metabolomics to investigate immunotherapy responses. Additionally, clinical cases with Crohn’s disease initiating anti-α4β7-integrin therapy were evaluated comprehensively. Particularly, 16S-rDNA gene high-throughput sequencing and targeted bile acid metabolomics were conducted at weeks 0, 14, and 54. We found that anti-α4β7-integrin therapy has shown significant potential for mitigating disease phenotypes in remission-achieving colitis mice. Microbial profiles demonstrated that not only microbial composition but also microbially encoded metabolic pathways could predict immunotherapy responses. Metabonomic signatures revealed that bile acid metabolism alteration, especially elevated secondary bile acids, was a determinant of immunotherapy responses. Especially, the remission mice significantly enriched the proportion of the beneficial Lactobacillus and Clostridium genera, which were correlated with increased gastrointestinal levels of BAs involving lithocholic acid and deoxycholic acid. Moreover, most of the omics features observed in colitis mice were replicated in clinical cases. Notably, anti-α4β7 integrin provided sustained therapeutic benefits in clinical remitters during follow-up, and long-lasting remission was linked to persistent changes in the microbial-related bile acids. In conclusion, gut microbiota-mediated bile acid metabolism alteration could play a crucial role in regulating immunotherapy responses to anti-α4β7-integrin in Crohn’s disease. Therefore, the identification of prognostic microbial signals facilitates the advancement of targeted probiotics that activate anti-inflammatory bile acid metabolic pathways, thereby improving immunotherapy responses. The integrated multi-omics established in our research provide valuable insights into potential mechanisms that impact treatment responses in complex diseases.
1. Introduction
Crohn’s disease (CD) is a persistent inflammatory condition affecting the gastrointestinal tract characterized by a relapsing and remitting pattern of symptom manifestation.Citation1 This condition arises from the interplay of genetic vulnerability, environmental influences, and gut microbiota, culminating in an atypical immune reaction of the mucosal lining and impairment of epithelial barricade integrity.Citation2 Current therapeutic strategies focus on achieving deep and long-lasting remission in order to prevent complications and halt the progressive course of the disease. The treatment for CD has made significant advancements in the past three decades. Anti-tumor necrosis factor (TNF) medications have been the mainstay of treatment until recently. A new class of medications, including anti-α4β7-integrin, has been developed to prevent leukocytes from homing to the digestive tract.Citation3
Currently, vedolizumab (VDZ) is the only authorized medication for the induction and maintenance treatment of CD targeting anti-α4β7-integrin.Citation4 VDZ, a humanized IgG1 monoclonal antibody, effectively prevents leukocytes from attaching to the intestinal endothelium, where mucosal addressin cell adhesion molecule-1 (MAdCAM-1) is expressed.Citation5 In clinical studies, around 30% of CD patients have achieved remission with VDZ, and this percentage was lower for patients who had previously received anti-TNFs.Citation6 Even so, over a period of two years, patients with CD show continuous improvement, highlighting the importance of predicting the individuals who are expected to exhibit a favorable response to VDZ prior to its discontinuation.Citation7 The main mechanism by which VDZ is assumed to act is by preventing extravasation of α4β7+ T effector/memory cells into the intestinal mucosae. However, it should be noted that saturation of α4β7 receptors does not always correlate with response to VDZ, suggesting that α4β7 blockade may not fully account for the mechanism of VDZ action.Citation8,Citation9 A recent study discovered that utilizing the anti-VDZ antibodies to predict treatment responses yielded no significant results. This finding further emphasizes the distinctive mode of action associated with VDZ.Citation8 Consequently, our research focused on generating novel biomarkers and related potential mechanisms to regulate immunotherapy responses in CD.
Gut microecological dysbiosis has been observed in CD, characterized by a decrease in pro-inflammatory bacteria and an increase in anti-inflammatory bacteria.Citation10 Specifically, approximately one-third of patients with CD exhibit a higher abundance of mucosa-associated adherent-invasive Escherichia coli, which possess the ability to breach the protective mucosal layer, attach to and invade cells lining the intestines, and persist and multiply in macrophages.Citation11,Citation12 Furthermore, individuals with CD show a reduction in Faecalibacterium prausnitzii, a commensal bacterium known for its anti-inflammatory properties.Citation13,Citation14 Recently, in a prospective analysis of CD patients who initiated anti-α4β7-integrin therapy, the researchers investigated the gut microbiota composition at baseline to predict treatment responses. The results showed that the abundance of Roseburia inulinivorans and Burkholderiales sp. was higher at baseline among CD patients who attained remission by week 14. Additionally, the remission patients had significantly higher community α-diversity but lower β-diversity compared to non-remission patients.Citation15 Thus, baseline abundance differences in gut microbiota are associated with treatment responses. However, it remains unclear how specific microbes and the small molecules they regulate may interact to predict immunotherapy responses in CD.
A novel method called metabolic phenotyping using high-resolution spectroscopy has been developed to assess the potential function of enteric microbes. Metabolomics, as an extension of transcriptomics and proteomics, is an omics field closely linked to the phenotype and capable of accurately and directly representing an organism’s physiological state. Broadly, gut metabolite profiles are formed through a combination of dietary factors, modified metabolites, and compounds produced by microorganisms. These profiles have a significant impact on the interactions between the microbiota and the metabolite.Citation16 Gut microbiota have the ability to modify pools of available metabolites, thus altering host-generated signaling molecules. A comparison of serum metabolomics between germ-free and conventional mice revealed that a significant number of metabolites are attributed to the gut microbiota.Citation17 Especially within the intestinal tract, gut microbiota performs enzymatic reactions that bio-transform bile acids (BAs). BAs are synthesized by the liver and subsequently carried into the intestine, where they undergo binding with glycine or taurine amino acids. The gut microbiota reacts enzymically to BAs in two steps. Initially, taurine or glycine is hydrolyzed by BA hydrolase,Citation18 followed by hydroxysteroid dehydrogenation (transformation), resulting in the production of secondary BAs.Citation19 Hence, intestinal microbial dysregulation associated with CD may contribute to BA metabolic disorders. Besides their acknowledged role in metabolic functions, BAs have also demonstrated their own anti-inflammatory properties. For instance, they possess the ability to inhibit NF-κB, thereby suppressing the synthesis of pro-inflammatory cytokines in monocytes and macrophages.Citation20–22 This suggests that any disruption in the metabolism of BAs could have an important impact on the development and characteristics of CD.
As shown above, we hypothesized that the gut microbiome and metabolome might contribute to a comprehensive predictive model that has the potential to improve predictive capacity. We utilized 2,4,6-trinitrobenzene sulfonic acid (TNBS) to induce colitis based on the humanized immune system mouse model and employed a combination of whole-genome shotgun metagenomics and non-targeted metabolomics to investigate treatment responses. Additionally, clinical cases with CD initiating anti-α4β7-integrin therapy were evaluated comprehensively. Particularly, 16S-rDNA gene high-throughput sequencing and targeted BA metabolomics were conducted at weeks 0, 14, and 54. Our study findings demonstrated that anti-α4β7-integrin therapy has shown significant potential for mitigating the disease phenotypes in humanized mice with colitis that have achieved remission. Microbial profiles demonstrated that not only microbial composition but also microbially encoded metabolic pathways could predict immunotherapy responses. Metabonomic signatures revealed that BA metabolism alteration, especially elevated secondary BAs, was a determinant of immunotherapy responses. Moreover, most of the omics features observed in colitis mice were replicated in clinical cases. Notably, anti-α4β7 integrin provided sustained therapeutic benefits in clinical remitters during follow-up, and long-lasting remission was linked to persistent alterations in the microbial-related BAs. Therefore, the comprehensive multi-omics established in this study revealed that gut microbiota-mediated BA metabolism alteration could regulate immunotherapy responses to anti-α4β7-integrin in CD.
2. Materials and methods
2.1. Humanized immune system mouse model
Previous studies have demonstrated significant variability in the penetrance and reproducibility of diseases among genetically identical mice, both within and between mouse facilities.Citation23–25 Specific-pathogen-free protocols have been effectively utilized to mitigate the potential influence of known bacterial pathogens. However, our understanding of the impact of the various, unidentified symbiotic bacteria present in the native gut microbiota of mice remains limited. For our investigation, we utilized the humanized immune system mouse model because VDZ only affects immunological cells from humans. Female NOD.Cg-PrkdcscidIl2rgem1Smoc mice received human CD34+ hematopoietic stem cells to reconstitute their immune system (Shanghai Model Organism Center, Shanghai, China). After verifying effective engrafting, the mice were sent to our facilities. This mouse model [huHSC-(M-NSG)] is well-established and consists of implanted human immune cells.Citation26,Citation27 Upon arrival, the humanized mice were allowed a period of 7 days to acclimate. If any mice were found to be in poor condition during this period, they were excluded from the study. The mice were housed in groups of five, each in their own vented cage. The environment was pathogen-free and maintained a 12-hour light-dark cycle, constant humidity levels, and a temperature of 23 ± 2°C with 50 ± 20% relative humidity. The experiment was approved by the Animal Care and Welfare Committee of Guangxi Medical University (Approval Number: GXMU202211110).
2.2. TNBS-induced colitis and drug administration
The utilization of TNBS-induced colitis has been extensive in exploring various aspects related to CD due to the similarities in immunological and histopathological characteristics.Citation28 TNBS was sourced from Sigma-Aldrich (Cat #40–4700; MO, USA), while VDZ was obtained from Takeda Pharmaceuticals (Cat #28713; Tokyo, Japan). Following a period of 7 days for acclimatization, a randomized assignment was made for mice into the following three groups: i. Control: Humanize mouse model huHSC-(M-NSG), disease control (n = 8); ii. Model: Humanize mouse model huHSC-(M-NSG) + TNBS (n = 8); iii. VDZ-treated: Humanize mouse model huHSC-(M-NSG) + TNBS + VDZ (n = 16). To induce colitis, TNBS was administered to the humanized mice using the method described in the previous study.Citation29 In a nutshell, mice that had been fasting for 24 hours had their colons injected with 100 μl of 2.5% (wt/v) TNBS in 50% ethanol seven days after the mice had their skin pre-sensitized with 150 μl of 1% (wt/v) TNBS-olive oil-acetone solution. Healthy mice received an equal amount of phosphate-buffered saline (PBS). According to the published study, VDZ had a clinically delayed effect, so it was first injected intraperitoneally at a dose of 50 mg/kg two days before the start of TNBS induction for pre-treatment, and then at a dose of 30 mg/kg on days 0 and 4 of the trial.Citation30 The control group and model group received the same volume of PBS. Subsequently, the colitis mice treated with VDZ were categorized into the remission group and the non-remission group according to whether pathological symptoms of TNBS-induced colitis, colonic inflammation, and intestinal barrier disruption were improved. Stool samples were collected at baseline for whole-genome shotgun metagenomics, and serum samples were collected for non-targeted metabolomics before initiating treatment. On the 7th day, mice were sacrificed under anesthesia, and relevant samples were collected.
2.3. Evaluation of the general situation
The animals were monitored daily to assess their status. Daily weight measurements were taken for the mice, and any signs of occult or extensive rectal bleeding, as well as the consistency of their stools, were recorded. The disease activity index (DAI), which is calculated daily for each laboratory animal, is generated by dividing the total number of these scores by 3, as previously described.Citation31 After euthanizing the mice, quick cutting of the intestinal tract allowed for the observation and recording of intestinal injury, which enabled the evaluation of the colonic mucosa injury index (CMDI) score following established protocols.Citation32 Finally, a portion of the distal colon, which had a length of 1 cm, was obtained for histological assessment, immunohistochemistry, and immunofluorescence staining. The colon that remained was promptly frozen using liquid nitrogen for molecular analysis. Blood was drawn from a small cut on the tail, and the serum was also frozen for further testing of inflammation cytokines.
2.4. Histological assessment
The colon tissue was immobilized overnight using a 4% solution of paraformaldehyde. It was embedded with paraffin wax, then sliced into sections with a thickness of 4 μm and stained with hematoxylin and eosin. Subsequently, according to a recognized standard to assess inflammation-related histological scores.Citation33
2.5. Immunofluorescence staining
In accordance with the standard protocol, the samples were incubated with primary antibodies including CD3 (Cat #MA5–12577), CD68 (Cat #MA5–13324), ZO-1 (Cat #61–7300), occludin (Cat #40–4700), and claudin-1 (Cat #PA5–16833) overnight at 4°C. After washing with PBS, they were then probed with secondary antibodies (Cat #A11005, Cat #A27034, and Cat #A11012) for 1 hour at 37°C. All the antibodies were obtained from Invitrogen (CA, USA). The samples were examined with laser scanning confocal microscopy (Leica, Wetzlar, Germany) after being counterstained with DAPI.
2.6. Immunohistochemistry
The experiment involved incubating the samples with the primary antibody of MPO (Cat #PA5–16672) at 37°C for 1 hour. Following this, the slides received two washes in PBS and were subsequently incubated with the secondary antibody (Cat #A24531). Finally, they were counterstained with hematoxylin, dehydrated using an ascending alcohol series, and mounted with cover slides. Both antibodies were provided by Invitrogen (CA, USA). The cell counting was conducted using the FIJI ImageJ software (version 2.9.0).
2.7. Measurement of inflammation cytokines
The levels of human forms of serum TNF-α, interferon (IFN)-γ, interleukin (IL)-6, and IL-10 were quantitatively determined using enzyme-linked immunosorbent assay (ELISA) kits from R&D Systems (MN, USA). The manufacturer’s instructions were followed to ensure accurate measurements. The concentration in the sample was determined by measuring the absorbance at a wavelength of 450 nm using the microplate reader manufactured by BioTek Instruments (VT, USA). The standard curve was used as a reference for this measurement.
2.8. Real-time quantitative polymerase chain reaction (RT-qPCR)
Following the manufacturer’s instructions, the RNA was extracted from colon tissue by the TRIzol reagent. The RNA concentration was determined by spectrophotometry at 260 nm. Complementary DNA was obtained by performing reverse transcription using the PrimeScript RT reagent with the gDNA Eraser (Cat #RR047A). RT-qPCR was performed using the Tli RNase H Plus reagent (Cat #RR820A) on an ABI 7500 system (Applied Biosystems, CA, USA). All the reagents and primer synthesis were derived from Takara Biotechnology (Shiga, Japan). The primer sequences utilized in this study can be found in Table S1. The 2−ΔΔCt approach was employed for the analysis of RT-qPCR data, utilizing the GAPDH gene expression as an internal reference control.
2.9. Western blot (WB)
Protein extraction and quantification were performed in accordance with the instructions, using the radioimmunoprecipitation assay lysis buffer and the BCA protein assay kit. All necessary reagents for the extraction and determination of proteins were procured from Beyotime Biotechnology (Shanghai, China). SDS-PAGE separation was performed on the lysates, followed by the transfer of the protein to PVDF membranes. After blocking the membranes with 5% milk, incubation was carried out at 4°C overnight using the subsequent primary antibodies: ZO-1 (Cat #NBP1–85046), occludin (Cat #NBP1–87402), claudin-1 (Cat #NBP1–77036), and β-tubulin (Cat #2146). For primary antibodies, the anti-β-tubulin was procured from Cell Signaling Technology (MA, USA), while the rest were acquired from Novus Biologicals (CO, USA). The membranes were rinsed and then subjected to incubation with the secondary antibody (Cat #7074; Cell Signaling Technology). This process took place at room temperature. To visualize the membranes, the Western BrightTM ECL kit (CA, USA) was utilized.
2.10. Whole-genome shotgun metagenomics and data analysis
The QIAamp Fast DNA Stool Mini (Qiagen, Hilden, Germany) is a widely used and reliable kit for isolating genomic DNA from stool samples. The DNA extraction process was carried out according to the instructions. Using the Illumina NovaSeq 6000 platform, metagenomics assays were conducted, generating 8Gb of readings for each sample. The FastQC tool (version 0.11.7) was utilized for sample quality control. Within and between groups, Bray-Curtis dissimilarity (BCD) was estimated at the same taxonomic ranks. The operational classification units (OTUs) were utilized for performing the non-metric multidimensional scaling plot and analysis of similarities. To evaluate the suitability of sample selection at the genetic level and to compare the variations in gene composition among the different groups, the Pan gene curve was constructed. Pan genes refer to the set of genes present in all samples. The analysis of metagenome taxonomic composition was conducted through the employment of the MetaPhlAn3 tool (version 2.7.3). This tool effectively employs a database of marker genes for determining the taxonomic composition. The diversity of each sample at different taxonomic levels, such as phylum, class, order, family, genus, and species, was determined by calculating the diversity index. The top taxonomic categories and pathways were chosen by considering their median relative abundance in all samples. Differential abundance analyses were conducted using the LEfSe algorithm to identify significant taxonomic traits in species.Citation34 Functional annotation was performed by aligning UniGene with the KEGG database.
2.11. Non-targeted metabolomics and data analysis
On the Broad Metabolomics platform, serum metabolomic profiling was conducted to analyze the metabolites using liquid chromatography-mass spectrometry (LC-MS) techniques.Citation35 Retention periods and mass-to-charge ratios were compared to synthetic control chemical mixtures and pooled serum control samples within each sample to identify known metabolites. The TraceFinder software (version 3.0) was used to process these metabolites, while the Progenesis QI program (version 1.0) was used for processing the untargeted datasets. The metabolite profiles were log-transformed prior to analysis and standardized using the relative LC-MS peak areas. After removing features that did not match internal reference standards described by the Broad Institute methods and those that were present in our cohort less than 50% of the time, the remaining distinct metabolite features were selected for further analysis.
2.12. Correlation analysis between two omics features
The relationship between gut microbiota and metabolites was evaluated using previous methods.Citation36 The KEGG functional relative abundance histograms of the gut microbiota in each group at levels 2 and EC were used to verify the association of the microbiota with metabolites and bile saline hydrolases, respectively. The Sankey diagram was created to visually depict the correlation, while the Chord diagram was created to assess the correlation at significant nodes. To further determine the association between specific metabolites and bacteria, a correlation heatmap was conducted, where findings with |r| ≥ 0.6 and p ≤ 0.05 were plotted.
2.13. Clinical case collection and study design
2.13.1. Patient selection
We included adult patients with CD who initiated VDZ. The inclusion criteria specified that patients must have active endoscopic disease at the beginning of the study, which was defined as a simple endoscopic score for CD of 3 or higher.Citation37 The study did not include patients diagnosed with short gut syndrome, individuals who had undergone ileostomy or colostomy surgeries, those in need of immediate surgical intervention, individuals receiving total parenteral nutrition, or those with comorbidities. Moreover, pregnant individuals were excluded from the study. VDZ infusions (300 mg) were administered intravenously at weeks 0, 2, 6, and 10 as part of the induction phase. Beginning at week 14, maintenance infusions were administered every 8 weeks. Obtaining written informed consent was ensured from all clinical cases who were involved in our investigation. The study protocol received approval from the Ethical Committee of the First Affiliated Hospital of Guangxi Medical University (Approval number: 2023-E527-01).
2.13.2. Data and sample collection
Patients underwent assessments at weeks 0, 2, 6, 10, 14, 22, 30, 38, 46, and 54. Clinical and demographic characteristics, such as age, sex, and disease duration, were collected at baseline. The Harvey Bradshaw index (HBI) was utilized to evaluate disease activity.Citation38 The Inflammatory Bowel Disease Questionnaire (IBDQ) was administered to assess the health-related quality of life.Citation39 Clinical scores were determined prior to each infusion, and body mass index (BMI) was calculated during each visit. Inflammatory markers, hemoglobin level, serum VDZ level, anti-VDZ antibody level, α4β7 level, and MAdCAM-1 level were measured in pre-infusion serum collected during the treatment. Stool samples were obtained for fecal calprotectin (FCal) detection at each visit. Furthermore, at weeks 0, 14, and 54, we not only used stool samples for 16S-rDNA sequencing and targeted BA metabolomics but also performed small intestinal computed tomography enteroclysis (CTE), colonoscopy, and pathology on clinical cases.
2.13.3. End points
The primary outcome was corticosteroid-free deep remission (SFDR) at week 14. SFDR was defined as a composite outcome that included a C-reactive protein (CRP) level of 5 mg/L or lower, a FCal level of 150 μg/mg or lower, a HBI score of less than 5, and an IBDQ score of more than 170.Citation40 The secondary outcome was also SFDR, but at week 54. It is important to note that these outcomes were assessed while the patients were not taking corticosteroids.
2.13.4. Measurements
Laboratory variables, including hemoglobin, erythrocyte sedimentation rate (ESR), CRP, and FCal, were tested in our center’s clinical laboratory. Small intestinal CTE and colonoscopy procedures were conducted in our center’s endoscopy department. Moreover, pathology tests were carried out in our center’s pathology department. All the necessary data for these tests and procedures was extracted from electronic medical records. The VDZ level was measured based on the manufacturer’s protocol using the LISA TRACKER (Theradiag, Croissy Beaubourg, France), which is a commonly used tool for monitoring biotherapies in ELISA. A drug-sensitive antidrug antibody (ADA) bridging assay was developed to quantify the anti-VDZ antibody level. The assay utilized a calibrator called MA-VDZ19C11 (IgG2b), following the methodology outlined by Bian et al.Citation41 Besides, MAdCAM-1 and α4β7 concentrations were determined using ELISA kits (Prometheus Laboratories Inc., CA, USA) following the prescribed guidelines provided by the manufacturer.
2.14. 16S-rDNA gene high-throughput sequencing and data analysis
DNA was extracted from fecal samples using the aforementioned method. Primers 341F (Forward primer: 5’-CCTACGGGNGGCWGCAG-3’) and 805 R (Reverse primer: 5’-GACTACHVGGGTATCTAATCC-3’) were used according to the previously published protocol to amplify mainly the V3-V4 region.Citation42 Using the QIIME 2 core denoising function, the feature sequences were acquired. These sequences were then combined with Amplicon Sequence Variants to create OTUs that underwent 100% clustering. QIIME 2 computed α-diversity and β-diversity after normalization via the SILVA classifier. Blast assessed the alignment of feature sequences. Annotation and analysis utilized the SILVA and NT-16S databases. The R vegan package (version 3.6.3) facilitated the generation of graphs. To assess the long-term effects of gut microbiota on immunotherapy responses, we incorporated a persistency index for subjects with follow-up samples available at weeks 14 and 54. The index, P, was formally defined as p = [BCD (f, b) – BCD (f, k)]/BCD (k, b). In this equation, b, k, and f correspond to the baseline, week 2, and later follow-up (week 14 or week 54) samples, respectively.
2.15. Targeted BA metabolomics and data analysis
Using an electrospray negative ionization source, the LC-MS technique was employed to measure the concentrations of 15 BAs in fecal samples. To prepare the samples, 100 mg of feces were homogenized with liquid nitrogen, followed by suspension in 900 μL of ultrapure water. Subsequently, 100 μL of the resulting diluted sample underwent precipitation by mixing with 500 μL of acetonitrile/methanol (v/v = 8:2). The internal standards used were glycochenodeoxycholic acid-d4 and lithocholic acid-d4. After vertexing and centrifuging, the supernatant was carefully transferred to a vial for sample analysis and then subjected to separation by employing an AgelaVenusil MPC18 chromatography column. The identification of BA metabolites was executed by utilizing the mode of multiple reaction monitoring, while their measurement was grounded on the corresponding standard curves. The software SCIEX OS was employed for processing the MS data, and subsequent analysis was conducted utilizing Microsoft Excel. To facilitate visualization, the imported multivariate data matrix was utilized in SIMCA 13.0 (Umetrics, Sweden).
2.16. Statistical analysis
Mean ± SD are provided to present the data. Statistical analysis was conducted utilizing GraphPad Prism 9.0. To establish statistical significance among multiple groups, a one-way analysis of variance was performed. For comparison between two groups, a student’s t-test was utilized. Statistical significance is indicated as follows: nsp > 0.05, *p < 0.05, **p < 0.01, ***p < 0.001, and ****p < 0.0001.
3. Results
3.1. Anti-α4β7-integrin shows significant potential for mitigating the disease phenotypes in remission-achieving colitis mice
Colitis induced by TNBS could accurately replicate the typical clinical symptoms of CD.Citation29 After TNBS administration, the induction of colitis in humanized mice was confirmed by the significant increase in weight loss, DAI score, and CMDI score. The histological analyses of the colitis mice also revealed the presence of various pathological changes in the mucosal lining. These included extensive ulceration, infiltration of inflammatory cells, destruction of crypts, and degradation of the surface epithelium. Nevertheless, after administering anti-α4β7-integrin, the group in remission experienced significant improvement in the symptoms mentioned above (). Previous studies have reported that anti-α4β7-integrin can lead to a decrease in the levels of both CD3+ T cells and CD68+ macrophages, regardless of whether colitis is in remission or not.Citation27 Our study showed similar findings, confirming that anti-α4β7-integrin effectively interfered with colitis in mice ().
Figure 1. The pathological symptoms in remission-achieving colitis mice are alleviated by anti-α4β7-integrin. (a) Changes of weight loss and the ratio of weight loss (n = 7–9); (b) changes of disease activity index score and the disease activity index score at day 7 (n = 7–9); (c) Representative images of colon and related scores of colonic mucosal macro injury (n = 7–9); (d) Representative images at a scale bar of 200 μm and related scores of hematoxylin and eosin-stained colon tissue (n = 4); (e,f) Representative images at scale bars of 50 and 20 μm display CD3 and CD68 immunofluorescence-stained colon tissue (n = 4); (g) real-time quantitative polymerase chain reaction (RT-qPCR) of CD3 and CD68 in colon (n = 4). Mean ± SD are presented. A one-way analysis of variance (ANOVA) was applied. nsp > .05, *p < .05, **p < .01, and ****p < .0001.
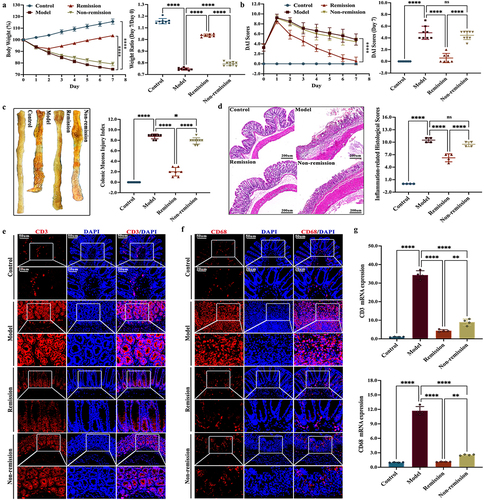
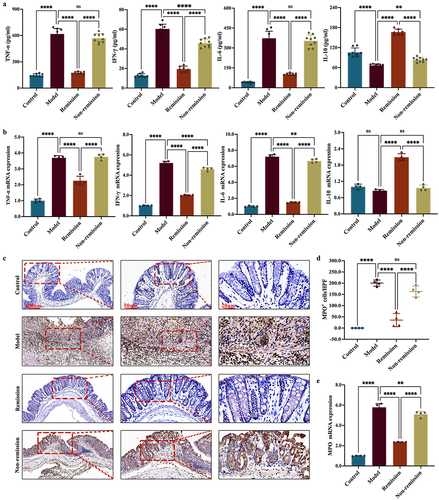
As demonstrated in , the colitis mice in remission displayed significantly lower levels of pro-inflammatory cytokines in serum compared to the colitis mice in non-remission. Conversely, the remission-achieving colitis mice showcased substantially elevated levels of the anti-inflammatory cytokine. Moreover, the inflammatory cell infiltration can be determined by measuring the MPO levels. A linear relationship between colonic MPO activity and neutrophil infiltration has been observed in inflamed colons.Citation43 During our investigation, we discovered that the levels of MPO in colitis mice were considerably elevated in comparison to the controls. Interestingly, in the remission group, there was a considerable decrease in the MPO levels ().
Figure 2. The intestinal inflammation in remission-achieving colitis mice is mitigated by anti-α4β7-integrin. (a) Enzyme-linked immunosorbent assay of inflammatory cytokines in serum (n = 7–9); (b) RT-qPCR of inflammatory cytokines in colon (n = 4); (c) Representative images at scale bars of 100, 50, and 20 μm display MPO immunohistochemistry-stained colon tissue (n = 4); (d) quantification of C (n = 4); (e) RT-qPCR of MPO in colon (n = 4). Mean ± SD are presented. A one-way ANOVA was applied. nsp > .05, **p < .01, ***p < .001, and ****p < .0001.
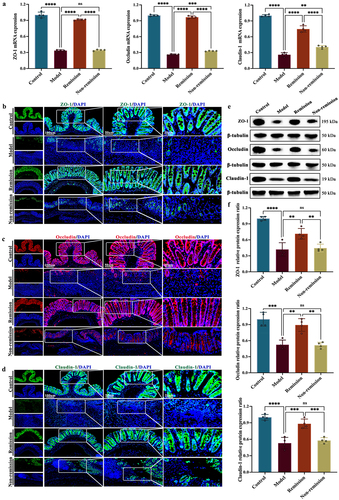
To evaluate the integrity of the gut epithelium during the therapeutic process, the analysis primarily focuses on the tight junction (TJ) proteins, namely ZO-1, occludin, and claudin-1. showed a notable increase in the mRNA expression levels of TJ proteins in mice that achieved remission when compared to mice that did not achieve remission. Immunofluorescent labeling disclosed that these TJ proteins in the intestinal epithelial cell membrane of colitis mice were significantly reduced. However, the remission group manifested an augmented expression of these TJ proteins within the spinous and granular mucosal layers (). Comparable outcomes were observed using WB (). Unfortunately, a subset of humanized mice with colitis showed no improvement in these disease phenotypes even after being treated with anti-α4β7-integrin. In other words, not all colitis mice showed responses to anti-α4β7-integrin.
Figure 3. The gut barrier function in remission-achieving colitis mice is restored by anti-α4β7-integrin. (a) RT-qPCR of tight junction (TJ) proteins in colon (n = 4); (b) Representative images at scale bars of 100, 50, and 20 μm display TJ proteins immunofluorescence-stained colon tissue (n = 4); (c) Representative immunoblots of TJ proteins in colon (n = 4). Mean ± SD are presented. A one-way ANOVA was applied. nsp > .05, **p < .01, ***p < .001, and ****p < .0001.
3.2. The composition of gut microbiota at baseline can predict the response to anti-α4β7-integrin in humanized mice with colitis
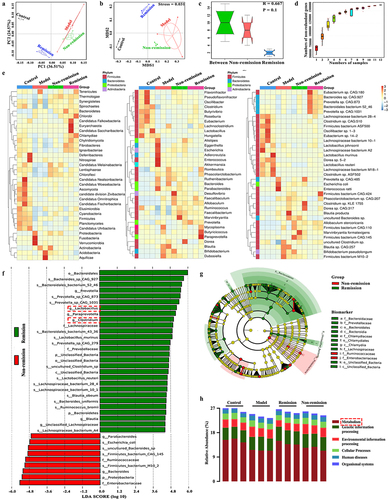
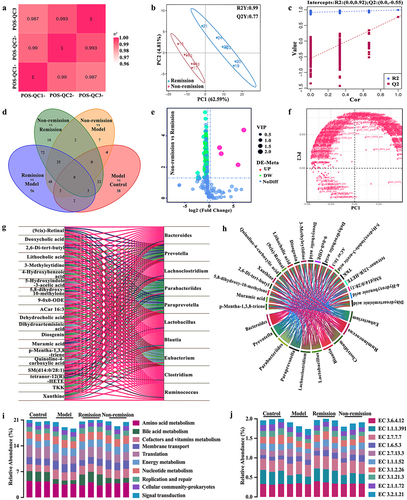
As gut dysbiosis is considered a pathogenic factor in CD, we utilized metagenomics to investigate the impact of the gut microbiota on treatment responses. The remission group indicated a substantial dissimilarity in OTUs compared to the non-remission group, as revealed by the principal component analysis (PCA) score plot (). This observation was further supported by the non-metric multidimensional scaling plot, which clearly displayed a distinct segregation of the OTUs between the remission and non-remission groups (). The analysis using analysis of similarities demonstrated that the dissimilarity between groups was more pronounced compared to the dissimilarity within groups (). Besides, it could be seen from the Pan gene curve that the gene numbers gradually increased with the random sample numbers, and finally the curve became stable and no longer changed with the sample numbers. This indicated that the quality of the detected samples was good and that the number of related genes was large (). Interestingly, distinct discrepancies in the gut microbiota composition were observed among the groups in remission and those without remission across all levels (). At the level of genus, there was an abundance of Lactobacillus, Clostridium, Prevotella, Paraprevotella, and Blauti in the remission-achieving colitis mice, while Parabacteroides and Bacteroides were enriched in the non-remission mice (). Furthermore, functional enrichment analysis of the gut microbiota in each group indicated that the primary focus was on metabolism (). In general, our results indicate that the utilization of baseline microbiome profiles holds promise for predicting immunotherapy responses.
Figure 4. The composition of the gut microbiota at baseline can predict treatment responses in humanized mice with colitis. (a) Principal component analysis (PCA) score plot; (b) Non-metric multidimensional scaling plot; (c) analysis of similarities; (d) pan gene curve; (e) gut microbiota composition at phylum, genus, and species levels; (f,g) gut microbiota composition significantly varied at all levels between the groups in and out of remission; (H) functional enrichment of KEGG at level 1. (n = 3 in each group).
3.3. The modulation of metabolism at baseline is involved in the response to anti-α4β7-integrin in humanized mice with colitis
Given the significant role of the metabolism in regulating gut homeostasis, particularly in the context of CD, we explored the potential influence of serum metabolisms on treatment responses. We incorporated quality control samples into our research and computed the Pearson correlation coefficient between the samples. In the entire detection process, the R2 values demonstrated an elevated level of stability, ranging from 0.987 to 0.994 (). All the metabolites that were found between the two groups underwent hierarchical clustering analysis. The metabolic expression between the two groups was significantly different, indicating the presence of distinct metabolic mechanisms or cellular pathways (). The Venn diagram further displayed the overlap and unique differential metabolites of multiple comparison combinations (). A total of 71 potential metabolomic biomarkers, which were connected to clinical outcomes with a p < 0.01 and VIP > 1, were discovered and listed in Table S2 and . Among these biomarkers, 67 were found to be associated with remission, while the remaining four were associated with non-remission (). In essence, the metabolites may play a role in modulating immunotherapy responses.
Figure 5. The modulation of metabolism at baseline is involved in treatment responses in humanized mice with colitis. (a) Quality control sample correlation analysis; (B) PCA score plot; (c) sort verification plot; (d) venn diagram of differential groups; (e) volcano plot; (f) loading plot; (g) correlation Sankey diagram; (h) correlation chord diagram; (i) functional enrichment of KEGG at level 2; (j) functional enrichment of KEGG at level EC (n = 6 in each group).
3.4. A comprehensive predictive model is constructed by combining metagenomics and metabolomics data available at baseline
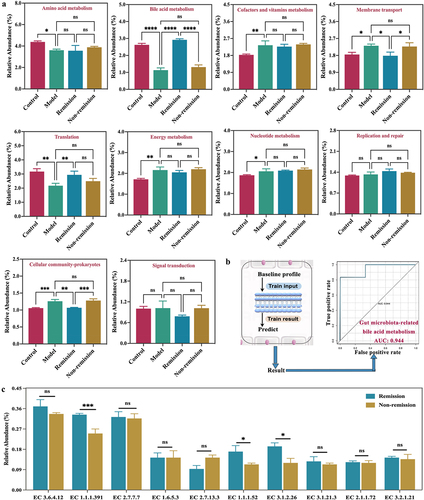
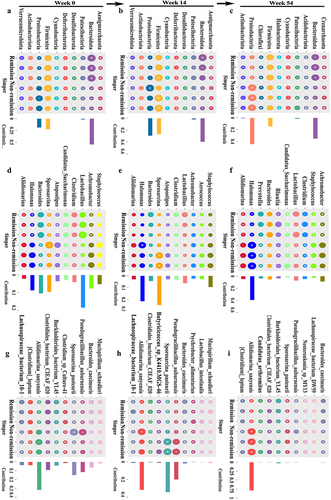
A previous study conducted on patients receiving anti-α4β7-integrin found that baseline clinical characteristics alone were not enough to accurately predict remission at week 14. However, incorporating microbial taxa improved the predictive capacity.Citation15 To enhance the predictive capacity even further, we developed a comprehensive prediction model that incorporated both gut microbiota and metabolites. The Sankey diagram and Chord diagram provided evidence of the potential correlation between key bacteria and key metabolites (). The KEGG functional relative abundance histograms demonstrated that the baseline gut microbiota could be enriched with multiple functions and enzymes (). However, only gut microbiota-mediated BAs had a significant association with treatment responses (). Particularly, baseline data that included gut microbiota and BAs were sufficient for predicting remission (AUC 0.944) (). Furthermore, the three enzymes EC 1.1.1.391, EC 1.1.1.52, and EC 3.1.2.26 related to secondary BA synthesis were significantly increased in the remission group (). Thus, the gut microbiota-related BA metabolism alteration may be involved in immunotherapy responses.
Figure 6. A comprehensive predictive model is constructed by combining baseline data that include gut microbiota and bile acid (BA) metabolism. (a) Differences in the relative abundance of functions related to gut microbiota between groups; (b) predictive model demonstrating area under curve from gut microbiota and BA metabolism; (c) differences in the relative abundance of enzymes related to gut microbiota between the remission group and the non-remission group.
3.5. Anti-α4β7 integrin provides sustained therapeutic benefits in clinical remission cases during follow-up
Although omics signatures have been observed in humanized mice with colitis treated with anti-α4β7 integrin, further comprehensive testing in clinical patients is essential before these findings can be implemented in practical clinical settings. Due to the long follow-up time and the requirement to achieve deep clinical remission, after matching the baseline information, we ultimately plan to use three cases per group to thoroughly illustrate the course of clinical treatment from all perspectives. The study design is summarized in . None of the patients had any drug-related adverse reactions. The patients in both groups displayed generally similar baseline characteristics. Changes in biomarker concentrations and clinical scores were reported for both individuals who had SFDR and those who did not at weeks 14 and 54 (Table S3).
Figure 7. Anti-α4β7 integrin provides sustained therapeutic benefits in clinical remission cases during follow-up. (a) Overall overview of clinical experiments in our study; (b – g) comparisons for biomarker trajectories at individual time points; (h – i) comparisons for clinical score trajectories at individual time points. (n = 3 in each group).
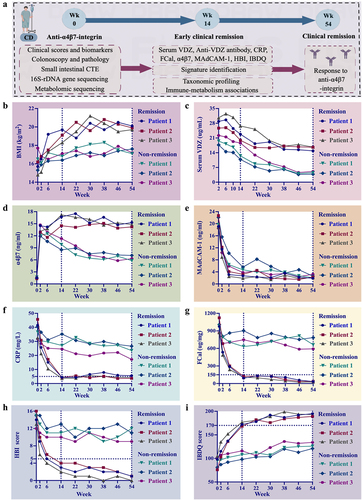
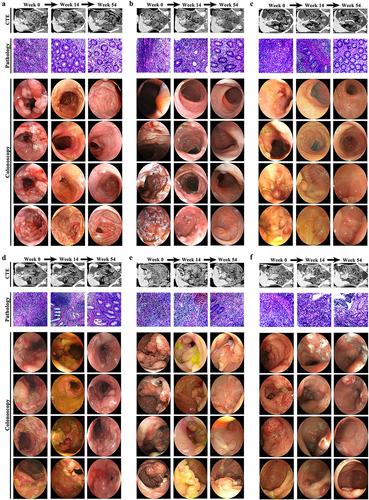
Comparisons of biomarker and clinical score trajectories at individual time points were also described. Overall, there was notably less variability in BMI among non-remission cases, whereas an upward trend was observed from baseline to week 54 in remission cases (). Out of the six patients who provided serum samples for the ADA assessment, none tested positive at any point up to week 54. The serum trough VDZ levels were higher in the clinical remitters compared to the clinical non-remitters. Among the clinical remitters, VDZ levels increased during induction, followed by a downward trend from week 10 (). The concentrations of α4β7 in both groups were numerically higher at other time points compared to the baseline values. However, starting from week 2, the α4β7 concentrations continued to increase in remission cases while gradually decreasing in non-remission cases (). The MAdCAM-1, CRP, and FCal concentrations from week 2 through week 54 were all continuously decreased. Furthermore, these values decreased more rapidly in clinical remitters compared with non-remitters (). At weeks 14 and 54, both HBI and IBDQ scores returned to normal values in cases who were in remission, whereas neither score was significantly changed in cases who were not in remission (). Significant improvements in remission cases were also observed for small intestinal CTE, colonoscopy, and pathology at weeks 14 and 54 (). Nevertheless, no significant improvement was observed in the non-remission cases during the follow-up period for all the above examinations (). Taken together, these findings consistently showed sustained therapeutic benefits of anti-α4β7 integrin for CD patients in remission.
Figure 8. Changes in the examination results of six clinical cases at weeks 0, 14, and 54. (a) Clinical remitter 1; (b) clinical remitter 2; (c) clinical remitter 3; (d) clinical non-remitter 1; (e) clinical non-remitter 2; (f) clinical non-remitter 3.
3.6. Persistent consistency in gut microbiota composition promotes sustained remission in CD patients
To further investigate the essential role of gut microbiota on treatment responses, we analyzed stool samples from CD patients using 16S-rDNA sequencing to detect differences in gut microbiota throughout follow-up. The PCA score plots demonstrated the ability to distinguish between individuals who experienced remission and those who did not across various taxonomic levels (). Consistent with the animal studies discussed earlier, patients who attained SFDR at weeks 14 and 54 exhibited a distinct microbial richness compared to those who did not (). These differences were also observed at the phylum, genus, and species levels. Notably, Lactobacillus and Clostridium were consistently found to be abundant in clinical remission cases at all three follow-up time points (). The composition of the gut microbiota remained stable until week 14. Specifically, only one taxon, Candidatus saccharimonas, experienced a significant increase in relative abundance at the genus level among clinical remitters (). Also, in the clinical cases, solely two taxa, Prevotella and Blautia, showed a remarkable disparity in the relative abundance between baseline and week 54 at the genus level. These two taxa also exhibited elevated relative abundances among clinical remitters (). Furthermore, the results of the persistency index analysis indicated that there were no statistically significant changes in both the remission group and the non-remission group at weeks 14 and 54, when compared with the random sampling (Figure S1). Therefore, the gut microbiota composition of clinical remitters at weeks 14 and 54 showed significant persistency, indicating that achieving long-lasting remission is linked to enduring consistency in the composition of the microbiome.
Figure 9. The gut microbiota composition of clinical remitters shows significant persistency. (a, e, and h) PCA score plots at weeks 0, 14, and 54; (b, f, and i) community α-diversity analyses at weeks 0, 14, and 54; (c, g, and j) venn diagrams at weeks 0, 14, and 54; (d, h, and k) gut microbiota composition significantly varied at all levels between the groups in and out of remission at weeks 0, 14, and 54. (n = 3 in each group). Mean ± SD are presented. The student’s t-test was applied. nsp > .05, *p < .05, **p < .01.
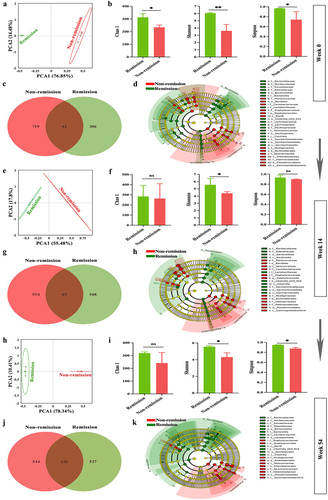
Figure 10. Persistent consistency in gut microbiota composition promotes sustained remission in clinical remitters. (a – c) relative abundance of the top 10 gut microbiota at phylum at weeks 0, 14, and 54; (d – f) relative abundance of the top 10 gut microbiota at genus at weeks 0, 14, and 54; (g-i) relative abundance of the top 10 gut microbiota at species at weeks 0, 14, and 54. (n = 3 in each group).
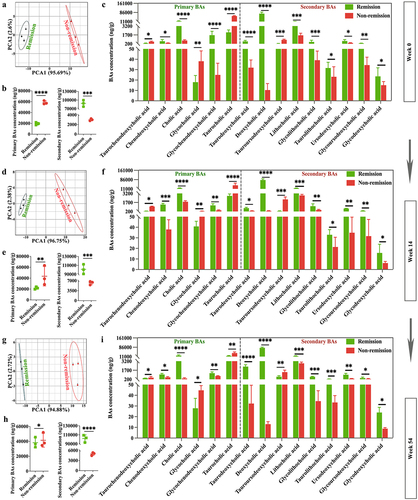
3.7. BA metabolomic profiling confirms functional signatures associated with treatment outcomes in CD patients
Considering the significant role of BAs in triggering inflammation in the gastrointestinal tract,Citation44 our research focused on exploring how these BAs may influence treatment responses. During this study, BA concentrations were measured three times using targeted metabolomics analyses at weeks 0, 14, and 54. The PCA score plots clearly showed that BAs were clustered within groups, while there was a significant distance between groups (). As well, the clinical remitters showed a lower concentration of total primary BAs and a higher concentration of total secondary BAs compared to the clinical non-remitters (). Specifically, clinical remitters had large amounts of deoxycholic acid and lithocholic acid, which aligns with the findings of the animal experiments discussed above. Furthermore, it has been shown that lithocholic acid 3-sulfate can undergo desulfation and metabolization in fecal cultures of humans,Citation45 and chenodeoxycholic acid and cholic acid, which were formed as a result of desulfation of the 3-sulfates, could be further metabolized into various BAs by the fecal microflora.Citation46,Citation47 In our investigation, the levels of lithocholic acid, chenodeoxycholic acid, and cholic acid exhibited notable reductions in cases without remission as opposed to cases with remission. This implies that a larger portion of 3-OH-sulfated BAs might be detected among those who did not respond (). Of note, no significant differences were observed in the composition or concentration of BAs at weeks 14 and 54 in comparison to the baseline, and these three targeted BA assays consistently indicate that CD patients with higher levels of secondary BAs were more likely to respond favorably to the anti-α4β7-integrin therapy compared to those who had lower levels. The discoveries presented here offer backing for the potential mechanism of secondary BAs in lessening inflammation within the intestinal lumen and improving the response to immunotherapy.
Figure 11. BA metabolomic profiling confirms functional signatures associated with treatment outcomes in clinical cases. (a, d, and g) PCA score plots at weeks 0, 14, and 54; (b, e, and h) comparisons of total primary and secondary BAs between groups at weeks 0, 14, and 54; (c, f, and i) comparisons of 15 BAs between groups at weeks 0, 14, and 54. (n = 3 in each group). Mean ± SD are presented. The student’s t-test was applied. *p < .05, **p < .01, ***p < .001, and ****p < .0001.
4. Discussion
With the wide range of therapeutic strategies available for CD, the identification of determinants that improve overall treatment outcomes and understanding the specific mechanisms of response to different treatment classes are of utmost importance for effectively managing CD. By applying multi-omics to both humanized mice and clinical cases, we have not only identified unique microbial and BA metabolism signatures that could serve as biomarkers for treatment responses but also developed a comprehensive predictive model that has the potential to improve predictive capacity. Furthermore, we proposed underlying mechanisms to explain the advantageous impacts of favorable microbial and BA metabolic signatures on treatment responses.
One significant finding from our analysis was the identification of specific bacterial species linked to remission following anti-α4β7-integrin therapy. These bacterial species with proven anti-inflammatory properties have been extensively studied, primarily due to their ability to promote a beneficial balance of BAs. Taxonomically, the abundance of Lactobacillus and Clostridium at baseline played a significant role in predicting remission. Lactobacillus, a crucial genus of bacteria implicated in BAs, employs bile-salt hydrolase to transform glycine- and taurine-conjugated BAs into their detached and unconjugated states.Citation48 This process not only improves gut barrier function but also helps prevent colitis by upholding high levels of bile-salt hydrolase within the gastrointestinal tract.Citation44,Citation49 Additionally, both Lactobacillus and Clostridium have the ability to convert primary BAs into secondary BAs through the CYP7A1-mediated 7-dehydroxylation process.Citation50,Citation51 Therefore, the amelioration of the dysregulated microbiome, specifically by increasing the fecal abundance of Lactobacillus and Clostridium in mice with colitis, might be partly accountable for the elevated secondary BAs, which have been employed to exemplify the beneficial impacts of alleviating intestinal inflammation.Citation52,Citation53
In addition, the impact of BA metabolism alteration on treatment responses was determined through metabolomic profiling. In our study, in contrast to colitis animals and clinical cases with lower levels of lithocholic acid and deoxycholic acid (secondary BAs), those with higher levels were more likely to respond to anti-α4β7-integrin therapy. This conclusion aligns with previously published findings that indicate a role for secondary BAs in intestinal inflammation.Citation21,Citation54 Deoxycholic acid has been demonstrated to enhance the preservation of mucosal integrity through the augmentation of intestinal epithelial cell migration.Citation55 Lithocholic acid and deoxycholic acid have been demonstrated to inhibit the synthesis of pro-inflammatory cytokines by human peripheral blood-derived macrophages, an important mediator of intestinal inflammation in CD, through activation of the TGR5 receptor.Citation53 Lithocholic acid has been recently demonstrated to inhibit inflammation by enhancing the expression of VDR, stabilizing IκBα, reducing NF-κB phosphorylation, and inhibiting IL-8 secretion.Citation56 We also observed a potential equilibrium between intestinal-wall BA sulfation and gut microbiota. It is recognized that the gut microbiota, especially Bacteroides and Clostridium, could modulate intestinal sulfotransferase activity (sulfation of BAs) through local interference with regulatory proteins in ileal epithelial cells or colonic bacterial signaling.Citation46,Citation57–60 Hence, the merging of gut dysbiosis and BA desulfurization hinted toward a decline in microbiota enzymatic activity among clinical non-remitters.
Notably, longitudinal sampling of the microbiota has shown some improvement in mitigating the effects of microbial instability, thereby enabling more accurate categorization of CD patients based on their microbiota signature.Citation61 Our observations indicate that responders exhibited a more persistent alteration in their microbial and BA metabolomic profiles at weeks 14 and 54, in contrast to non-responders. Clinical observations in CD and ulcerative colitis have shown comparable findings. The ACT trial, assessing the effectiveness of infliximab in ulcerative colitis, discovered a reduced occurrence of colectomy at week 54 among individuals who displayed endoscopic response by week 8.Citation62 Concurrently, a correlation has been established between the early decrease in FCal levels and improved long-term results in CD.Citation63 Therefore, it was surprising to discover that achieving long-lasting remission in CD patients treated with anti-α4β7-integrin was connected to enduring alterations in the gut microbiota-mediated BA metabolism.
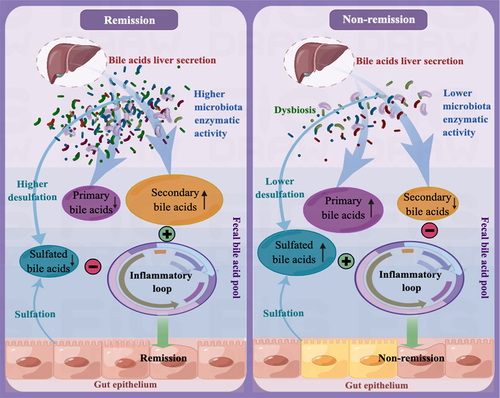
Based on our research findings, we tentatively propose the possible mechanism underlying the immunotherapy responses to anti-α4β7-integrin therapy in CD as follows: In clinical remitters, higher microbiota enzymatic activity results in a luminal BA pool that primarily consists of secondary BAs and has minimal amounts of primary and 3-OH-sulfated BAs. This specific composition of BAs has a significant positive impact on treatment responses by alleviating intestinal inflammation, and the sustained remission is linked to long-lasting changes in the microbial-related BAs. Conversely, in clinical non-remitters, lower microbiota enzymatic activity triggers alterations in the composition of the luminal BA pool, increasing sulfated BAs at the expense of secondary BAs. These modifications impair the anti-inflammatory properties of secondary BAs on intestinal epithelial cells, ultimately leading to poor treatment outcomes ().
Figure 12. The mechanism that regulates immunotherapy responses to anti-α4β7-integrin in Crohn’s disease. In clinical remitters, higher microbiota enzymatic activity results in a luminal BA pool that primarily consists of secondary BAs and has minimal amounts of primary and 3-OH-sulfated BAs. This specific composition of BAs has a significant positive impact on treatment responses by alleviating intestinal inflammation. Conversely, in clinical non-remitters, lower microbiota enzymatic activity triggers alterations in the composition of the luminal BA pool, increasing sulfated BAs at the expense of secondary BAs. These modifications impair the anti-inflammatory properties of secondary BAs on intestinal epithelial cells, ultimately leading to poor treatment outcomes.
Nevertheless, we acknowledge several limitations in our study. Specifically, our assessments of remission were based on pathological symptoms, intestinal inflammation, gut-barrier disruption, and clinical indicators rather than endoscopic outcomes. Among clinical cases, only a small number of patients provided stool at each follow-up time point, which limited the sample size of our research. Although most omics profiles in humanized mice with colitis were replicated in CD patients, we recognize the need for more thorough studies in larger cohorts. Additional experimental investigations are crucial in substantiating the complete mechanistic implication of the detected multi-omics biomarkers and their potential utilization in impacting the response to current treatment in CD.
Taken together, the gut microbiota-mediated BA metabolism alteration impacts the response to anti-α4β7-integrin therapy in CD. Our study emphasizes the significance of not only microbial composition but also microbially encoded metabolic pathways in terms of treatment outcomes. Our study also underscores the crucial role of BA metabolism alteration, specifically elevated secondary BAs, in determining treatment responses. Moreover, our study further highlights that anti-α4β7 integrin provided sustained therapeutic benefits in clinical remitters during follow-up, and long-lasting remission was linked to persistent alterations in the gut microbiota-mediated BA metabolism.
4.1. Conclusion
The identification of prognostic microbial signals facilitates the development of targeted probiotics that activate anti-inflammatory BA metabolic pathways, thereby improving treatment responses. Integrative multi-omics analyses established in our research can be instrumental in advancing the development of comprehensive predictive models and providing valuable insights into the potential mechanisms that impact treatment responses in complex diseases.
Author contributions
Bing Han, Daiyuan Tang, and Xiaoping Lv conceived the project and designed the experiment. Bing Han, Daiyuan Tang, Xiaodan Lv, Junhua Fan, Shiquan Li, Hui Zhu, Jiatong Zhang, and Shang Xu conducted the experiment. Xiaofang Xu, Ziqian Huang, Zhixi Huang, and Guangfu Lin contributed the clinical cases. Bing Han and Daiyuan Tang sorted out the findings. Bing Han wrote the manuscript. Xiaoping Lv and Lingling Zhan revised the manuscript. All authors read and approved the final manuscript.
Supplemental Material
Download MS Word (153.4 KB)Acknowledgments
We would like to acknowledge Figdraw (www.figdraw.com) for their assistance in creating Figure 13 for this study.
Disclosure statement
No potential conflict of interest was reported by the author(s).
Data availability statement
The data obtained from whole-genome shotgun metagenomics and 16S-rDNA gene high-throughput sequencing were uploaded to the NCBI SRA (www.ncbi.nlm.nih.gov) and can be accessed using the following BioProject numbers: PRJNA1022859, PRJNA1024074, PRJNA1024099, and PRJNA1024450. The data generated from non-targeted metabolomics and targeted BA metabolomics were deposited in the MetaboLights (www.ebi.ac.uk/metabolights) and can be accessed using the following numbers: MTBLS8700 and MTBLS8702.
Supplementary material
Supplemental data for this article can be accessed online at https://doi.org/10.1080/19490976.2024.2310894
Additional information
Funding
References
- Torres J, Mehandru S, Colombel JF, Peyrin-Biroulet L. Crohn’s disease. Lancet. 2017;389(10080):1741–27. doi:10.1016/S0140-6736(16)31711-1.
- Sartor RB. Genetics and environmental interactions shape the intestinal microbiome to promote inflammatory bowel disease versus mucosal homeostasis. Gastroenterology. 2010;139(6):1816–1819. doi:10.1053/j.gastro.2010.10.036.
- Veny M, Fernández-Clotet A, Panés J. Controlling leukocyte trafficking in IBD. Pharmacol Res. 2020;159:105050. doi:10.1016/j.phrs.2020.105050.
- Kobayashi T, Hibi T. Improving IBD outcomes in the era of many treatment options. Nat Rev Gastroenterol Hepatol. 2023;20(2):79–80. doi:10.1038/s41575-022-00738-z.
- Wyant T, Fedyk E, Abhyankar B. An overview of the mechanism of action of the monoclonal antibody vedolizumab. J Crohns Colitis. 2016;10(12):1437–1444. doi:10.1093/ecco-jcc/jjw092.
- Sandborn W, Feagan B, Rutgeerts P, Hanauer S, Colombel J, Sands B, Lukas, M, Fedorak, RN and Lee, S, Bressler, B, et al. Vedolizumab as induction and maintenance therapy for Crohn’s disease. N Engl J Med. 2013;369(8):711‐721. doi:10.1056/NEJMoa1215739.
- Vermeire S, Loftus EV Jr, Colombel JF, Feagan BG, Sandborn WJ, Sands BE, Danese S, D’Haens GR, Kaser A, Panaccione R. et al. Long-term efficacy of vedolizumab for Crohn’s disease. J Crohns Colitis. 2017;11(4):412–424. doi:10.1093/ecco-jcc/jjw176.
- Ungar B, Kopylov U, Yavzori M, Fudim E, Picard O, Lahat A, Coscas D, Waterman M, Haj-Natour O, Orbach-Zingboim N. et al. Association of vedolizumab level, anti-drug antibodies, and α4β7 occupancy with response in patients with inflammatory bowel diseases. Clin Gastroenterol Hepatol. 2018;16(5):697–705 e7. doi:10.1016/j.cgh.2017.11.050.
- Zeissig S, Rosati E, Dowds CM, Aden K, Bethge J, Schulte B, Pan WH, Mishra N, Zuhayra M, Marx M. et al. Vedolizumab is associated with changes in innate rather than adaptive immunity in patients with inflammatory bowel disease. Gut. 2019;68(1):25–39. doi:10.1136/gutjnl-2018-316023.
- Loh G, Blaut M. Role of commensal gut bacteria in inflammatory bowel diseases. Gut Microbes. 2012;3(6):544–555. doi:10.4161/gmic.22156.
- Darfeuille-Michaud A, Boudeau J, Bulois P, Neut C, Glasser AL, Barnich N, Bringer M-A, Swidsinski A, Beaugerie L, Colombel J-F. et al. High prevalence of adherent-invasive Escherichia coli associated with ileal mucosa in Crohn’s disease. Gastroenterology. 2004;127(2):412–421. doi:10.1053/j.gastro.2004.04.061.
- Elhenawy W, Oberc A, Coombes BK. A polymicrobial view of disease potential in Crohn’s-associated adherent-invasive E. coli. Gut Microbes. 2018;9(2):166–174. doi:10.1080/19490976.2017.1378291.
- Sokol H, Pigneur B, Watterlot L, Lakhdari O, Bermudez-Humaran LG, Gratadoux JJ, Blugeon S, Bridonneau C, Furet J-P, Corthier G. et al. Faecalibacterium prausnitzii is an anti-inflammatory commensal bacterium identified by gut microbiota analysis of Crohn disease patients. Proc Natl Acad Sci U S A. 2008;105(43):16731–16736. doi:10.1073/pnas.0804812105.
- Quevrain E, Maubert MA, Michon C, Chain F, Marquant R, Tailhades J, Miquel S, Carlier L, Bermúdez-Humarán LG, Pigneur B. et al. Identification of an anti-inflammatory protein from Faecalibacterium prausnitzii, a commensal bacterium deficient in Crohn’s disease. Gut. 2016;65(3):415–425. doi:10.1136/gutjnl-2014-307649.
- Ananthakrishnan AN, Luo C, Yajnik V, Khalili H, Garber JJ, Stevens BW, Cleland T, Xavier RJ. Gut microbiome function predicts response to anti-integrin biologic therapy in inflammatory bowel diseases. Cell Host & Microbe. 2017;21(5):603–610 e3. doi:10.1016/j.chom.2017.04.010.
- Dorrestein PC, Mazmanian SK, Knight R. Finding the missing links among metabolites, microbes, and the host. Immunity. 2014;40(6):824–832. doi:10.1016/j.immuni.2014.05.015.
- Wikoff WR, Anfora AT, Liu J, Schultz PG, Lesley SA, Peters EC, Lesley, S, Peters, EC, Siuzdak, G, et al. Metabolomics analysis reveals large effects of gut microflora on mammalian blood metabolites. Proc Natl Acad Sci U S A. 2009;106(10):3698–3703. doi:10.1073/pnas.0812874106.
- Ridlon JM, Harris SC, Bhowmik S, Kang DJ, Hylemon PB. Consequences of bile salt biotransformations by intestinal bacteria. Gut Microbes. 2016;7(1):22–39. doi:10.1080/19490976.2015.1127483.
- Kirkpatrick RB, Green MD, Hagey LR, Hofmann AF, Tephly TR. Effect of side chain length on bile acid conjugation: glucuronidation, sulfation and coenzyme a formation of nor-bile acids and their natural C24 homologs by human and rat liver fractions. Hepatology. 1988;8(2):353–357. doi:10.1002/hep.1840080227.
- Wang YD, Chen WD, Yu D, Forman BM, Huang W. The G-protein-coupled bile acid receptor, Gpbar1 (TGR5), negatively regulates hepatic inflammatory response through antagonizing nuclear factor κ light-chain enhancer of activated B cells (NF-κB) in mice. Hepatology. 2011;54(4):1421–1432. doi:10.1002/hep.24525.
- Greve JW, Gouma DJ, Buurman WA. Bile acids inhibit endotoxin-induced release of tumor necrosis factor by monocytes: an in vitro study. Hepatology. 1989;10(4):454–458. doi:10.1002/hep.1840100409.
- Pols TW, Nomura M, Harach T, Sasso GL, Oosterveer MH, Thomas C, Rizzo G, Gioiello A, Adorini L, Pellicciari R. et al. TGR5 activation inhibits atherosclerosis by reducing macrophage inflammation and lipid loading. Cell Metab. 2011;14(6):747–757. doi:10.1016/j.cmet.2011.11.006.
- Elinav E, Strowig T, Kau AL, Henao-Mejia J, Thaiss CA, Booth CJ, Peaper D, Bertin J, Eisenbarth S, Gordon J. et al. NLRP6 inflammasome regulates colonic microbial ecology and risk for colitis. Cell. 2011;145(5):745–757. doi:10.1016/j.cell.2011.04.022.
- Lozupone CA, Knight R. Species divergence and the measurement of microbial diversity. FEMS Microbiol Rev. 2008;32(4):557–578. doi:10.1111/j.1574-6976.2008.00111.
- McCafferty J, Mühlbauer M, Gharaibeh RZ, Arthur JC, Perez-Chanona E, Sha W, Jobin C, Fodor AA. Stochastic changes over time and not founder effects drive cage effects in microbial community assembly in a mouse model. ISME J. 2013;7(11):2116–2125. doi:10.1038/ismej.2013.106.
- Billerbeck E, Barry WT, Mu K, Dorner M, Rice CM, Ploss A. Development of human CD4+FoxP3+ regulatory T cells in human stem cell factor-, granulocyte-macrophage colony-stimulating factor-, and interleukin-3-expressing NOD-SCID IL2Rgamma(null) humanized mice. Blood. 2011;117(11):3076–3086. doi:10.1182/blood-2010-08-301507.
- Wunderlich M, Chou FS, Link KA, Mizukawa B, Perry RL, Carroll M, Mulloy JC. AML xenograft efficiency is significantly improved in NOD/SCID-IL2RG mice constitutively expressing human SCF, GM-CSF and IL-3. Leukemia. 2010;24(10):1785–1788. doi:10.1038/leu.2010.158.
- Kiesler P, Fuss IJ, Strober W. Experimental models of inflammatory bowel diseases. Cell Mol Gastroenterol Hepatol. 2015;1(2):154–170. doi:10.1016/j.jcmgh.2015.01.006.
- Wirtz S, Popp V, Kindermann M, Gerlach K, Weigmann B, Fichtner-Feigl S, Neurath MF. Chemically induced mouse models of acute and chronic intestinal inflammation. Nat Protoc. 2017;12(7):1295–1309. doi:10.1038/nprot.2017.044.
- Manzini R, Schwarzfischer M, Atrott K, Laimbacher A, Lang S, Wawrzyniak M, Rickenbacher A, Turina M, Hruz P, Lissner D. et al. Combination of vedolizumab with tacrolimus is more efficient than vedolizumab alone in the treatment of experimental colitis. Inflamm Bowel Dis. 2021;27(12):1986–1998. doi:10.1093/ibd/izab063.
- Yousefi-Ahmadipour A, Rashidian A, Mirzaei MR, Farsinejad A, PourMohammadi-Nejad F, Ghazi-Khansari M, Ai J, Shirian S, Allahverdi A, Saremi J. et al. Combination therapy of mesenchymal stromal cells and sulfasalazine attenuates trinitrobenzene sulfonic acid induced colitis in the rat: the S1P pathway. J Cell Physiol. 2019;234(7):11078–11091. doi:10.1002/jcp.27944.
- Millar AD, Rampton DS, Chander CL, Claxson AW, Blades S, Coumbe A, Panetta J, Morris CJ, Blake DR. Evaluating the antioxidant potential of new treatments for inflammatory bowel disease using a rat model of colitis. Gut. 1996;39(3):407–415. doi:10.1136/gut.39.3.407.
- Chen G, Ran X, Li B, Li Y, He D, Huang B, Fu S, Liu J, Wang W. Sodium butyrate inhibits inflammation and maintains epithelium barrier integrity in a TNBS-induced inflammatory bowel disease mice model. EBioMedicine. 2018;30:317–325. doi:10.1016/j.ebiom.2018.03.030.
- Segata N, Izard J, Waldron L, Gevers D, Miropolsky L, Garrett WS, Huttenhower C. Metagenomic biomarker discovery and explanation. Genome Biol. 2011;12(6):R60. doi:10.1186/gb-2011-12-6-r60.
- Franzosa EA, Sirota-Madi A, Avila-Pacheco J, Fornelos N, Haiser HJ, Reinker S, Vatanen T, Hall AB, Mallick H, McIver LJ. et al. Gut microbiome structure and metabolic activity in inflammatory bowel disease. Nat Microbiol. 2019;4(2):293–305. doi:10.1038/s41564-018-0306-4.
- Want EJ, Wilson ID, Gika H, Theodoridis G, Plumb RS, Shockcor J, Holmes E, Nicholson JK. Global metabolic profiling procedures for urine using UPLC–MS. Nat Protoc. 2010;5(6):1005–1018. doi:10.1038/nprot.2010.50.
- Daperno M, D’Haens G, Assche GV, Baert F, Bulois P, Maunoury V. et al. Development and validation of a new, simplified endoscopic activity score for Crohn’s disease: the SES-CD. Gastrointest Endosc. 2004;60:505–512. doi:10.1016/s0016-5107(04)01878-4.
- Elliott PR, Lennard-Jones JE, Hathway N. A simple index of Crohn’s-disease activity. Lancet. 1980;1(8173):876. doi:10.1016/s0140-6736(80)91372-0.
- Irvine EJ, Feagan B, Rochon J, Archambault A, Fedorak RN, Groll A, Kinnear D, Saibil F, McDonald JWD. Quality of life: a valid and reliable measure of therapeutic efficacy in the treatment of inflammatory bowel disease. Canadian Crohn’s Relapse Prevention Trial Study Group. Gastroenterology. 1994;106(2):287–296. doi:10.1016/0016-5085(94)90585-1.
- Yarur AJ, Bruss A, Moosreiner A, Beniwal-Patel P, Nunez L, Berens B, Colombel JF, Targan SR, Fox C, Melmed GY. et al. Higher intra-abdominal visceral adipose tissue mass is associated with lower rates of clinical and endoscopic remission in patients with inflammatory bowel diseases initiating biologic therapy: results of the constellation study. Gastroenterology. 2023;165(4):963–975.e5. doi:10.1053/j.gastro.2023.06.036.
- Bian S, Dreesen E, Tang HT, Compernolle G, Peeters M, Van Assche G, Ferrante M, Vermeire S, Gils A. Antibodies toward vedolizumab appear from the first infusion onward and disappear over time. Inflamm Bowel Dis. 2017;23(12):2202–2208. doi:10.1097/MIB.0000000000001255.
- Wei SD, Brejnrod AD, Trivedi U, Mortensen MS, Johansen MY, Karstoft K, Vaag AA, Ried-Larsen M, Sørensen SJ. Impact of intensive lifestyle intervention on gut microbiota composition in type 2 diabetes: a post-hoc analysis of a randomized clinical trial. Gut Microbes. 2022;14(1):2005407. doi:10.1080/19490976.2021.2005407.
- Jayaraj P, Narasimhulu CA, Maiseyeu A, Durairaj R, Rao S, Rajagopalan S, Parthasarathy S, Desikan R. Methoxyphenol derivatives as reversible inhibitors of myeloperoxidase as potential antiatherosclerotic agents. Future Med Chem. 2020;12(2):95–110. doi:10.4155/fmc-2019-0080.
- Duboc H, Rajca S, Rainteau D, Benarous D, Maubert MA, Quervain E, Thomas G, Barbu V, Humbert L, Despras G. et al. Connecting dysbiosis, bile-acid dysmetabolism and gut inflammation in inflammatory bowel diseases. Gut. 2013;62(4):531–539. doi:10.1136/gutjnl-2012-302578.
- Cowen AE, Korman MG, Hofmann AF, Cass OW, Coffin SB. Metabolism of lithocholate in healthy man. II. Enterohepatic circulation. Gastroenterology. 1975;69(1):67–76. doi:10.1016/S0016-5085(19)32637-X.
- Huijghebaert SM, Eyssen HJ. Specificity of bile salt sulfatase activity from Clostridium sp. strains S1. Appl Environ Microbiol. 1982;44(5):1030–1034. doi:10.1128/aem.44.5.1030-1034.1982.
- Huijghebaert S, Parmentier G, Eyssen H. Specificity of bile salt sulfatase activity in man, mouse and rat intestinal microflora. J Steroid Biochem. 1984;20(4A):907–912. doi:10.1016/0022-4731(84)90404-7.
- Jia W, Xie GX, Jia WP. Bile acid-microbiota crosstalk in gastrointestinal inflammation and carcinogenesis. Nat Rev Gastroenterol Hepatol. 2018;15(2):111–128. doi:10.1038/nrgastro.2017.119.
- Hua YL, Jia YQ, Zhang XS, Yuan ZW, Ji P, Hu JJ, Wei Y-M. Baitouweng Tang ameliorates DSS-induced ulcerative colitis through the regulation of the gut microbiota and bile acids via pathways involving FXR and TGR5. Biomed Pharmacother. 2021;137:111320. doi:10.1016/j.biopha.2021.111320.
- Wahlstrom A, Sayin SI, Marschall HU, Backhed F. Intestinal crosstalk between bile acids and microbiota and its impact on host metabolism. Cell Metab. 2016;24(1):41–50. doi:10.1016/j.cmet.2016.05.005.
- Chiang JY. Bile acids: regulation of synthesis. J Lipid Res. 2009;50(10):1955–1966. doi:10.1194/jlr.R900010-JLR200.
- Lajczak-McGinley NK, Porru E, Fallon CM, Smyth J, Curley C, McCarron PA, Tambuwala MM, Roda A, Keely SJ. The secondary bile acids, ursodeoxycholic acid and lithocholic acid, protect against intestinal inflammation by inhibition of epithelial apoptosis. Physiol Rep. 2020;8(12):e14456. doi:10.14814/phy2.14456.
- Yoneno K, Hisamatsu T, Shimamura K, Kamada N, Ichikawa R, Kitazume MT, Mori M, Uo M, Namikawa Y, Matsuoka K. et al. TGR 5 signalling inhibits the production of pro-inflammatory cytokines by in vitro differentiated inflammatory and intestinal macrophages in Crohn’s disease. Immunology. 2013;139(1):19–29. doi:10.1111/imm.12045.
- Sun X, Winglee K, Gharaibeh RZ, Gauthier J, He Z, Tripathi P, Avram D, Bruner S, Fodor A, Jobin C. et al. Microbiota-derived metabolic factors reduce campylobacteriosis in mice. Gastroenterology. 2018;154(6):1751–1763 e2. doi:10.1053/j.gastro.2018.01.042.
- Strauch ED, Yamaguchi J, Bass BL, Wang JY. Bile salts regulate intestinal epithelial cell migration by nuclear factor-kappa B-induced expression of transforming growth factor-beta. J Am Coll Surg. 2003;197(6):974–984. doi:10.1016/S1072-7515(03)00720-8.
- Sun J, Mustafi R, Cerda S, Chumsangsri A, Xia YR, Li YC, Bissonnette M. Lithocholic acid down-regulation of NF-κB activity through vitamin D receptor in colonic cancer cells. J Steroid Biochem Mol Biol. 2008;111(1–2):37–40. doi:10.1016/j.jsbmb.2008.01.003.
- Alnouti Y. Bile acid sulfation: a pathway of bile acid elimination and detoxification. Toxicol Sci. 2009;108(2):225–246. doi:10.1093/toxsci/kfn268.
- Hamilton JP, Xie G, Raufman JP, Hogan S, Griffin TL, Packard CA, Chatfield DA, Hagey LR, Steinbach JH, Hofmann AF. et al. Human cecal bile acids: concentration and spectrum. Am J Physiol Gastrointest Liver Physiol. 2007;293(1):G256–263. doi:10.1152/ajpgi.00027.2007.
- Van Eldere J, Robben J, De Pauw G, Merckx R, Eyssen H. Isolation and identification of intestinal steroid-desulfating bacteria from rats and humans. Appl Environ Microbiol. 1988;54(8):2112–7. doi:10.1128/aem.54.8.2112-2117.1988.
- Meinl W, Sczesny S, Brigelius-Flohé R, Blaut M, Glatt H. Impact of gut microbiota on intestinal and hepatic levels of phase 2 xenobiotic-metabolizing enzymes in the rat. Drug Metab Dispos. 2009;37(6):1179–1186. doi:10.1124/dmd.108.025916.
- Vázquez-Baeza Y, Gonzalez A, Xu ZZ, Washburne A, Herfarth HH, Sartor RB, Knight R. Guiding longitudinal sampling in IBD cohorts. Gut. 2018;67(9):1743–1745. doi:10.1136/gutjnl-2017-315352.
- Colombel JF, Rutgeerts P, Reinisch W, Esser D, Wang Y, Lang Y, Marano CW, Strauss R, Oddens BJ, Feagan BG. et al. Early mucosal healing with infliximab is associated with improved long-term clinical outcomes in ulcerative colitis. Gastroenterology. 2011;141(4):1194–1201. doi:10.1053/j.gastro.2011.06.054.
- Pavlidis P, Gulati S, Dubois P, Chung-Faye G, Sherwood R, Bjarnason I, Hayee B. Early change in faecal calprotectin predicts primary non-response to anti-TNFα therapy in Crohn’s disease. Scand J Gastroenterol. 2016;51(12):1447–1452. doi:10.1080/00365521.2016.1205128.