
ABSTRACT
Xanthohumol (XN), a polyphenol found in the hop plant (Humulus lupulus), has antioxidant, anti-inflammatory, prebiotic, and anti-hyperlipidemic activity. Preclinical evidence suggests the gut microbiome is essential in mediating these bioactivities; however, relatively little is known about XN’s impact on human gut microbiota in vivo. We conducted a randomized, triple-blinded, placebo-controlled clinical trial (ClinicalTrials.gov NCT03735420) to determine safety and tolerability of XN in healthy adults. Thirty healthy participants were randomized to 24 mg/day XN or placebo for 8 weeks. As secondary outcomes, quantification of bacterial metabolites and 16S rRNA gene sequencing were utilized to explore the relationships between XN supplementation, gut microbiota, and biomarkers of gut health. Although XN did not significantly change gut microbiota composition, it did re-shape individual taxa in an enterotype-dependent manner. High levels of inter-individual variation in metabolic profiles and bioavailability of XN metabolites were observed. Moreover, reductions in microbiota-derived bile acid metabolism were observed, which were specific to Prevotella and Ruminococcus enterotypes. These results suggest interactions between XN and gut microbiota in healthy adults are highly inter-individualized and potentially indicate that XN elicits effects on gut health in an enterotype-dependent manner.
Introduction
Xanthohumol (XN) is one of the primary polyphenols found in the hop plant (Humulus lupulus). Traditionally, hops have been a key ingredient in beer, contributing not only to its flavor and aroma, but extending shelf-life by suppressing microbial growth.Citation1 Recently, XN has emerged as a candidate dietary supplement for biomedical applications due to its anti-inflammatory, chemo-preventive, and anti-obesogenic properties.Citation2–8 This has been especially true for models of metabolic syndrome, where XN exerts protection against a mantle of adverse effects arising from a high fat diet (HFD). For example, when administered to HFD-fed mice, XN ameliorates obesity-related metabolic impairments, including dysfunctional glucose and lipid metabolism, chronic inflammatory processes, and insulin resistance.Citation4,Citation5 Similar to other polyphenols, XN is relatively poorly absorbed.Citation9,Citation10 This characteristic has spurred investigations into the mechanisms by which XN interacts with the gut microbiota to mediate its biological effects. Notably, while conventional mice fed a HFD supplemented with XN were protected against metabolic impairments, these protections were lost in their germ-free counterparts, underscoring the role the gut microbiome plays in mediating XN’s beneficial effects on health.Citation7,Citation11
Since gut microbiota influence host health processes through the generation or restriction of microbial metabolites, it is conceivable the XN exerts its biological effects through modulation of gut microbiota and in turn, their metabolism. Evident through preclinical investigations, XN exerts selective anti-microbial effects on gut microbiota, enhancing the proliferation of certain taxa while impeding the growth of others. Notably, XN and its metabolites exhibit robust anti-bacterial properties in vitro against the anaerobic pathogens Bacteroides fragilis, Clostridium perfringens, and Clostridioides difficile.Citation12 In mice subjected to HFD-induced gut microbiome dysbiosis, XN and its metabolite, α,β-dihydroxanthohumol (DXN), elicit significant alterations in microbiota composition.Citation7,Citation11 These shifts in community structure were concomitant with reductions in microbiota-derived secondary bile acids, representing a potential mechanism underpinning XN’s bioactivity. Additionally, intestinal microbiota metabolize XN into several key metabolites with unique bioactivity compared to the parent compound (), which suggests that variability in the metabolism of XN may have a sizable effect on downstream bioactivity.Citation13–17 For example, microbial-driven O-demethylation produces 8-prenylnaringenin (8 PN), the most potent phytoestrogen identified to date.Citation18,Citation19 Alternatively, a distinct metabolic pathway wherein commensal microbiota catalyze the irreversible reduction of the enone C-C double bond generates DXN, a compound with little residual estrogenic activity.Citation5,Citation15 Moreover, DXN has demonstrated pronounced anti-obesogenic properties in murine models fed a HFD, surpassing the effects of XN.Citation5,Citation7,Citation16 Thus, variability in the bidirectional modulation between XN and the gut microbiota may impact overall bioactivity and the translational utility for human applications.
Figure 1. Metabolism of XN and related prenylflavonoids by gut microbiota. The conversion between XN and IXN can happen spontaneously. XN, xanthohumol; DXN, α,β-dihydroxanthohumol; IXN, isoxanthohumol; 8 PN, 8-prenylnarigenin; DMX, desmethylxanthohumol; DDXN, O-desmethyl- α,β-dihydroxanthohumol; 6 PN, 6-prenylnaringenin.
While a substantial body of preclinical research with XN has focused on host-level effects, its specific action on the gut microbiota holds promise as a therapy for a number of conditions. Nevertheless, our current understanding of how XN influences the gut ecology of healthy adults in vivo remains limited. We conducted a comprehensive investigation utilizing a randomized, triple-blinded, placebo-controlled clinical trial to primarily assess safety and tolerability of XN as an oral dietary supplement, which has been previously reported.Citation20,Citation21 To further investigate the impact on the gut ecology, the objective of this study was to characterize the impact of daily XN supplementation on the gut microbiota of healthy adults, as well as to characterize the reciprocal influence of gut microbiota on XN metabolism. To our knowledge, this is the first study that has investigated this bidirectional relationship in healthy adults in vivo. As part of a comprehensive assessment, we examined important classes of microbial metabolites, including those of XN, short-chain fatty acids (SCFAs) and bile acids. Furthermore, we assessed the repercussion of XN supplementation on host intestinal health, through markers of gut barrier function, bacterial translocation, and acute inflammatory processes. This approach provides a comprehensive understanding of the impacts of XN supplementation on the complex interplay between gut microbiota, their metabolism and host physiology.
Results
Participant characteristics
Thirty participants were randomized into the Xanthohumol Metabolism and Signature (XMaS) trial (Supplementary Figure S1) and their characteristics have been previously reported in detail.Citation21 Participant characteristics at baseline are described in . Fourteen (eight women, six men) participants were allocated to placebo and 16 (8 women, 8 men) participants were allocated to XN. Of the placebo group, one participant was lost to follow-up. Of the XN group, two participants withdrew due to the use of a restricted supplement per our exclusion criteria. A total of 27 participants (n = 13 in placebo, n = 14 in XN) completed the trial and are included in the results that follow.
Table 1. Participant characteristics by intervention group.
XN supplementation had no impact on microbial community structure or measures of gut health in healthy adults
To evaluate the impact of XN on the healthy human gut microbial community structure, alpha- and beta-diversity analyses were conducted. For all measures of alpha diversity, fitted with linear mixed effect models, no significant differences were found between treatment and controls at baseline (p = .32 for richness, p = .08 for Simpson, and p = .06 for Shannon) indicating these groups were suitable for comparisons. No significant differences were found between treatment groups for any measures throughout the study (p = 0.91 for richness, p = .32 for Simpson, and p = .18 for Shannon at study close-out; Supplementary Figure S2 and Table S1), suggesting low doses of XN ingested over 8 weeks did not significantly alter gut microbiota alpha-diversity within subjects. Notably, Simpson and Shannon diversity between treated and control groups at baseline were near our significance alpha-threshold (p = .08 for Simpson, and p = .06 for Shannon), potentially obfuscating effects from XN on alpha-diversity throughout the study. To assess compositional difference of gut microbiota between subjects, we analyzed beta diversity by Bray Curtis and Jaccard metrics using permutational analysis of variance (PERMANOVA). At baseline, neither sex (p = 0.24) nor BMI (p = 0.28) were found to be significantly different, suggesting these characteristics were not driving variation in gut microbiota compositions. No significant differences were detected between treatment and control groups (p = .48at study close-out). Similarly, no significant differences were detected within the treatment group across time points (p = 1.0).
To determine the effects of XN supplementation on gut health, short- and branch-chain fatty acid production by gut microbiota, markers of inflammation, enterocyte damage, and bacterial translocation were measured in healthy adults. No significant differences were observed between XN-treated and control groups or within the XN-treated group over time in fecal SCFAs, including acetate, propionate, and butyrate, as well as lactate, valerate, isobutyrate, 2-methylbutyrate, and isovalerate (Supplementary Figure S6). Similarly, no significant differences were observed between XN-treated and control groups or within the XN-treated group over time for inflammatory markers (cytokines IL-12, TNF, IL-10, IL-6, IL-1β, and IL-8), markers of enterocyte damage and bacterial translocation (intestinal fatty acid-binding protein (I-FABP), soluble CD14 (sCD14), plasma endotoxin, and lipopolysaccharide-binding protein (LBP)) (Supplementary Table S2).
XN changes abundance of individual taxa in an enterotype-dependent manner
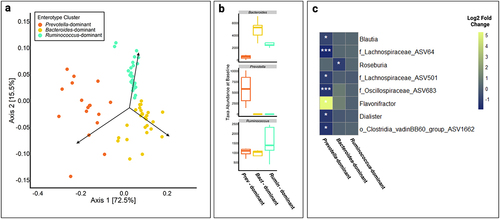
To identify genera that were differentially abundant between intervention groups or within the XN-treated group over time, we utilized negative binomial generalized linear mixed-effect models built for each genus. There were no significant differences between the XN-treated and control group, or within the control group, considering all time points. To assess whether microbial community substructure responded to XN supplementation differently, we conducted a differential abundance analysis based on enterotype clustering within the XN-treated group. Enterotype clusters were defined by partitioning around medoid (PAM) clustering of the Jensen-Shannon β-diversity dissimilarity matrix and confirmed through variable abundance of Bacteroides, Prevotella, and Ruminococcus (). Although, in general, these taxa exist along a gradient between enterotypes, Bacteroides and Prevotella are the driving taxa that delineate the main sources of inter-individual variation in healthy adults. In the XN-treated group, an individual’s enterotype cluster at baseline was used for the differential abundance analysis (Bacteroides, n = 5; Prevotella, n = 4; Ruminococcus, n = 5). All individuals remained in the same cluster throughout the 8-week study, except for one participant (#113) who started and ended in the Prevotella cluster but moved to the Ruminococcus cluster in weeks 2 and 4, and the Bacteroides cluster in week 6. We did not see uniform changes in beta-diversity over time depending on enterotype clustering (p = 1.0). That said, linear regression analyses revealed a suite of specific taxa whose relative abundance in the gut varied in response to XN in an enterotype-dependent manner. Specifically, we developed linear mixed effect negative binomial models for each taxon that compared the taxon’s relative abundance at baseline and end-of-study measures while accounting for an individual’s baseline enterotype state. Individuals with a Prevotella enterotype, almost exclusively, had taxa change in relative abundance after 8-week supplementation with XN (). In the Prevotella enterotype, XN decreased relative abundance of unannotated members of Lachnospiraceae, Oscillospiraceae, and Clostridia, Blautia, and Dialister, as well as increased Flavonifractor. In the Bacteroides enterotype, XN decreased Roseburia. Moreover, these genera were present in all clusters, suggesting that dynamics within the Prevotella and, to a lesser extent Bacteroides, enterotypes sensitizes these genera to XN supplementation.
Figure 2. (a) Principal coordinate analysis (PCoA) showing beta-diversity of XN-treated individuals across all time points. Enterotype clusters, indicated by different colors, were determined using partitioning around medoids (PAM) clustering of Jensen-Shannon diversity indices and robustness of clusters were assessed using the silhouette validation technique (average silhouette = 0.51). Each point represents a sample. (b) Each enterotype cluster was confirmed by variable abundance of one of three genera: Prevotella, Bacteroides, and Ruminococcus, and labeled by the dominant genera. (c) Genera with significantly different relative abundance between baseline and end-of-study (day 56) measures by enterotype clustering at baseline (Bacteroides, n = 5; Prevotella, n = 4; Ruminococcus, n = 5), as determined using a negative binomial generalized linear mixed effect model. The x-axis represents each baseline enterotype cluster and the y-axis represents genera. The color of each box represents the log2 fold change between baseline and day 56. o_ASV# or f_ASV# indicates an unannotated member of the order or family shown, respectively. White asterisks represent statistical significance after multiple testing correction. *, p < .05; **, p < .01; ***, p < .001.
Microbial metabolism of XN was highly variable between individuals & by enterotype
To determine the influence of gut microbiota on metabolic profiles of XN, we quantified the major metabolites of XN from fecal, plasma, and 24-hour urine collections. XN and metabolites of XN were undetected in individuals from the placebo group. presents inter-individual variation in metabolite concentration in fecal samples from the XN-treated group. Plasma and 24-hour urine concentrations are presented in Supplementary Figures S3 and S4. Although no significant differences in concentrations were found between timepoints after baseline in XN-treated participants, high inter-individual variation in metabolite production was observed. To the best of our knowledge, we are the first to report DXN and DDXN as fecal metabolites of XN in vivo (). To better understand how microbial metabolism of XN corresponds to circulating and excreted metabolite levels, we conducted Spearman’s correlation analyses between fecal concentrations plasma or 24-hour urine concentrations (Supplementary Figure S5). Significant positive correlations were found for IXN (plasma, r = 0.69, p < .001; urine, r = 0.69, p < .001),8 PN (plasma, r = 0.52, p < .001; urine r = 0.79, p < .001). DXN (urine, r = 0.70, p < .001) and DDXN (urine, r = 0.40, p < .001). By contrast, non-significant correlations were found between fecal and plasma DXN and DDXN concentrations since low or insufficient quantities were detected in plasma (DXN, r = 0.02, p = .86; DDXN, r = undefined as DDXN was undetected in plasma).
Figure 3. (a) Quantification of xanthohumol (XN) and metabolites of XN, isoxanthohumol (IXN), 8-prenylaringenin (8 PN), α,β-dihydroxanthohumol (DXN), and O-desmethyl-α,β-dihydroxanthohumol (DDXN), and 6-prenylnaringenin (6 PN) from fecal samples of XN treated individuals using selective reaction monitoring (SRM) LC-MS/MS. The colored lines represent the concentration of metabolites from each individual (n = 14) over time and the solid gray bars represent the mean concentration of metabolites measured at each time point. (b) Mean concentration of 6-prenylnaringenin (6 PN), 8-prenylaringenin (8 PN), O-desmethyl-α,β-dihydroxanthohumol (DDXN), and α,β-dihydroxanthohumol (DXN) from fecal samples of XN treated individuals over time and grouped by enterotypes. Each stacked bar represents mean concentration by time point in XN-treated participants. Relative to the Bacteroides enterotype (n = 5), the Prevotella enterotype (n = 4) produced significantly greater amounts of 6 PN (p = .05), 8 PN (p = .05), and DDXN (p = .02). Similarly, relative to the Bacteroides enterotype (n = 5), the Ruminococcus enterotype (n = 5) produced significantly greater amounts of 8 PN (p = .02) and DDXN (p = .02). This suggests that individuals with Prevotella or Ruminococcus enterotypes are higher metabolizers of XN, while individuals with Bacteroides enterotypes are lower metabolizers. There were no significant differences in DXN generation between enterotypes, suggesting each metabolize XN through this pathway. Prevotella and Ruminococcus enterotypes additionally metabolize XN through the 8 PN to DDXN pathway. Statistical significance was determined with linear mixed effect regression, modeling mean concentrations after baseline, with enterotype as a fixed effect and each participant as a random effect. Benjamini-Hochberg procedure was used to correct for multiple testing. (c) Concentrations of 8-prenylnaringenin (8 PN) production varied by BMI category in fecal (p = .03), plasma (p = .02), and 24-hr urine collections (p = .03). Each point represents mean concentration by time point and error bars represent SEM in XN-treated participants. “Healthy” BMI (n = 11) is defined as a BMI between 18.5 and 24.9 and “overweight” BMI (n = 3) is defined as a BMI between 25 and 29.9. Statistical significance was determined with linear mixed effect regression using time and BMI as fixed effects and each participant as a random effect. Benjamini-Hochberg procedure was used to correct for multiple testing.
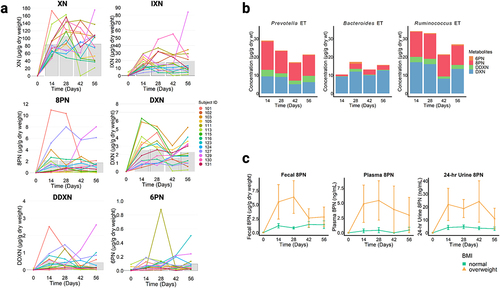
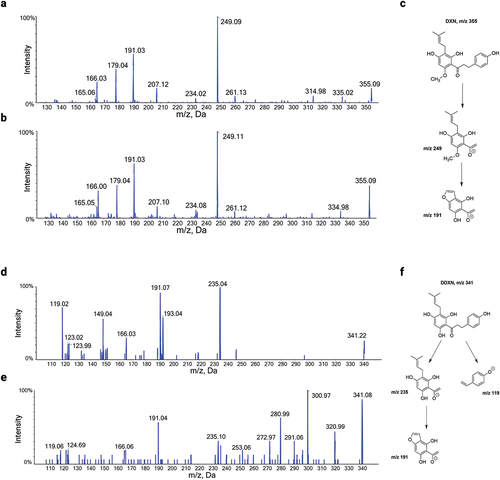
Figure 4. (a) HPLC-MS/MS product ion spectrum of a DXN (m/z 355) standard spiked in fecal matrix in negative ion mode. (b) HPLC-MS/MS product ion spectrum of DXN in negative ion mode from fecal samples of participant 115 at two weeks. (c) Proposed structures for the major MS/MS product ions of DXN in negative ion mode. (d) HPLC-MS/MS product ion spectrum of DDXN (m/z 341) in negative ion mode after incubation of 8 PN with Eubacterium ramulus.Citation1 (e) HPLC-MS/MS product ion spectrum of DDXN in negative ion mode from fecal samples of participant 101 at two weeks. Contamination by additional fragment ions originate from molecular ions of m/z 341 in feces that co-elute with DDXN. (f) Proposed structures for the major MS/MS product ions of DDXN in negative ion mode.
To examine if XN metabolite production was associated with an individual’s gut enterotype, we conducted one-way random effects models for repeated measures of the XN-treated group after baseline using enterotype cluster as a fixed effect and each participant as a random effect. The Prevotella and Ruminococcus enterotypes generated similar amounts of XN metabolites to each other, but significantly greater amounts compared to the Bacteroides enterotype (). Relative to the Bacteroides enterotype, Prevotella enterotypes produced significantly greater amounts of 6 PN (p = .05), 8 PN (p = .05), and DDXN (p = .02). Similarly, Ruminococcus enterotypes produced significantly greater amounts of 8 PN (p = .02) and DDXN (p = .02). This suggests that Prevotella or Ruminococcus enterotypes are higher metabolizers of XN, while Bacteroides enterotypes are lower metabolizers. There were no significant differences in DXN generation between enterotypes, suggesting all are similarly capable of this biotransformation, while Prevotella or Ruminococcus enterotypes have gut microbiota that utilize the 8 PN to DDXN pathway to a greater extent.
To examine if XN metabolite production was associated with participant characteristics, linear mixed effect regression analyses were conducted for the XN-treated group. ‘Sex’ and ‘BMI’ (normal, 18.5 to 24.9; overweight, 25 to 29.9) as categorical variables and ‘time’ as a continuous variable were used as fixed effects, with each study participant as a random effect. A model was built for each metabolite from each sample site (fecal, plasma, and urine) and significance was determined at an FDR-corrected threshold of 0.05 for each covariate. BMI was found to be a significant covariate for fecal, plasma, and urine levels of 8 PN. Specifically, individuals with “overweight” BMI (25 to 29.9) were found to have higher concentrations of 8 PN production ().
Individual taxa were associated with XN metabolites
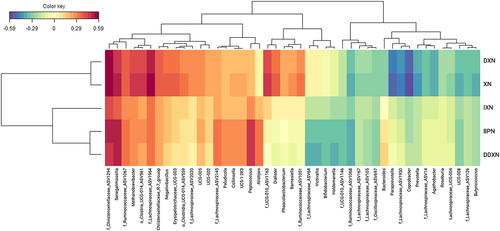
A sparse Partial Least Squares (sPLS) model, retaining 2 components, was used to select 50 genera most predictive of XN metabolite concentrations (). A strong concordance in associations were observed for XN, IXN, 8 PN, DXN, and DDXN, but not 6 PN, likely due to the negligible 6 PN production in most individuals. Senegalimassilia, Methanobrevibacter, and unclassified genera belonging to Lachnospiraceae, Clostridia UCG-014, Christensenellaceae, and Ruminococcaceae were positively associated with XN and production of IXN, 8 PN, DXN, and DDXN. Additionally, Dialister and an unclassified member of Ruminococcaceae UCG-010 were positively associated with XN and DXN levels, while Peptococcus and Alistipes were positively associated with IXN, 8 PN, and DDXN levels. Paraprevotella, Agathobacter, Coprobacter, Prevotella, and several unclassified genera of Lachnospiraceae were negatively associated with XN and DXN production.
Figure 5. A heatmap representation of a sparse partial least squares (sPLS) regression analysis of the fecal microbial community composition data at the genus level and the concentration of XN and XN metabolites in XN-treated participants after baseline. Associations with correlation coefficients between –0.25 and 0.25 were filtered from the heatmap, which removed all associations with 6 PN.
Microbiota-derived bile acids vary by enterotype following XN supplementation
To determine the impact of XN supplementation on bile acid composition and conversion by gut microbiota, 25 individual bile acids were quantified in fecal samples (Supplementary Table S3). Total bile acid pool size was not significantly different between treatment and control groups (at study close-out, p = 0.75) or within the XN treated group compared to baseline (p = 0.67). Individual bile acids were grouped into classes based on chemical relatedness to determine the impact on bile acid composition, including conjugated, unconjugated, primary (cholic acid, chenodeoxycholic acid), primary conjugated (glycine- and taurine-cholic acid and chenodeoxycholic acid), and secondary (lithocholic acid, deoxycholic acid) bile acids. While no significant differences were found between the treatment and control groups, a significant reduction in unconjugated bile acids (p = .05) and secondary bile acids (p = .03) at 42 days was observed within the XN-treated group compared to baseline measures (). The mild changes in bile acid composition returned to levels comparable to baseline by study close.
Figure 6. (a) Concentrations of microbially derived bile acids significantly decreased in the XN-treated group at 42 days compared to baseline levels but returned to baseline by study close-out. Each point represents mean concentration by time point and error bars represent SEM. Statistical significance was determined with linear mixed effect regression using the interaction of treatment and time as a fixed effects and each participant as a random effect. Benjamini-Hochberg procedure was used to correct for multiple testing. (b) Statistically significant reduction in microbially derived bile acids in the XN-treated group were specific to Prevotella (n = 4) and Ruminococcus (n = 5) enterotype clusters (unconjugated bile acids, p = .01; secondary bile acids, p = .005). These changes in bile acid composition remained borderline statistically significant for these groups at study close-out (day 56: unconjugated bile acids, p = .06; secondary bile acids, p = .05), but the effect was originally overwhelmed by the variable signal that resulted from including the Bacteroides enterotype (n = 5). Each point represents mean concentration by time point and error bars represent SEM. Statistical significance was determined with linear mixed effect regression using the enterotype cluster and time as a fixed effects and each participant as a random effect. Benjamini-Hochberg procedure was used to correct for multiple testing.
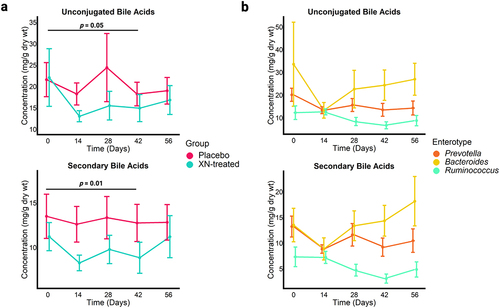
To better understand if these mild, but significant reductions in microbial-derived bile acids varied by gut enterotype, we fitted mixed effect models for the XN-treated group using baseline enterotype cluster and time as fixed effects, and each participant as a random effect. When each enterotype cluster was considered separately, no statistically significant changes were detected. However, when Prevotella and Ruminococcus enterotypes were considered together, significant changes in bile acid composition were detectable which diverged from the Bacteroides enterotype (). Compared to the Bacteroides enterotype, Prevotella and Ruminococcus were responsible for the statistically significant reduction in unconjugated (p = .01) and secondary bile acids (p = .005) during the 42-day time point. The changes in bile acid composition remained borderline statistically significant for these groups at study close-out as well (day 56: unconjugated bile acids, p = .06; secondary bile acids, p = .05), again suggesting an enterotype-dependent effect from XN supplementation. Additionally, the Bacteroides enterotype had significantly reduced unconjugated bile acids (p = .04) and borderline significantly reduced secondary bile acids (p = .07) during day-14, which were originally undetected when considering enterotypes together.
Discussion
In this study, we sought to determine the impact of 8-week XN supplementation on gut microbiota and markers of gut health in healthy adults. Additionally, we aimed to determine the metabolic profiles of XN in healthy individuals. We observed that XN metabolism was highly variable between individuals and fecal metabolic profiles correlated well with circulating levels, suggesting the gut microbiota drive variation in XN metabolism. Along a spectrum of low to high metabolizers, we observed that individuals of the Prevotella and Ruminococcus enterotypes were high metabolizers of XN. Additionally, the abundance of XN metabolites were associated with specific microbial taxa. We did not observe changes to alpha- or beta-diversity compositional measures, nor changes in abundance of individual genera among the entire treatment group compared to controls. Instead, XN altered abundances of individual taxa in a subset of treated individuals within specific enterotypes, which potentially indicates that supplementation elicits microbiome-dependent effects in an enterotype-specific manner. Furthermore, a reduction in microbial-derived bile acids was observed, driven specifically by the Prevotella and Ruminococcus enterotypes, a potential mechanism by which XN exerts beneficials health effects. Overall, this study demonstrates that the impacts of XN on the gut environment in healthy adults are highly inter-individualized and contextually dependent on gut enterotypes, potentially supporting its use for personalized nutritional therapy.
We observed that XN supplementation changes the relative abundances of individual taxa within certain enterotypes. More specifically, individuals with a Prevotella enterotype almost exclusively had taxa that changed relative abundance between baseline and the end of the 8-week trial, which is consistent with the established antibacterial, antifungal, and antiviral activity of XN and its derivatives.Citation12,Citation22–24 Enterotypes describe reproducible, compositional patterns in gut microbiomes that cluster together in an ordination plot and are defined by variable abundance of one of three genera delineating the main sources of variation: Prevotella, Bacteroides, and Ruminococcus.Citation25,Citation26 In general, the number of studies investigating enterotypes and their biological significance are limited. However, it is evident that gut enterotypes correlate with long-term dietary patterns, where a diet enriched in carbohydrates and simple sugars has been linked to a Prevotella-dominant enterotype, while diets high in animal protein and saturated fat has been linked to a Bacteroides-dominant enterotype.Citation27 Since the Prevotella enterotype has been linked with higher carbohydrate and fiber intake, it is conceivable that the results of our study could be confounded by a higher relative intake of dietary polyphenols. However, participants in our study were asked to maintain a consistent diet, exercise, supplement, and medication regimen. And because baseline measures were used as within-subject controls, we would not expect dietary polyphenols to enhance an effect from XN supplementation. Instead, regular consumption of dietary polyphenols would likely obscure time-dependent effects from XN supplementation. XN’s impact on the Prevotella-dominant enterotype may be one mechanism for its anti-obesogenic activity in preclinical models.Citation4 Zhang et al. suggest that increased energy harvest in obese individuals is related to efficient hydrogen metabolism within the gut microbiome as they report a concurrent increase in both hydrogen-producing Prevotellaceae and hydrogen-utilizing methanogenic Archaea.Citation28 XN supplementation may disrupt the dynamic metabolic interactions within the Prevotella-dominant ecology, thereby reducing energy harvest and utilization for the host. Several lines of evidence find obese individuals with a greater Prevotella/Bacteroides ratio have a greater beneficial response to gut microbiome-targeted therapies.Citation29,Citation30
This is the first time, to the best of our knowledge, that specific members of the gut microbiota have been investigated in vivo in relation to XN metabolism. In our approach, sPLS regression identified members from Lachnospiraceae, Christensenellaceae, Senegalimassilia, Ruminococcaceae, and Methanobrevibacter positively associated with XN, IXN, 8 PN, DXN, and DDXN production. Additionally, we observed positive associations for XN and DXN levels with Ruminococcaceae UCG-010 and Dialister. Positive associations for IXN, 8 PN, and DDXN levels with Peptococcus and Alistipes were observed as well. The similar associations between various XN metabolites and individual taxa may not only represent microbes that are responsible for XN catabolism, but microbiota that favor these conditions indirectly. For example, methanogens, such as Methanobrevibacter, may not be responsible for the conversion of IXN to 8 PN, but thrive under the conditions of high 8 PN production by utilizing the byproduct, formate, to form methane, a well-established pathway of hydrogenotrophic methanogenic archaea. In support, Bolca et al. found that 8 PN production from human fecal microbiota positively correlated with pulmonary methane levels, which occurs with concentrations of Methanobrevibacter smithii above 108/g dry weight of feces.Citation31 It is plausible that Lachnospiraceae and Peptococcus are capable of XN biotransformation as members from these taxa have previously been reported in the O-demethylation of flavones and lignans, respectively,Citation32–34 a reaction analogous to the conversion of IXN to 8 PN. Previous work in mice has shown that XN and DXN supplementation exert complex changes on the bacterial families, Lachnospiraceae and Ruminococcaceae. Although XN and DXN supplementation reduced relative abundance of each family, specific genera within both families were increased over 10-fold.Citation7 One member of Lachnospiraceae (Blautia sp. MRG-PMF1, previously described in genus Ruminococcus) are reported to metabolize the methoxy group from flavonoids.Citation34,Citation35 One of the strongest positive associations found in our study included an unannotated member of Christensenellaceae with XN and DXN levels. The ecological and functional role of Christensenellaceae in the gut is still under investigation but numerous corroborated studies report Christensenellaceae as positively associated with measures of leanness and health.Citation36–40 Christensenellaceae are reported to be depleted in individuals with metabolic syndromeCitation41,Citation42 and inflammatory bowel disease.Citation43–45 The strong positive association of Christensenellaceae with XN administration may be partially responsible for the gut microbiota-dependent, anti-obesogenic effects of XN and its derivatives.Citation4,Citation5,Citation11 Further investigations are needed to understand the role of these microbes more completely in the context of XN metabolism and interactions with host phenotypes.
To better understand how XN supplementation impacts microbial metabolism, we profiled several classes of microbial metabolites. Consistent with previous investigations, we observed metabolic profiles of XN are driven by metabolism in the gut and exist along a spectrum of low to high metabolizers.Citation14 Although not strictly exclusive, XN metabolite production was associated to a greater extent with Prevotella and Ruminococcus enterotypes, suggesting these are high metabolizer types. Additionally, we observed mild, but statistically significant reductions in unconjugated and secondary bile acids during day 42, which were driven by and persisted to study close-out for Prevotella and Ruminococcus enterotypes. Consistent with preclinical work, these findings may represent one mechanism through which XN promotes health, since the reduction in bile acid conversion is linked to reduced obesity, insulin resistance and fatty liver disease.Citation7,Citation46,Citation47 The reduction in relative abundance of specific taxa in Prevotella enterotypes may partially explain these observations, since many of the taxon affected, such as members of Lachnospiraceae and Oscillospiraceae, harbor 7α-dehydroxylase genes responsible for secondary bile acid generation.Citation48–50 Unexpectedly, taxa within the Ruminococcus enterotypes were seemingly unperturbed by XN. This might be explained by higher alpha-diversity reported in this group,Citation51,Citation52 where our genus-level analysis obscured species- or strain-level impacts on taxa relative abundance. Further studies employing a metagenomic approach are needed to investigate these outstanding questions.
Cumulatively, these results indicate that low-dose, daily supplementation with XN for 8-weeks produces mild changes to the gut environment in healthy adults. In concordance with previous work, gut microbiota drive metabolism of XN in highly inter-individualistic patterns of metabolite generation and bioavailability. XN reshaped the gut microbiota in an enterotype-dependent manner, where relative abundance of taxa within the Prevotella enterotype almost exclusively changed with supplementation. Additionally, microbial-derived bile acid metabolism, which is closely linked to various health outcomes, was reduced in an enterotype-dependent manner. Future studies are needed to confirm these impacts on tgut microbiota, especially at higher doses in vivo. Collectively, these findings may indicate that XN supplementation modulate gut ecology in an enterotype-dependent manner, positioning it as a potential precision medicine therapeutic. Future work conducted with larger human cohorts will be necessary to further understand XN-microbiota interactions and the translational utility of XN as a gut microbiome-targeted therapy.
Methods
Trial design, participant intervention, and outcomes
We conducted a randomized, triple-masked, placebo-controlled clinical trial approved by the institutional review board (IRB) at the National University of Natural Medicine (NUNM) (IRB: # RB9718), registered on ClincialTrails.gov (NCT03735420, Registered Nov. 18, 2018). Participants were recruited at the Helfgott Research Institute at NUNM in Portland, OR, between September 2019 and May 2020. The study was conducted under an Investigational New Drug (IND #140626) application to the United States Food and Drug Administration (FDA). Eligible participants (aged 21–50) were those without history of chronic disease, use of prescription medication or dietary supplementation which could potentially modulate inflammatory pathways. The trial protocol and primary endpoints have been previously reported in detail.Citation20,Citation21 Primary endpoints for the trial were assessing safety and tolerability of 24 mg/day XN administered over 8 weeks in healthy adults, reported previously.Citation20,Citation21 Secondary outcomes, reported here, included XN’s effect on gut microbiota (alpha and beta-diversity, differential abundance), microbial metabolism (XN metabolites, SCFA, bile acids), and biomarkers of inflammation and enterocyte damage.
Healthy participants were randomized and allocated to either 24 mg XN or rice protein placebo taken daily as a single capsule for 8 weeks. Under the FDA-approved protocol, the dose of 24 mg/day was selected because it was the equivalent daily dose in a nutrition support formula used during our preliminary inflammatory bowel disease (IBD) trial.Citation53 Randomization was stratified by biological sex to ensure equivalent allocation in each trial arm. Because small amounts of XN may be consumed dietarily from beer, participants were excluded if microbrew beer was consumed in excess of one per day. Otherwise, consumption of beer or other alcoholic drinks were permitted unless the typical intake exceeded 2 per day. Additionally, participants were excluded if they had a history of chronic disease, BMI < 20 or > 30, were taking prescription medications, or were taking any dietary supplements that could potentially modulate inflammatory pathways. Whole blood after an overnight fast, 24-hr urine, and fecal samples were collected from 27 healthy individuals at all clinical visits, which included a baseline visit prior to randomization (week 0) and follow-up visits at 2-week intervals during the 8-week study period. While in the subjects’ possession, urine and fecal samples were refrigerated or kept on ice. Upon receipt, blood samples were centrifuged, and plasma, urine, and fecal samples were stored at −80°C at the study site until batch analyses.
Microbial sequencing, preprocessing, and data management
DNA isolation from fecal samples preserved in OMNIgene.GUT collection tubes (DNA Genotek, Ottawa, ON) was performed using a QIAamp PowerFecal DNA kit (Qiagen, Hilden, Germany) per the manufacturer’s protocol. The concentration of DNA collected from the fecal samples was assessed using a Qubit dsDNA HS assay kit (Invitrogen, Waltham, MA, USA). PCR was used to amplify the 16S rRNA gene at the V4V5 region prior to sequencing using an Illumina MiSeq to produce a sequence library following the Earth Microbiome Project protocol.Citation54 This approach produced 300 bp, paired end amplicon sequences at a targeted sequencing depth of 50,000 reads per sample. All 16S amplicon sequencing was completed at the Center for Quantitative Life Sciences core facilities (Oregon State University, Corvallis, OR, USA) following established methods.Citation55 Data preprocessing and resolution of unique amplicon sequence variants (ASVs) was conducted using the DADA2 pipeline, implemented in R (v 4.1.0).Citation56 Sequence reads were first trimmed for read quality, filtered for expected errors, paired reads were merged and chimeric ASVs were removed. Taxonomy was assigned to ASVs using the Silva database with the Naïve Bayesian classifier built into DADA2.Citation57
Analysis of the gut microbiota
All statistical analysis was conducted in R (v 4.3.1). The Benjamini–Hochberg procedure was used to correct for multiple comparisons with significance cutoff designated as an adjusted p-value of 0.05. To prevent unknown genera from being removed, ASVs without taxonomic assignment at the family or genus level were given placeholder names using the format: o_Order_ASV# or f_Family_ASV#, respectively. ASVs were then agglomerated to the genus level, reducing the total ASV count from 2152 to 1056, and taxa that were not seen more than three times in at least 20% of the samples were filtered out, resulting in a final ASV count of 132. The R packages Phyloseq (v 1.44.0) and ggplot2 (v 3.4.2) were used for data visualization and to calculate diversity metrics.Citation58,Citation59 Alpha-diversity measures were performed on un-agglomerated data prior to filtering for low abundance taxa.Citation58,Citation59 Statistical differences in alpha diversity were assessed using a linear mixed-effects model on log transformed measures of observed richness, Shannon, and Simpson indices. Beta-diversity of agglomerated and filtered data was analyzed using principal coordinate analysis (PCoA) based on Bray-Curtis and Jaccard distances of taxa transformed to relative abundance. Permutation analysis of variance (PERMANOVA) was conducted using the adonis function from the vegan package (v 2.6.4).Citation60 To identify genera that were differentially abundant between intervention groups or within the XN-treated group over time, we utilized a negative binomial generalized linear mixed-effect model with the interaction of treatment group and time as fixed effects and each participant as a random effect, implemented by the R package glmmTMB (v 1.1.7).Citation61,Citation62 All samples were rarefied to an even depth prior to fitting the model. One model was built for each genus and the Benjamini–Hochberg procedure was used to correct for multiple tests. Contrasts were examined using the glht function from the multcomp package in R (v 1.4.25).Citation63
Gut microbiota enterotype clustering and differential abundance analysis
To investigate variable responses to XN supplementation based on subtypes of healthy gut microbiota community structure, functional stratification by enterotypes was performed as previously described.Citation25,Citation26 Briefly, Jensen-Shannon divergence of the genus-level taxonomic relative abundance was calculated using XN-treated individuals over all time points. Partitioning around medoid (PAM) clustering on the β-diversity dissimilarity matrix was used to determine clusters, implemented by the cluster (v 2.1.4) package in R.Citation64 Three clusters were originally chosen, and the silhouette validation technique was used to assess the robustness of clusters. Enterotypes were identified by variable levels of genera: Bacteroides, Prevotella, or Ruminococcus. To identify genera that were differentially abundant in XN-treated group over time (baseline vs close-out) by enterotype cluster, we utilized a negative binomial generalized linear mixed-effect model which accounted for enterotype cluster at baseline, as implemented by the package glmmTMB (v 1.1.7).Citation61,Citation62 All samples of the XN-treated group were used, rarefied to even depth, and a model was built for each genus. The Benjamini–Hochberg procedure was used to correct for multiple tests. Contrasts were examined using the glht function from the multcomp package in R (v 1.4.25).Citation63
Quantification of xanthohumol metabolites
Selected reaction monitoring (SRM) LC-MS/MS was used to quantify the following XN metabolites: xanthohumol (XN), isoxanthohumol (IXN), 8-prenylnaringenin (8 PN), 6-prenylnaringenin (6 PN), α,β-dihydroxanthohumol (DXN) and O-desmethyl- α,β-dihydroxanthohumol (DDXN), using a previously described method with a modified elution gradient.Citation15 Plasma samples (50 µL) were incubated with 5 µL ascorbic acid (10% w/w in water) and 10 µL glucuronidase (20 mg/mL in water) for 3 h at 37°C. Samples were spiked with 200 µL13C3-XN internal standard (100 ng/mL in acetonitrile), vortexed, and clarified by centrifugation (13500 rpm for 10 min at 4°C). The supernatants were dried under gentle nitrogen stream and reconstituted in 100 µL 50% methanol.
Urine samples were prepared in 2 amounts to ensure analytes were within linear ranges of detection. Urine samples at 100 µL (for XN, IXN, 6 PN, and 8 PN) or 800 µL (for DXN and DDXN) were spiked with 10 µL13C3-XN internal standard (500 ng/mL in acetonitrile) and incubated with 5 µL or 20 µL ascorbic acid (10% w/w in water) and 10 µL or 80 µL glucuronidase (20 mg/mL in water), respectively, for 3 h at 37°C. The metabolites were then extracted twice with either 300 µL or 800 µL of methyl-tert-butyl-ether (MTBE), dried under gentle nitrogen stream, and reconstituted in 200 µL or 100 µL of 50% methanol in water.
Fecal samples were thawed on ice and slowly dried by vacuum desiccator for 72 h. Metabolites were extracted (50 mg/200 µL ice cold 70% methanol), mixed using a bead disruptor (6500×g for 20 s, 2×), and clarified by centrifugation (13500 rpm for 10 min at 4°C). Fecal supernatant (40 µL) was mixed with 60 µL water, 10 µL 50% methanol in water, 5 µL ascorbic acid (10% w/w in water), and 10 µL of13C3-XN internal standard (1 µg/mL in acetonitrile). Mixtures were vortexed and metabolites were sequentially separated 3 times by liquid–liquid extraction using 200 µL MTBE. The organic layer was collected, evaporated under gentle nitrogen stream, and reconstituted with 100 µL 50% methanol in water. For quantification of XN and IXN, a 1:10 (v/v) dilution was prepared. The HPLC elution gradient was as follows: from 0 to 0.5 min, 5% B; from 0.5 to 3 min, B increased to 100%; for 1 min, B was held at 100%; and the column was allowed to re-equilibrate at 5% B for 2 min, for a total 6 min cycle time. All samples were randomized and quality control samples, composed of pooled aliquots of each biological sample, were injected every 10 samples to control for technical variation.
Integration of XN metabolites and gut microbiota
To identify genera associated with XN metabolite concentrations, we employed a sparse partial least squares (sPLS) regression, implemented in the R-package mixOmics (v6.24.0).Citation65 sPLS allows the integration of heterogenous data generated from the same set of samples, in this case 16S rRNA gene sequencing (matrix X) and fecal metabolites of XN (matrix Y), by constructing latent variables maximizing the covariance between the two data sets. Genus-level ASV count data were first rarified to an even depth and centered natural log-ratio (clr) transformed to enable multivariate operations on the compositional data.Citation66 This operation consists of dividing the counts observed for an individual taxon by the geometric mean of counts for all observed taxa, followed by natural log transformation. Absolute XN metabolite concentrations were used, excluding baseline measurements since negligible amounts were detected. The model was built in regression mode with the concentrations of XN metabolites as the response variables (matrix Y) as a function of the clr-transformed genus-level count data as the predictor variables (matrix X). Two dimensions, 6 and 6 Y variables (metabolites), and 50 and 10 X variables (genera) were selected on components 1 and 2, respectively, after tuning based on a 10-fold cross validation using mean squared error (MSE).Citation67
Quantification of short-chain fatty acids
Quantification of short-chain fatty acids (SCFAs) from fecal samples followed a method adapted from Han et al.Citation68 Fecal extractions were diluted 1:5 in 50% acetonitrile in water and SCFAs were derivatized using 3-nitrophenylhydrazine (3-NPH, TCI Chemicals), 120 mM 5(1-ethyl-3-(3-dimethylaminopropyl) carbodiimide hydrochloride (EDC), and 6% pyridine (v/v in 50% acetonitrile). A mixture containing 2 µM acetic acid, 1 µM propionic acid, 0.5 µM butyric acid, 0.5 µM valeric acid, and 0.5 µM lactic acid derivatized with13C6-NPH (Cayman Chemical) was used as internal standard. LC-MS/MS was performed with a ACQUITY UPLC I-Class Plus system using a ACQUITY BEH C18 column (2.1 × 100 mm, 1.7 µm, Waters) coupled to a Xevo TQ-XS triple quadruple mass spectrometer (Waters) operating in SRM mode with negative electrospray ionization.
Quantification of bile acids
Fecal extractions were diluted 1:10 by adding 10 µL of fecal extract, 10 µL of cholic acid-D4 internal standard (1 µg/mL in ethanol; Cayman Chemical), and 80 µL of 50% methanol. The mixtures were clarified by centrifugation (13500 rpm for 10 min at 4°C) and transferred to autosampler vials. Twenty-five bile acids were quantified using SRM LC-MS/MS, as previously described using a Shimadzu 20AD system (Shimadzu; Columbia, MD, USA) with a Waters ACQUITY UPLC CSH C18 reversed phase column (130 Å, 2.1 × 100 mm, 1.7 µm; Waters Corp, Inc., Milford, MA) coupled to a triple quadrupole-linear ion trap mass spectrometer (4000 QTRP; AB Sciex; Concord, Canada).Citation6
Biomarkers of inflammation and enterocyte damage
Quantification of inflammatory cytokines (IL12, TNF, IL10, IL6, IL1b, IL8) was accomplished using BD Cytometric Bead Array Human Inflammatory Cytokines Kit (BD BioScience). Soluble CD14 was measured using Human CD14 Quantikine ELISA Kit (R&D Systems, BioTechne). Intestinal fatty acid-binding protein (I-FABP) was measured using Human FABP2/I-FABP Quantikine ELISA Kit (R&D Systems, BioTechne). Lipopolysaccharide-binding protein (LBP) was measured using Human LBP ELISA kit (ThermoFisher). Endotoxin was measured using Pierce™ Chromogenic Endotoxin Quant Kit (ThermoFisher). All procedures were performed using plasma samples according to manufacturers’ protocols.
Statistical analysis
All statistical analyses were conducted in R (v 4.3.1). For measurements of metabolites or biomarkers of gut health, unless otherwise noted, linear mixed-effects regression models were built for each metabolite or biomarker using the interaction of treatment and time as a fixed effect and each study participant as a random effect. The R package lmerTest (v 3.1.3) was used to construct models and evaluate contrasts.Citation69 Model assumptions were assessed using quantile–quantile plots and the Anderson–Darling test for normality. Response variables that violated the assumption of normality were natural log transformed for analysis. Sub-analysis of metabolites by enterotypes or participant characteristics utilized different statistical models. To assess differences in XN metabolism by enterotype clustering of individuals in the XN-treated group, one-way random effects models for repeated measures were built for measurements after baseline in the XN-treated group using an individual’s enterotype at baseline as a fixed effect and each participant as a random effect. To determine the effect of participant characteristics, separate models were fit which included sex (female, male) and BMI (normal, overweight) as fixed predictor variables. To assess differences in bile acid metabolism by enterotype clustering of individuals in the XN-treated group, linear mixed effect models were built for bile acid groups which were found to be significantly different when considering treatment and control groups. A model was built for each bile acid group, using all time points from the XN-treated individuals, that used the interaction of baseline enterotype cluster and time as fixed effects and each participant as a random effect. The Benjamini–Hochberg procedure was used to correct for multiple testing and significance was declared at an adjusted value of 0.05.
Author contributions
Conceptualization, T.J.S., T.O.M., R.B., J.F.S.; Methodology, P.E.J., J.A.B., J.C., R.E.D., C.P.W., I.L.P., T.J.S., R.B., J.F.S.; Software, P.E.J.; Validation, P.E.J., J.C., C.P.W.; Formal analysis, P.E.J.; Investigation, P.E.J., E.B.S., J.C., C.P.W., I.L.P.; Resources, R.E.D., T.J.S., T.O.M., R.B., J.F.S.; Data Curation, P.E.J., T.J.S., R.B.; Writing – Original Draft, P.E.J.; Writing – Review & Editing, P.E.J, E.B.S., J.A.B, J.C., R.E.D., C.P.W., I.L.P., C.M., E.H., T.J.S., T.O.M., R.B., J.F.S.; Visualization, P.E.J.; Supervision, R.B., T.O.M., J.F.S.; Project administration, P.E.J., R.B., T.O.M., J.F.S.; Funding Acquisition, R.B., T.O.M., J.F.S. All authors have read and agreed to the published version of the manuscript.
Supplementary Material_Final.docx
Download MS Word (1.2 MB)Acknowledgments
The authors would like to thank Gabriella Brown, as well as Jeff Morre and Liping Yang with the OSU Mass Spectrometry Center for their technical support and contributions to running experiments. The authors would also like to thank The Marion T. Tsefalas and Caron & Donald Reed Graduate Fellowship from the Linus Pauling Institute and The Center for Healthy Aging Research LIFE Scholars Summer Research Program for financial support.
Disclosure statement
The authors have no conflicts of interest to disclose.
Data availability statement
R code is available at github: https://github.com/jamiesop/Jamieson_XN_Microbiome. The targeted LC-MS/MS data obtained in this study has been submitted to the NIH Common Fund’s NMDR (supported by NIH grant, U01-DK097430) website, the Metabolomics Workbench, under study ID’s ST002941 (XN metabolites), ST002942 (short-chain fatty acids), and ST002943 (bile acids). The remaining individual participant data will be available from the corresponding author upon reasonable request.
Supplementary material
Supplemental data for this article can be accessed online at https://doi.org/10.1080/19490976.2024.2315633
Additional information
Funding
References
- Schönberger C, Kostelecky T. 125th anniversary review: the role of hops in brewing. J Inst Brew. 2011;117(3):259–19. doi:10.1002/j.2050-0416.2011.tb00471.x.
- Gao X, Deeb D, Liu Y, Gautam S, Dulchavsky SA, Gautam SC. Immunomodulatory activity of xanthohumol: inhibition of T cell proliferation, cell-mediated cytotoxicity and Th1 cytokine production through suppression of NF-κB. Immunopharmacol Immunotoxicol. 2009 Sep 1;31(3):477–484. doi:10.1080/08923970902798132.
- Lee IS, Lim J, Gal J, Kang JC, Kim HJ, Kang BY, Choi, HJ. Anti-inflammatory activity of xanthohumol involves heme oxygenase-1 induction via NRF2-ARE signaling in microglial BV2 cells. Neurochem Int. 2011 Feb 1;58(2):153–160. doi:10.1016/j.neuint.2010.11.008.
- Miranda CL, Elias VD, Hay JJ, Choi J, Reed RL, Stevens JF. Xanthohumol improves dysfunctional glucose and lipid metabolism in diet-induced obese C57BL/6J mice. Arch Biochem Biophys. 2016 Jun 1;599:22–30. doi:10.1016/j.abb.2016.03.008.
- Miranda CL, Johnson LA, de Montgolfier O, Elias VD, Ullrich LS, Hay JJ, Paraiso IL, Choi J, Reed RL, Revel JS. et al. Non-estrogenic xanthohumol derivatives mitigate insulin resistance and cognitive impairment in high-fat diet-induced obese mice. Sci Rep. 2018 Jan 12;8(1):613. doi:10.1038/s41598-017-18992-6.
- Paraiso IL, Tran TQ, Magana AA, Kundu P, Choi J, Maier CS, Bobe G, Raber J, Kioussi C, Stevens JF. Xanthohumol ameliorates Diet-Induced Liver Dysfunction via Farnesoid X Receptor-Dependent and Independent Signaling. Front Pharmacol. 2021;12. doi:10.3389/fphar.2021.643857.
- Zhang Y, Bobe G, Revel JS, Rodrigues RR, Sharpton TJ, Fantacone ML, Raslan K, Miranda CL, Lowry MB, Blakemore PR. et al. Improvements in metabolic syndrome by Xanthohumol derivatives are linked to altered gut microbiota and bile acid metabolism. Mol Nutr Food Res. 2020;64(1):1900789. doi:10.1002/mnfr.201900789.
- Colgate EC, Miranda CL, Stevens JF, Bray TM, Ho E. Xanthohumol, a prenylflavonoid derived from hops induces apoptosis and inhibits NF-kappaB activation in prostate epithelial cells. Cancer Lett. 2007 Feb 8;246(1):201–209. doi:10.1016/j.canlet.2006.02.015.
- Legette L, Karnpracha C, Reed RL, Choi J, Bobe G, Christensen JM, Rodriguez‐Proteau R, Purnell JQ, Stevens JF. Human pharmacokinetics of xanthohumol, an antihyperglycemic flavonoid from hops. Mol Nutr Food Res. 2014;58(2):248–255. doi:10.1002/mnfr.201300333.
- Legette L, Ma L, Reed RL, Miranda CL, Christensen JM, Rodriguez-Proteau R, Stevens JF. Pharmacokinetics of xanthohumol and metabolites in rats after oral and intravenous administration. Mol Nutr Food Res. 2012;56(3):466–474. doi:10.1002/mnfr.201100554.
- Logan IE, Shulzhenko N, Sharpton TJ, Bobe G, Liu K, Nuss S, Jones ML, Miranda CL, Vasquez‐Perez S, Pennington JM. et al. Xanthohumol requires the intestinal microbiota to improve glucose metabolism in diet-induced obese mice. Mol Nutr Food Res. 2021;65(21):2100389. doi:10.1002/mnfr.202100389.
- Cermak P, Olsovska J, Mikyska A, Dusek M, Kadleckova Z, Vanicek J, Nyc O, Sigler K, Bostikova V, Bostik P. et al. Strong antimicrobial activity of xanthohumol and other derivatives from hops (Humulus lupulus L.) on gut anaerobic bacteria. APMIS. 2017;125(11):1033–1038. doi:10.1111/apm.12747.
- Possemiers S, Heyerick A, Robbens V, De Keukeleire D, Verstraete W. Activation of proestrogens from hops (Humulus lupulus L.) by intestinal microbiota; conversion of Isoxanthohumol into 8-prenylnaringenin. J Agric Food Chem. 2005 Aug 1;53(16):6281–6288. doi:10.1021/jf0509714.
- Possemiers S, Bolca S, Grootaert C, Heyerick A, Decroos K, Dhooge W, De Keukeleire D, Rabot S, Verstraete W, Van de Wiele T. et al. The prenylflavonoid isoxanthohumol from hops (Humulus lupulus L.) is activated into the potent phytoestrogen 8-prenylnaringenin in vitro and in the human intestine. J Nutr. 2006 Jul 1;136(7):1862–1867. doi:10.1093/jn/136.7.1862.
- Paraiso IL, Plagmann LS, Yang L, Zielke R, Gombart AF, Maier CS, Sikora AE, Blakemore PR, Stevens JF. Reductive metabolism of Xanthohumol and 8-prenylnaringenin by the intestinal bacterium eubacterium ramulus. Mol Nutr Food Res. 2019;63(2):1800923. doi:10.1002/mnfr.201800923.
- Paraiso IL, Revel JS, Choi J, Miranda CL, Lak P, Kioussi C, Bobe G, Gombart AF, Raber J, Maier CS. et al. Targeting the Liver-Brain axis with hop-derived flavonoids improves lipid metabolism and cognitive performance in mice. Mol Nutr Food Res. 2020;64(15):2000341. doi:10.1002/mnfr.202000341.
- Possemiers S, Rabot S, Espín JC, Bruneau A, Philippe C, González-Sarrías A, Heyerick A, Tomás-Barberán FA, De Keukeleire D, Verstraete W. et al. Eubacterium limosum activates isoxanthohumol from hops (Humulus lupulus L.) into the potent phytoestrogen 8-prenylnaringenin in vitro and in rat intestine. J Nutr. 2008 Jul 1;138(7):1310–1316. doi:10.1093/jn/138.7.1310.
- Milligan SR, Kalita JC, Heyerick A, Rong H, De Cooman L, De Keukeleire D. Identification of a Potent Phytoestrogen in Hops (Humulus lupulus L.) and Beer. J Clin Endocr Metab. 1999 Jun 1;84(6):2249. doi:10.1210/jcem.84.6.5887.
- Milligan SR, Kalita JC, Pocock V, Van De Kauter V, Stevens JF, Deinzer ML, Rong H, De Keukeleire D. The Endocrine Activities of 8-Prenylnaringenin and Related Hop (Humulus lupulus L.) Flavonoids. J Clin Endocr Metab. 2000 Dec 1;85(12):4912–4915. doi:10.1210/jcem.85.12.7168.
- Bradley R, Langley BO, Ryan JJ, Phipps J, Hanes DA, Stack E, Jansson JK, Metz TO, Stevens JF. Xanthohumol microbiome and signature in healthy adults (the XMaS trial): a phase I triple-masked, placebo-controlled clinical trial. Trials. 2020 Oct 7;21(1):835. doi:10.1186/s13063-020-04769-2.
- Langley BO, Ryan JJ, Hanes D, Phipps J, Stack E, Metz TO, Stevens JF, Bradley R. Xanthohumol microbiome and signature in healthy adults (the XMaS trial): safety and tolerability results of a phase I triple-masked, placebo-controlled clinical trial. Mol Nutr Food Res. 2021;65(8):2001170. doi:10.1002/mnfr.202001170.
- Stompor M, Żarowska B. Antimicrobial activity of Xanthohumol and its selected structural analogues. Molecules. 2016 May;21(5):608. doi:10.3390/molecules21050608.
- Rozalski M, Micota B, Sadowska B, Stochmal A, Jedrejek D, Wieckowska-Szakiel M, Rozalska B. Antiadherent and Antibiofilm Activity of Humulus lupulus L. Derived Products: New Pharmacological Properties. Biomed Res Int. 2013 Sep 23;2013:1–7. doi:10.1155/2013/101089.
- Gerhäuser C. Broad spectrum antiinfective potential of xanthohumol from hop (humulus lupulus L.) in comparison with activities of other hop constituents and xanthohumol metabolites. Mol Nutr Food Res. 2005;49(9):827–831. doi:10.1002/mnfr.200500091.
- Arumugam M, Raes J, Pelletier E, Le Paslier D, Yamada T, Mende DR, Fernandes GR, Tap J, Bruls T, Batto J-M. et al. Enterotypes of the human gut microbiome. Nature. 2011 May;473(7346):174–180. doi:10.1038/nature09944.
- Costea PI, Hildebrand F, Arumugam M, Bäckhed F, Blaser MJ, Bushman FD, de Vos WM, Ehrlich S, Fraser CM, Hattori M. et al. Enterotypes in the landscape of gut microbial community composition. Nat Microbiol. 2018 Jan;3(1):8–16. doi:10.1038/s41564-017-0072-8.
- Wu GD, Chen J, Hoffmann C, Bittinger K, Chen YY, Keilbaugh SA, Bewtra M, Knights D, Walters WA, Knight R. et al. Linking long-term dietary patterns with gut microbial enterotypes. Science. 2011;334(6052):105–108. doi:10.1126/science.1208344.
- Zhang H, DiBaise JK, Zuccolo A, Kudrna D, Braidotti M, Yu Y, Parameswaran P, Crowell MD, Wing R, Rittmann BE. et al. Human gut microbiota in obesity and after gastric bypass. Proc Natl Acad Sci USA. 2009;106(7):2365–2370. doi:10.1073/pnas.0812600106.
- Song EJ, Han K, Lim TJ, Lim S, Chung MJ, Nam MH, Kim H, Nam Y-D. Effect of probiotics on obesity-related markers per enterotype: a double-blind, placebo-controlled, randomized clinical trial. EPMA J. 2020 Mar 1;11(1):31–51. doi:10.1007/s13167-020-00198-y.
- Hur HJ, Wu X, Yang HJ, Kim MJ, Lee KH, Hong M, Park S, Kim M-S. Beneficial effects of a low-glycemic diet on serum metabolites and gut microbiota in obese women with prevotella and Bacteriodes Enterotypes: a randomized clinical trial. Front Nutr. 2022;9. doi:10.3389/fnut.2022.861880.
- Miller TL, Wolin MJ. Pathways of acetate, propionate, and butyrate formation by the human fecal microbial flora. Appl Environ Microb. 1996 May;62(5):1589–1592. doi:10.1128/aem.62.5.1589-1592.1996.
- Clavel T, Henderson G, Engst W, Doré J, Blaut M. Phylogeny of human intestinal bacteria that activate the dietary lignan secoisolariciresinol diglucoside. FEMS Microbiol Ecol. 2006 Mar 1;55(3):471–478. doi:10.1111/j.1574-6941.2005.00057.x.
- Clavel T, Henderson G, Alpert CA, Philippe C, Rigottier-Gois L, Doré J, Blaut M. Intestinal bacterial communities that produce active estrogen-like compounds enterodiol and enterolactone in humans. Appl Environ Microb. 2005 Oct;71(10):6077–6085. doi:10.1128/AEM.71.10.6077-6085.2005.
- Kim M, Kim N, Han J. Metabolism of Kaempferia parviflora polymethoxyflavones by human intestinal bacterium Bautia sp. MRG-PMF1. J Agric Food Chem. 2014 Dec 24;62(51):12377–12383. doi:10.1021/jf504074n.
- Burapan S, Kim M, Han J. Demethylation of polymethoxyflavones by human gut bacterium, Blautia sp. MRG-PMF1. J Agric Food Chem. 2017 Mar 1;65(8):1620–1629. doi:10.1021/acs.jafc.7b00408.
- Goodrich JK, Waters JL, Poole AC, Sutter JL, Koren O, Blekhman R, Beaumont M, Van Treuren W, Knight R, Bell J. et al. Human genetics shape the gut microbiome. Cell. 2014 Nov 6;159(4):789–799. doi:10.1016/j.cell.2014.09.053.
- Waters JL, Ley RE. The human gut bacteria christensenellaceae are widespread, heritable, and associated with health. BMC Biol. 2019 Oct 28;17(1):83. doi:10.1186/s12915-019-0699-4.
- Beaumont M, Goodrich JK, Jackson MA, Yet I, Davenport ER, Vieira-Silva S, Debelius J, Pallister T, Mangino M, Raes J. et al. Heritable components of the human fecal microbiome are associated with visceral fat. Genome Biol. 2016 Sep 26;17(1):189. doi:10.1186/s13059-016-1052-7.
- Fu J, Bonder MJ, Cenit MC, Tigchelaar EF, Maatman A, Dekens JAM, Brandsma E, Marczynska J, Imhann F, Weersma RK. et al. The gut microbiome contributes to a substantial proportion of the variation in blood lipids. Circ Res. 2015 Oct 9;117(9):817–824. doi:10.1161/CIRCRESAHA.115.306807.
- Alemán JO, Bokulich NA, Swann JR, Walker JM, De Rosa JC, Battaglia T, Costabile A, Pechlivanis A, Liang Y, Breslow JL. et al. Fecal microbiota and bile acid interactions with systemic and adipose tissue metabolism in diet-induced weight loss of obese postmenopausal women. J Transl Med. 2018 Sep 3;16(1):244. doi:10.1186/s12967-018-1619-z.
- Lim MY, You HJ, Yoon HS, Kwon B, Lee JY, Lee S, Song Y-M, Lee K, Sung J, Ko G. et al. The effect of heritability and host genetics on the gut microbiota and metabolic syndrome. Gut. 2017 Jun 1;66(6):1031–1038. doi:10.1136/gutjnl-2015-311326.
- He Y, Wu W, Wu S, Zheng HM, Li P, Sheng HF, Chen M-X, Chen Z-H, Ji G-Y, Zheng ZDX. et al. Linking gut microbiota, metabolic syndrome and economic status based on a population-level analysis. Microbiome. 2018 Sep 24;6(1):172. doi:10.1186/s40168-018-0557-6.
- Gevers D, Kugathasan S, Denson LA, Vázquez-Baeza Y, Van Treuren W, Ren B, Schwager E, Knights D, Song S, Yassour M. et al. The treatment-naive microbiome in New-Onset Crohn’s disease. Cell Host Microbe. 2014 Mar 12;15(3):382–392. doi:10.1016/j.chom.2014.02.005.
- Imhann F, Vich Vila A, Bonder MJ, Fu J, Gevers D, Visschedijk MC, Spekhorst LM, Alberts R, Franke L, van Dullemen HM. et al. Interplay of host genetics and gut microbiota underlying the onset and clinical presentation of inflammatory bowel disease. Gut. 2018 Jan;67(1):108–119. doi:10.1136/gutjnl-2016-312135.
- Pascal V, Pozuelo M, Borruel N, Casellas F, Campos D, Santiago A. et al. A microbial signature for Crohn’s disease. Gut. 2017 May;66(5):813–822. doi:10.1136/gutjnl-2016-313235.
- Sun L, Xie C, Wang G, Wu Y, Wu Q, Wang X, Liu J, Deng Y, Xia J, Chen B. et al. Gut microbiota and intestinal FXR mediate the clinical benefits of metformin. Nat Med. 2018 Dec;24(12):1919–1929. doi:10.1038/s41591-018-0222-4.
- Sun L, Cai J, Gonzalez FJ. The role of farnesoid X receptor in metabolic diseases, and gastrointestinal and liver cancer. Nat Rev Gastroenterol Hepatol. 2021 May;18(5):335–347. doi:10.1038/s41575-020-00404-2.
- Rath S, Rud T, Karch A, Pieper DH, Vital M. Pathogenic functions of host microbiota. Microbiome. 2018 Sep 28;6(1):174. doi:10.1186/s40168-018-0542-0.
- Kim KH, Park D, Jia B, Baek JH, Hahn Y, Jeon CO, Chu H. Identification and characterization of Major bile acid 7α-dehydroxylating bacteria in the human gut. mSystems. mSystems. 2022 Jun 23;7(4):e00455–22. doi:10.1128/msystems.00455-22.
- Vital M, Rud T, Rath S, Pieper DH, Schlüter D. Diversity of bacteria exhibiting bile acid-inducible 7α-dehydroxylation genes in the human gut. Comput Struct Biotechnol J. 2019 Jan 1;17:1016–1019. doi:10.1016/j.csbj.2019.07.012.
- Tap J, Lejzerowicz F, Cotillard A, Pichaud M, McDonald D, Song SJ, Knight R, Veiga P, Derrien M. Global branches and local states of the human gut microbiome define associations with environmental and intrinsic factors. Nat Commun. 2023 Jun 20;14(1):3310. doi:10.1038/s41467-023-38558-7.
- Boekhorst J, Venlet N, Procházková N, Hansen ML, Lieberoth CB, Bahl MI, Lauritzen L, Pedersen O, Licht TR, Kleerebezem M. et al. Stool energy density is positively correlated to intestinal transit time and related to microbial enterotypes. Microbiome. 2022 Dec 12;10(1):223. doi:10.1186/s40168-022-01418-5.
- Ryan JJ, Hanes DA, Bradley RD, Contractor N. Effect of a nutrition support formula in adults with inflammatory bowel disease: a pilot study. Glob Adv Health Med. 2019 Jan 1;8:2164956119867251. doi:10.1177/2164956119867251.
- Caporaso JG, Lauber CL, Walters WA, Berg-Lyons D, Huntley J, Fierer N, Owens SM, Betley J, Fraser L, Bauer M. et al. Ultra-high-throughput microbial community analysis on the Illumina HiSeq and MiSeq platforms. ISME J. 2012 Aug;6(8):1621–1624. doi:10.1038/ismej.2012.8.
- Illumina 16S Sample Preparation Guide [Internet]. [accessed 2023 Jun 30]. https://support.illumina.com/documents/documentation/chemistry_documentation/16s/16s-metagenomic-library-prep-guide-15044223-b.pdf
- Callahan BJ, McMurdie PJ, Rosen MJ, Han AW, Johnson AJA, Holmes SP. DADA2: High-resolution sample inference from Illumina amplicon data. Nat Methods. 2016 Jul;13(7):581–583. doi:10.1038/nmeth.3869.
- Quast C, Pruesse E, Yilmaz P, Gerken J, Schweer T, Yarza P, Peplies J, Glöckner FO. The SILVA ribosomal RNA gene database project: improved data processing and web-based tools. Nucleic Acids Res. 2013 Jan 1;41(D1):D590–6. doi:10.1093/nar/gks1219.
- McMurdie PJ, Holmes S, Watson M. Phyloseq: an R package for reproducible interactive analysis and graphics of microbiome census data. PloS One. 2013 Apr 22;8(4):e61217. doi:10.1371/journal.pone.0061217.
- Wickham H. ggplo 2. WIREs Computational Stats. 2011;3(2):180–185. doi:10.1002/wics.147.
- Oksanen J, Kindt R, Legendre P, O’Hara B, Stevens MHH, Oksanen MJ, Suggests, MA. The vegan package. Commun Eco Package. 2007;10(631–637):719.
- Brooks ME, Kristensen K, van Benthem KJ, Magnusson A, Berg CW, Nielsen A, Skaug, HJ, Maechler M, Bolker, BM. Modeling zero-inflated count data with glmmTMB. bioRxiv. 2017;132753.
- Magnusson A, Skaug H, Nielsen A, Berg C, Kristensen K, Maechler M, van Bentham K, Bolker B, Brooks M, Brooks, MM. glmmTMB: generalized linear mixed models using template model builder. R Package Version 0 1 3. 2017;25.
- Hothorn T, Bretz F, Westfall P. Simultaneous inference in general parametric models. Biom J: J Maths Methods In Bioscie. 2008;50(3):346–363. doi:10.1002/bimj.200810425.
- Maechler M, Rousseeuw P, Struyf A, Hubert M, Hornik K, Studer M, Roudier P, Gonzalez J. Package ‘cluster. Dosegljivo na. 2013.
- Rohart F, Gautier B, Singh A, Cao KAL, Schneidman D. mixOmics: An R package for ‘omics feature selection and multiple data integration. PLoS Comput Biol. 2017 Nov 3;13(11):e1005752. doi:10.1371/journal.pcbi.1005752.
- Gloor GB, Macklaim JM, Pawlowsky-Glahn V, Egozcue JJ. Microbiome datasets are compositional: and this is not optional. Front Microbiol [Internet]. 2017;8: 2224. doi:10.3389/fmicb.2017.02224.
- Cao KAL, Rossouw D, Robert-Granié C, Besse P . A sparse PLS for variable selection when integrating omics data. Stat Appl Genet Mol Biol. 2008;7(1). doi:10.2202/1544-6115.1390.
- Han J, Lin K, Sequeira C, Borchers CH. An isotope-labeled chemical derivatization method for the quantitation of short-chain fatty acids in human feces by liquid chromatography–tandem mass spectrometry. Anal Chim Acta. 2015 Jan 7;854:86–94. doi:10.1016/j.aca.2014.11.015.
- Kuznetsova A, Brockhoff PB, Christensen RHB. Package ‘lmertest’. R Package Version. 2015;2(0):734.