
ABSTRACT
Patients with inflammatory bowel disease (IBD), including ulcerative colitis (UC), show an increased incidence of anxiety and depression; however, the association between UC-associated psychiatric disorders and the gut microbiota is unclear. This study aimed to examine whether gut microbiota from patients with UC can alter colonic gene expression, leading to anxiety- and depression-like behavior in mice receiving fecal microbiota transplantation (FMT). RNA sequencing transcriptome analyses revealed a difference in colonic gene expression between mice receiving FMT from patients with UC (UC-FMT mice) and those receiving FMT from healthy controls (HC-FMT mice). Gene ontology analysis revealed the downregulation of neuropeptide signaling pathways, including neuropeptide Y (NPY) expression, in the colons of UC-FMT mice. The protein levels of NPY also decreased in the colon and plasma of UC-FMT mice compared to those in HC-FMT mice. The oral administration of Enterococcus mundtii (EM), a bacterium isolated from the feces of patients with UC, reduced NPY expression in the colons of mice and induced intestinal inflammation, anxiety, and depression-like behavior. Reduced NPY protein levels were also observed in the plasma and hippocampus of EM-treated mice. Intraperitoneal administration of NPY significantly alleviated anxiety- and depressive-like behaviors induced by EM in mice. Capsular polysaccharide in EM was associated with EM-induced NPY downregulation in the colon. Analysis of Gene Expression Omnibus datasets showed markedly reduced NPY expression in the inflamed colons of patients with UC compared with that in the colons of healthy controls. In summary, EM-induced reduction in the colonic expression of NPY may be associated with a decrease in hippocampal NPY and anxiety- and depression-like behavior in mice.
Introduction
Ulcerative colitis (UC) is an inflammatory bowel disease (IBD) characterized by mucosal inflammation of the colon or rectum.Citation1 IBD, including UC, is associated with various comorbidities.Citation2 Emerging studies have suggested a link between major depressive disorder, also known as depression and anxiety, and IBD.Citation3–5 The global incidence of depression in patients with IBD is reportedly 15–30%, compared to 9.8–15.8% in the general population.Citation6 Nahon et al. showed that of 1662 patients with IBD, 181 (11%) had depression and 689 (41%) had anxiety.Citation7 Both these disorders are associated with several pathways, including the activated immune-inflammatory, oxidative, and nitrosative stress pathways,Citation8 suggesting the involvement of these pathways in the pathogenesis of IBD-induced depression. However, the mechanisms underlying IBD-induced depression remain largely unknown. Recently, we demonstrated that mice orally administered feces from patients with IBD or mice with colitis exhibit anxiety- and depression-like behavior as well as intestinal inflammation.Citation9,Citation10 Other studies have shown that fecal microbiota transplantation (FMT) alleviates anxiety and depression in patients with IBD.Citation11,Citation12 These findings suggest that gut microbiota may play a key role in IBD-related depression and anxiety.
The gut microbiome is implicated in numerous physiological and pathological processes. Dysbiosis of the gut microbiome is associated with various types of gastrointestinal diseases, such as IBD, inflammatory bowel syndrome, celiac disease, and colon cancer.Citation13–19 In addition to gastrointestinal diseases, emerging literature suggests a potential role of the gut microbiome in neuropsychiatric disorders, including Parkinson’s disease, Alzheimer’s disease, autism, schizophrenia, and depression.Citation20–23 Recently, the critical role of the gut microbiome in the gut-brain axis, a bidirectional communication between the central nervous, enteric nervous, and endocrine systems linking brain functions with peripheral intestinal functions,Citation24,Citation25 has been emphasized.Citation26–28 However, the mechanisms involving the gut-brain axis in neuropsychiatric disorders remain unclear.
Neuropeptides are a type of neuronal signaling molecules for communication between neurons and play a role in many neuropsychiatric disorders, including depression and anxiety.Citation29–32 In addition, several neuropeptides are produced by the gastrointestinal tract, including endocrine cells, in addition to the central and peripheral neurons,Citation33 and serve as a link between the gut and brain. For example, some neuropeptides such as glucagon-like peptide-1, cholecystokinin, and peptide YY, which are also known as gut hormones, regulate appetite by acting on the central nervous system.Citation34 Interestingly, recent studies proposes that changes in the gut microbiome composition, frequently observed in individuals with UC, may contribute to dysregulation in neuropeptide signaling pathways, impacting mood disorders such as depression and anxiety.Citation35–38 However, direct experimental evidence on the relationship between gut dysbiosis and neuropeptides in UC patients and their implications on psychiatric symptoms is currently lacking.
This study aims to explore the impact of gut microbiota from UC patients on colonic gene expression in mice, with a specific focus on neuropeptide, particularly NPY. Additionally, we investigate the role of Enterococcus mundtii (EM), a bacterium isolated from the feces of patients with UC, in inducing changes in NPY expression and anxiety/depression-like behavior in mice. This research seeks to establish a potential link between gut microbiota, NPY downregulation, and the manifestation of psychiatric symptoms.
Results
FMT from patients with UC modulates colonic gene expression in the transplanted mice
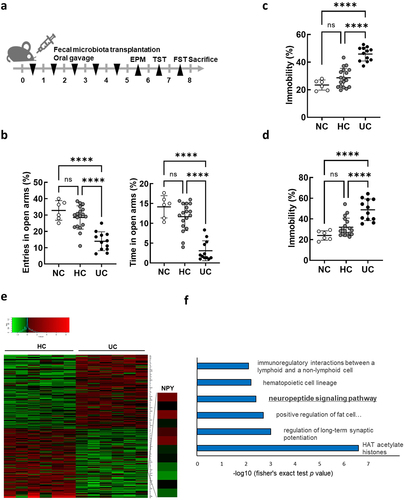
A previous study revealed that mice orally administered feces from patients with IBD and Crohn’s disease (CD) or UC show anxiety- and depression-like behavior, as well as intestinal inflammation.Citation10 Based on these findings, suggesting a potential role of the gut microbiota in UC-associated anxiety/depression, we hypothesized that the gut microbiome of patients with UC may induce changes in intestinal gene expression which may directly or indirectly play a role in regulating anxiety/depression. We first confirmed that oral FMT from patients with UC into mice () caused intestinal inflammation (Supplmentary Figure S1) and anxiety/depressive behaviors using the elevated plus maze (EPM) test, tail suspension task (TST), and forced swim task (FST) (). We hypothesized that the gut microbiota in patients with UC induced changes in the expression of intestinal genes associated with anxiety/depression in transplanted mice. Thus, we performed global transcript profiling of colon tissues of mice receiving FMT from patients with UC (UC-FMT mice) and healthy controls (HC-FMT mice) using 3′ mRNA sequencing to identify differentially expressed genes (DEGs) (). Our analysis (with fold change ≥ 1.5 and p-value <0.05) identified a total of 258 DEGs in the colons of UC-FMT mice compared to those in HC-FMT mice, suggesting that the intestinal gene expression pattern was altered by the gut microbiome from the feces of patients with UC. Gene ontology (GO) enrichment analysis revealed that several ontology groups were significantly altered in the colons of UC-FMT mice (). Interestingly, the Neuropeptide Signaling Pathway in the ontology group was identified by analyzing 125 downregulated genes, including Ltb4r1, Oprl1, and Npy.
Figure 1. Differentially expressed gene analysis in the colon of mice subjected to fecal microbiota transplantation (FMT) by receiving feces from healthy control (HC) and ulcerative colitis patients (UC). (a) Schematic diagram of the animal study. Each HC-FMT (n = 18) and UC-FMT (n = 12) mouse was orally transplanted once a day for 5 days. NC, normal control (n = 6), was orally administered with sterile saline instead of feces. (b-d) effects of FMT on the anxiety/depression-like behaviors in elevated plus maze task (EPM) (b), tail suspension task (TST) (c), and forced swim task (FST) (d). (e and f) RNA-seq analysis on mRNA isolated from the colon of mice subjected to FMT (HC-FMT; n = 6 and UC-FMT; n = 6). (e) Heatmap showing the results of supervised clustering between HC-FMT and UC-FMT group (fold change ≥ 1.5 and p-value <0.05; 258 genes). (f) Gene ontology enrichment analysis of 125 down-regulated genes among 258 DEGs. Statistical significance was calculated using a two-way ANOVA with post-hoc Tukey’s multiple comparisons tests (*p < 0.05; **p < 0.01; ***p < 0.001; ****p < 0.0001).
Colonic expression and plasma levels of NPY are reduced in mice subjected to FMT by receiving feces from patients with UC
NPY, a 36-amino acid neuropeptide, acts as a neurotransmitter in the brain, exerting anxiety/depressant effects in vivo.Citation39,Citation40 In addition to NPY, other NPY family genes (PPY and PYY) and their receptors (NPY1R, NPY2R, PPYR1, and NPY5R) were selected for validation using real-time quantitative reverse transcription-polymerase chain reaction (qRT-PCR). Among the tested genes, only NPY expression was significantly decreased in the colons of UC-FMT mice compared to that in HC-FMT mice (). These results were consistent with those of our RNA-seq analysis. Additionally, western blot analysis revealed a decrease in NPY protein expression in the colons of UC-FMT mice (), similar to its mRNA expression. Moreover, plasma NPY levels were significantly reduced in UC-FMT mice (). To assess the variance in basal NPY and NPY1R expression levels in colon and brain tissues, we measured their relative mRNA and protein levels in both types of tissues from mice that were not exposed to FMT (). We found that the endogenous NPY expression were considerably higher in the colon tissue than in brain tissue, whereas NPY1R expression was abundant in the brain. Considering that peripheral NPY can readily enter the brain from the blood by diffusion across the blood-brain barrier (BBB),Citation41 these data suggest that plasma NPY levels are associated with colonic NPY expression and can eventually affect its levels in the brain.
Figure 2. NPY expression in the colon and plasma of mice subjected to FMT by receiving feces from healthy control and UC patients. (a) mRNA expression of NPY family genes (NPY, PPY, and PYY) and their receptors (NPY1R, NPY2R, PPYR1, and NPY5R) in the colon of mice subjected to FMT by receiving feces from healthy control (HC-FMT; n = 6) and UC patients (UC-FMT; n = 6). (b) Representative bands and graphs showing western blot analysis of NPY protein in the colon of HC-FMT and UC-FMT mice. (c) Plasma levels of NPY in NC, HC-FMT, and UC-FMT mice measured by an enzyme-linked immunoassay kit. (d and e) colon and brain tissues were collected from control mice that were not subjected to FMT challenge. The mRNA (d) and protein (e) expression levels of NPY and its receptor NPY1R were evaluated in the colon and brain of the mice. Statistical significance between two groups was calculated using two-tailed unpaired t-test (*p < 0.05).
Fecal enterococcus is positively associated with anxiety and depression in patients with UC
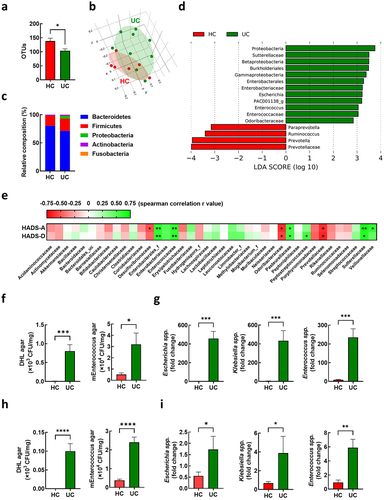
In our previous study, we analyzed the gut microbiota composition in the feces of 15 patients with IBD, including those with UC and CD.Citation10 In this study, we compared the gut microbiota composition in the feces of patients with UC (n = 9) and healthy volunteers (n = 6) (Supplementary Table S2). We observed lower gut microbiota diversity and shifted composition in patients with UC compared to those in the healthy controls (). Linear discriminant analysis identified 60 differential bacterial taxa between the UC and HC groups (). Patients with UC showed an increased abundance of Proteobacteria phylum Betaproteobacteria class, Gammaproteobacteria class, Burkholderiales order, and Enterobacterales order. Relative abundances of Sutterellaceae, Enterobacteriaceae, Enterococcaceae, and Odoribacteraceae families were observed in patients with UC. At the genus level, the abundance of Escherichia, PAC001138_g, and Enterococcus increased. To investigate the potential role of the gut microflora in anxiety and depression phenotypes, we analyzed the association between the Hospital Anxiety and Depression Scale (HADS) score and alterations in the gut microbiota at the family level (). Notably, Enterobacterales_f and Enterococcaceae positively correlated with anxiety (HADS-A) and depression (HADS-D). To identify the potential bacteria associated with UC pathogenesis, we isolated fecal bacteria belonging to Enterobacteriaceae and Enterococcaceae using agar plates. The number of CFUs in deoxycholate hydrogen sulfide lactose (DHL) agar and m-Enterococcus selective agar plates was higher in the feces of patients with UC (UC-F) than that in healthy controls (HC-F) (). We isolated Escherichia coli (EC) and Klebsiella oxytoca (KO) using DHL agar and Enterococcus mundtii (EM) using m-Enterococcus selective agar plates. The qRT-PCR analysis showed a relatively higher abundance of Escherichia spp., Klebsiella spp., and Enterococcus spp. In UC-F than those in HC-F (). We further confirmed increased levels of Escherichia spp., Klebsiella spp., and Enterococcus spp. In UC-F (), which were used for the FMT experiment, followed by the RNA sequencing of colonic tissues (). The feces of UC-FMT mice, similar to the feces of UC patients, showed an increased population of Escherichia spp., Klebsiella spp., and Enterococcus spp. Compared to that of HF-FMT mice (Supplmentary Figure S2). Our findings suggest that these gut bacteria are associated with high NPY levels in the colons of UC-FMT mice.
Figure 3. Association of enterococcus in the feces with anxiety and depression in UC patients. (a-g) gut microbiota composition of UC patients was analyzed using the datasets (HC; n = 6 and UC; n = 9) from our previous study.Citation10 OTU richness (a), principal coordinate analysis (PCoA) plot based on Jensen-Shannon analysis (b), phylum level (c), and linear discriminant analysis (LDA) (d) between HC and UC. (e) Spearman correlation analysis between HADS-A/D and gut microbiota composition family levels. (f and g) fecal bacteria relative abundance between the UC patients (n = 9) and healthy control (n = 6). (f) Number of colony forming unit (CFU) in DHL agar and mEnterococcus agar plates. (g) Fecal escherichia spp., Klebsiella spp., and Enterococcus spp. Populations. (h and i) fecal bacteria relative abundance between UC-F (n = 2) and HC-F (n = 6) used for FMT in figure 1. (h) Number of CFU in DHL agar and mEnterococcus selective agar plates. (i). Fecal escherichia spp., Klebsiella spp., and enterococcus spp. populations measured by qPCR. Statistical significance between two groups was calculated using two-tailed unpaired t-test (*p < 0.05; **p < 0.01; *** p < 0.001; **** p < 0.0001).
Oral administration of EM decreases colonic expression and plasma and hippocampal levels of NPY, and intraperitoneal administration of NPY alleviates EM-induced psychiatric symptoms
Previously, we demonstrated that the oral administration of gut bacteria EC, KO, and EM (NK1516) isolated from the feces of patients with IBD causes UC-like inflammation and depression-like behavior in mice.Citation42,Citation43 In this study, we specifically explored the relationship between gut bacteria and NPY expression and production in the colon. We first verified that EC, KO, and EM induced colitis- and anxiety/depression-like behavior ( and Supplementary Figure S3). The administration of EM, but not EC or KO, resulted in a significant decrease in NPY mRNA and protein expression in the colon (), as well as a decrease in plasma NPY levels (). Given the established association between diminished NPY levels in the brain and anxiety and depression,Citation40,Citation44 we scrutinized the impact of EM administration on NPY levels in the hippocampus, a brain region linked to depression. Western blotting analysis revealed a significant reduction in NPY protein levels in the hippocampus following EM administration (). Additionally, EM substantially diminished the population of NPY-positive cells in CA1, CA3, and dentate gyrus (DG) regions of the hippocampus (). Intriguingly, EM administration did not affect NPY mRNA levels in the hippocampus (Figure S4), suggesting that the reduced hippocampal NPY levels are not transcriptionally regulated in this region but possibly associated with decreased NPY levels originating from the colon through the bloodstream. Given reports indicating that intraperitoneal injection of NPY exerts anti-depressant-like effects in the rat hypothalamus,Citation45 we further explored the involvement of peripheral NPY in EM-induced psychiatric symptoms. Intraperitoneal administration of NPY significantly alleviated anxiety and depressive-like behaviors induced by EM in mice (). Collectively, these findings suggest that EM, a gut bacterium from UC patients, induce a reduction in colonic NPY expression, and the resultant diminished colonic NPY levels may be associated with a decrease in hippocampal NPY and the development of anxiety- and depression-like behavior in mice.
Figure 4. Effect of oral administration with Enterococcus mundtii (EM) on the levels of NPY in the colon, plasma, and hippocampus of mice. (a) Schematic diagram of the animal study. Bacteria isolated from UC patients (n = 8) was orally administrated once a day for 5 days. (b) mRNA expression of NPY in the colon of mice measured by RT-PCR. (c) Representative bands and graphs showing western blot analysis of NPY protein in the colon of mice (d) plasma levels of NPY in mice measured by an enzyme-linked immunoassay kit. (e) Representative bands and graphs showing western blot analysis of NPY protein in the hippocampus of mice (f) Representative images and graphs showing immunofluorescent analysis of NPY protein in the CA1,CA3, dentate gyrus (DG) region of the hippocampus of mice (n = 6). Scale bar = 500 μm/50 μm. Statistical significance between two groups was calculated using two-tailed unpaired t-test (*p < 0.05).
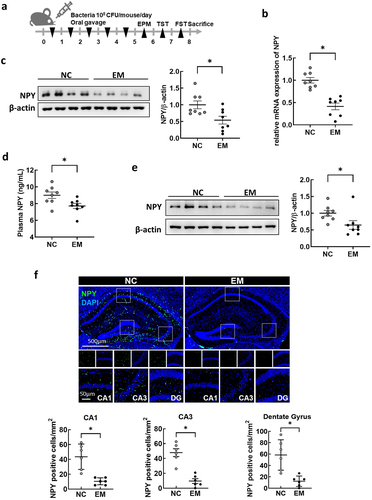
Figure 5. Effects of NPY intraperitoneal injection on the anxiety/depression-like behavior induced by E. mundtii. (a) Schematic diagram of the animal study. EM was orally administered (n = 4) once a day for 5 days, followed by NPY intraperitoneal injection once a day for 3 days. The anxiety/depression-like behaviors were evaluated using elevated plus maze task (EPM) (b), tail suspension task (TST) (c), and forced swim task (FST) (d). NPY 10 = 10 μg/kg; NPY 100 = 100 μg/kg. Statistical significance was calculated using a two-way ANOVA with post-hoc Tukey’s multiple comparisons tests (*p < 0.05; **p < 0.01; ***p < 0.001; ****p < 0.0001).
Capsular polysaccharide of EM is associated with EM-induced NPY downregulation in the colon
Previously, we found that capsular polysaccharides (CPs) of EM (NK1516) isolated from patients with IBD play a critical role in inducing anxiety- and depression-like behavior in mice.Citation43 To investigate whether the CP of EM (NK1516-CP) was associated with NPY levels in mice, we orally administered NK1516-CP and observed anxiety- and depression-like behavior, similar to those induced by EM ( and Supplementary Figure S5A and S5B). We also found that NK1516-CP significantly decreased NPY levels in the colon, plasma, and brain of mice (). Interestingly, the CP from EM ATCC882 (ATCC882-CP), which is isolated from cow milk and used as a commercial probiotic,Citation46 did not affect NPY levels (Supplementary Figure S5D and S5E). Furthermore, NPY protein levels in the hippocampus were considerably lower in NK1516-CP-treated mice than those in ATCC882-CP-treated mice (). To investigate the effect of NK1516-CP on NPY production in the intestine, which acts on the brain through the blood, we examined NPY expression in the enteric endocrine cell line, STC1, after treatment with NK1516-CP. As a result, NK1516-CP significantly inhibited the NPY mRNA and protein expression in enteric cells, whereas the cytosolic fraction of EM NK1516 did not show any such effect (). These data suggested that CP, a surface component of EM NK1516, may regulate NPY synthesis and secretion in enteric endocrine cells in the colon, resulting in altered NPY levels in the brain.
Figure 6. Effect of capsular polysaccharide (CP) of EM on the levels of NPY in mice and enteric endocrine cells. (a) Schematic diagram of the animal study. Capsular polysaccharide (CP) of EM (NK1516-CP or ATCC882-CP) (n = 6) or normal control (NC; sterile saline) (n = 6) was orally administrated once a day for 5 days. (b) Representative bands and graphs showing western blot analysis of NPY protein in the colon of mice orally administered with NK1516-CP. (c) Plasma levels of NPY in mice orally administered with NK1516-CP measured by an enzyme-linked immunoassay kit. (d) Representative bands and graphs showing western blot analysis of NPY protein in the hippocampus of mice orally administered with NK1516-CP (e) Representative bands and graphs showing western blot analysis of NPY protein in the hippocampus of mice orally administered with ATCC882-CP or NK1516-CP. (f and g) enteric endocrine cells STC1 were treated with cytosol or CP fraction of EM (NK1516) for 24 h. (f) mRNA expression of NPY in STC cells measured by qRT-PCR. (g) Representative bands and graphs showing western blot analysis of NPY protein in STC cells. Statistical significance between two groups was calculated using two-tailed unpaired t-test (*p < 0.05).
Enterococcus overpopulation and colonic NPY downregulation in patients with UC
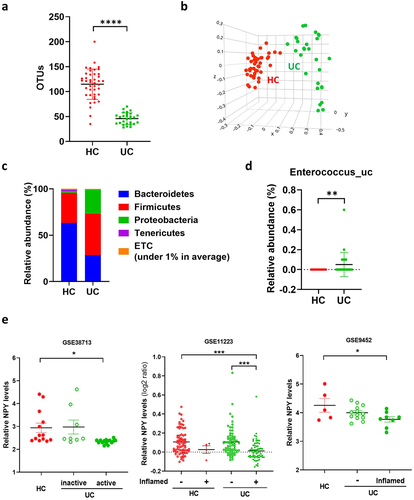
We further analyzed the gut microbiota composition of patients with UC and healthy controls using data generated in the Human Microbiome Project (NCBI Project ID 463,154).Citation47 Patients with UC showed a decrease in α-diversity and β-diversity of the gut microbial composition (), consistent with our previous results (). In addition, the relative abundances of Firmicutes and Proteobacteria were higher in the feces of patients with UC than in those of healthy controls (). At the species level, we confirmed that the abundance of Enterococcus_uc significantly increased in patients with UC (). Next, we examined whether NPY expression was downregulated in the colons of patients with UC. We used three Gene Expression Omnibus (GEO) datasets (GSE38713, GSE9452, and GSE11223) containing transcriptome data from colonic biopsy samples from patients with UC for NPY expression analysis (). In the GSE38713 dataset, NPY levels were significantly downregulated in the mucosa of patients with active (inflamed) UC compared to those in non-IBD controls. In GSE9452 and GSE11223, patients with inflamed UC showed a significant decrease in NPY expression compared to controls or patients with non-inflamed UC. These data suggest decreased NPY expression in the colons of patients with active and inflamed UC.
Figure 7. Enterococcus population and colonic NPY levels in UC patients. (a-d) gut microbiota composition of UC patients (N = 28) and healthy control (N = 42). Gut microbiota composition of UC patients was analyzed using datasets from the human microbiome project (http://portal.Hmpdacc.org). OTU richness (a), principal coordinate analysis (PCoA) plot based on Jensen-Shannon analysis (b), phylum level (c), and relative abundance of enterococcus_uc (unclassified) between UC and HC gut microbiota (d). Statistical significance between two groups was calculated using two-tailed unpaired t-test. (e) NPY expression in the colon of UC patients. NPY expression was evaluated using three GEO datasets (GSE38713, GSE9452, and GSE11223) in which colonic biopsy samples from healthy controls and UC patients were used. Statistical significance was calculated using a two-way ANOVA with post-hoc Tukey’s multiple comparisons tests. (*p < 0.05; **p < 0.01; ***p < 0.001; ****p < 0.0001).
Discussion
The gut microbiome affects the host health in various waysCitation48–51 and regulates intestinal gene expression intensively.Citation52,Citation53 In this study, we found that fecal transplants from patients with UC led to altered gene expression in the colon samples of mice; in particular, the neuropeptide NPY levels significantly decreased in the colons of mice administered feces from patients with UC compared to those in mice administered healthy control feces. NPY is of particular interest, since it is implicated in mood disorders, such as anxiety and depression.Citation44,Citation54 For example, NPY-knockout mice show anxiogenic-like effects of NPY, whereas NPY-overexpressing mice show anxiolytic behavior.Citation40,Citation55 In an FST model of depression, the intracerebroventricular administration of NPY shows antidepressant effects in rats.Citation39 Although the antidepressant action of NPY is expected to be mainly due to brain NPY, it is noteworthy that NPY is produced and secreted in large amounts by the brain and intestines.Citation35 We found that endogenous NPY levels were considerably higher in the gut than those in the brain of mice used in this study (). Furthermore, NPY was significantly decreased in the colon, plasma, and brain of mice receiving EM treatment. The reduced levels of NPY protein in the brain could either result from a decrease in gene expression in the brain or the transport of peripheral NPY across the BBB. We assumed that the reduced NPY protein levels in the hippocampus were largely associated with reduced plasma NPY levels caused by EM-induced NPY downregulation in the colon, since the hippocampal NPY mRNA expression is not affected by EM administration and NPY can easily enter the brain from blood by diffusion through the BBB.Citation41
The occurrence of UC alters the gut microbiota composition. These changes include an increase in the diversity of Proteobacteria and an increase in the abundance of Enterobacteria, Lactobacillus, Streptococci, and Enterococci in patients with UC and animal models.Citation56 Among these gut bacteria, the genera Escherichia/Shigella, Lactobacillus, and Enterococcus are positively correlated with depression.Citation57–59 In the feces of patients with IBD, Enterococcus faecium group correlated with HADS-D, and EM induced depression-like behavior.Citation10 Pathogenic Enterococcus species, such as EM, Enterococcus durans and Enterococcus gallinarum increase pro-inflammatory cytokine expression and decrease brain-derived neurotrophic factor (BDNF) protein levels in the hippocampus of mice with depression.Citation43 In this study involving patients with UC, we also found that EM, belonging to Enterococcaceae, reduced the levels of anti-depressive NPY in the colon, plasma, and hippocampus, causing anxiety and depression-like behavior. Thus, the pathogenicity of enterococci may be associated with a direct and/or indirect effect of EM on, both, the colon and brain, resulting in psychiatric disorders, such as anxiety and depression. Interestingly, NPY dysregulation is linked to the gut microbiome during communication between the brain and gut.Citation33 For example, probiotic bacteria such as Bifidobacterium and Lactobacillus increase NPY expression, whereas exposure to lipopolysaccharides from pathogenic bacteria such as EC, decreases NPY/NPY receptor expression in, both, the enteric nervous system and brain.Citation60–62 Our study showed that patient-derived EC and EM exhibit decreased NPY protein levels in the colon. Furthermore, EM showed decreased NPY mRNA levels in the colon and plasma, whereas EC did not. These results suggest that EM alters NPY expression, which is associated with depression.
Enterococcus species are commonly found in the human gut, and include both probiotic and pathogenic strains. Some Enterococcus species are probiotic, which promote gut health and boost the immune system.Citation63 Some Enterococcus strains are also pathogenic and can cause infections in humans.Citation64 The probiotic EM ATCC882 did not affect behavioral changes or NPY expression in the gut and hippocampus, whereas pathogenic EM NK1516 significantly reduced NPY expression in both the gut and hippocampus of depressive mice. The pathogenic factor of Enterococcus related to the difference between probiotic and pathogenic strains is the production of CPs.Citation65 Enterococcal CPs are virulence factors which enhance the colonization of the enteric surface and can stimulate epithelial cells, such as enteroendocrine cells, in the gut. Golińska et al. reported that an increase in the abundance of Enterococcus and their virulence genes contributes to inflammatory responses in patients with IBD.Citation66 Our study showed that EM NK1516 possesses a CP-related gene cluster, unlike EM ATCC882.Citation43 CPs isolated from NK1516 cause colitis, neuroinflammation, and depression-like behavior in mice. Additionally, serotonin and BDNF protein levels are reduced in the hippocampus of mice treated with NK1516-CP.Citation43 Our findings indicate that the CP from NK1516, but not ATCC882, decreased NPY protein levels in the colon and hippocampus of depressed mice and decreased the release of NPY in enteric endocrine cells. However, the mechanism by which the CP NK1516 affects NPY expression in enteric endocrine cells remains unclear. Bacterial quorum sensing and pattern recognition systems are probable mechanisms for the gut microbial regulation of host gene expression.Citation67–69 Further investigation is required to elucidate the detailed mechanisms involved.
Nevertheless, our study has several limitations that warrant further investigation. Firstly, it is plausible that EM and its metabolites could also influence brain NPY levels through alternative pathways, such as the vagus nerve. Secondly, although our analysis successfully identified low levels of NPY expression in the intestinal tissue of patients with UC using three GEO datasets, we were unable to establish a direct correlation between NPY expression and depression and anxiety in these UC patients due to the lack of information on depression and anxiety levels.
This exploration into the influence of gut microbiota on NPY expression in the colon holds significant implications for the treatment of UC patients, potentially uncovering novel therapeutic targets and strategies. The modulation of NPY and its receptors, coupled with the regulation of inflammatory responses in the colon and hippocampus, may pave the way for innovative therapeutic interventions. Microbiome-based therapies,Citation70 including probiotics, prebiotics, and fecal microbiota transplantation, have the potential to precisely adjust the expression and function of NPY. Such interventions may offer fresh insights into the pathophysiology and treatment of patients dealing with both UC and depression, ultimately enhancing outcomes and the quality of life for these individuals. Therefore, understanding the intricate interplay between gut microbiota and NPY holds great promise for improving the holistic care of UC patients.
In conclusion, our findings suggest that colonic NPY, which is regulated by EM gut bacteria, may play a critical role in UC-associated mood disorders. Our study elucidates a potential molecular link between UC and depression via the gut-brain axis.
Materials and methods
Patients
Healthy volunteers and patients with UC were recruited from Kyung Hee University (Seoul, Korea) (Supplmentary Table S1 and S2), as previously reported.Citation10 The study protocol and consent forms for the stool collection were approved by the Committee for the Care and Use of Clinical Study of the Medical School of Kyung Hee University (IRB File No., KHUH 2018-03-009-007 and KHUH 2018-12-004-003). All experiments were conducted in compliance with the principles of the Declaration of Helsinki and the Korean Good Clinical Practice guidelines.
Fecal microbiota transplantation
Fresh fecal samples were obtained from six healthy volunteers and two patients diagnosed with both ulcerative colitis (UC) and depression. The samples were then resuspended in sterile saline at a concentration of 10 times the weight/volume ratio. Fecal suspensions (100 µl) from a single healthy donor were orally administered to three mice (HC-FMT, total n = 18) daily for five consecutive days. Simultaneously, fecal suspensions (100 µl) from a patient with UC were inoculated into six mice (UC-FMT, total n = 12). The normal control group (NC, n = 6) received oral administration of sterile saline instead of feces. Behavioral experiments, including the EPM test, TST, and FST, were conducted on the sixth, seventh, and eighth days, respectively, following FMT. Euthanasia was performed on the mice eight days after the conclusion of the last behavioral test.
Microbiota composition analysis
Gut microbiota composition of healthy donor (n = 6) and UC patients (n = 9) was analyzed using the datasets from our previous study,Citation10 which are deposited in short read archive of NCBI under accession number PRJNA666980. Briefly, bacterial genomic DNAs were extracted from the fresh feces of healthy donors and UC patients using a QIAamp DNA stool mini kit (Qiagen, Hilden, Germany). Amplification of genomic DNA was performed using barcoded primers targeted the bacterial 16S rRNA V4 region gene and sequenced using Illumina iSeq 100 (San Diego, CA, USA).
Bacteria isolation and culture
To isolate bacteria from the feces of UC patients, fecal samples were plated on DHL agar and membrane filter Enterococcus (mEnterococcus) agar at 36°C for 24 h under anaerobic conditions. Morphological differences were evaluated and further identification of bacterial colonies was performed using 16S rRNA sequencing and API kit assay (bioMérieux, Craponne, France). Based on previous studies,Citation10,Citation43,Citation71 we selected bacteria strains potentially associated with anxiety and depression, EC, KO, and EM were obtained and cultured in tryptic soy (TS) broth at 36°C for 24 h. Colony forming units (CFU) of each bacterium were counted on TS agar.
Bacteria and capsular polysaccharides administration
After the bacteria were freshly cultured in TS medium, the pellets were collected, washed, and resuspended in sterile saline. The collected bacteria were orally administered every 24 h for 5 days with 200 μL bacterial suspension (1 × 10⁸ CFU/200 μL/mouse) or sterile saline as control. Bacterial cell wall CPs and cytosolic fractions of EM were isolated as previously described.Citation43,Citation72 The fractions were heated at 90°C for 15 min, freeze-dried, and stored at −80°C. The lyophilized CP fractions were resuspended in sterile saline and administered at a dose of 20 mg/kg/day by oral gavage for 5 days. To evaluate the effect of NPY administration on EM-induced anxiety/depression-like behaviors in the mice, EM was administered orally every 24 h for 5 days with 200 μL bacterial suspension (1 × 10Citation8 CFU/200 μL/mouse), then NPY (Phoenix Pharmaceuticals Inc., Burlingame, CA, USA) was suspended in sterile saline and treated at a dose of 10 μg/kg/day or 100 μg/kg/day by intraperitoneal injection for 3 days.
Cell culture
The intestinal neuroendocrine cell line STC1 (ATCC; Manassas, VA, USA) was cultured in Dulbecco’s modified eagle medium containing 10% fetal bovine serum, 100 U/mL penicillin, and 100 μg/mL streptomycin in an atmosphere of 95% air-5% CO2 at 37°C. To evaluate the effect of EM-CP on NPY expression in STC1 cells, the cells (5 × 10Citation4 were seeded in a 60 mm culture dish, grown overnight at 37°C, and then treated with the indicated concentrations of EM fractions (CP or cytosol) for 24 h.
RNA-sequencing analysis
Sequencing libraries were created using QuantSeq 3’ mRNA-Seq Library Prep Kit FWD (Illumina) according to the manufacturer’s recommendations and the created libraries were sequenced using Illumina NextSeq 500/550 at the E-Biogen Inc (Seoul, South Korea). Raw reads were mapped to the GRCm38/mm10 genome in the UCSC genome browser (https://genome.ucsc.edu/) after a quality check. RNA sequencing was performed on 15 randomly selected samples (n = 3 NC, n = 6 HC-FMT, and n = 6 UC-FMT). Supervised clustering was performed on the DEGs, and their expression patterns were displayed in the form of heat maps using R. GO enrichment analysis was performed with the DEGs using the Metascape database (https://metascape.org/).
Gene expression omnibus dataset analysis
The three transcriptome datasets were downloaded from the Gene Expression Omnibus (GEO) database (https://www.ncbi.nlm.nih.gov/geo/). GSE38713 included colonic mucosal biopsies from healthy controls (n = 13), patients with active UC (n = 15), and patients with inactive UC (n = 8). GSE9452 consisted of colon biopsies from healthy controls (n = 5) and patients with UC (13 uninflamed and eight inflamed). GSE11223 consisted of colon biopsies from healthy controls (69 uninflamed and four inflamed) and patients with UC (66 uninflamed and 63 inflamed).
qRT-PCR
RNA extraction and real-time RT-PCR (qRT-PCR) for mRNA expression were as previously described.Citation73 The primers used were as follows: for mouse NPY sense primer, 5′-GCC ACG ATG CTA GGT AAC AA-3′ and antisense primer, 5′-TTG ATG TAG TGT CGC AGA GC-3′; for mouse PPY (PP) sense primer, 5′-GCG ACT ATG CGA CAC CTG A-3′ and antisense primer, 5′-CCT CGG CTC TCT TCC CAT AC-3′; for mouse PYY sense primer, 5′-CGG CAG CGG TAT GGA AAA AG-3′ and antisense primer, 5′-TCG CTG TCG TCT GTG AAG AG-3′; for mouse NPY1R sense primer, 5′-GTC CAG TGA GAC CAA GCG AA-3′ and antisense primer, 5′-AGG TGG CAA TGA TCT GGT GG-3′; for mouse NPY2R sense primer, 5′-AGA TTG TGG CCT GTA CCG AG-3′ and antisense primer, 5′-AGG ACT GAC GTG GTT CCT CA-3′; for mouse PPYR1 sense primer, 5′-CTT CCA CCT GTG TCA ACC CT-3′ and antisense primer, 5′-ACC CAT CCT CAT CGA TCC CT-3′; for mouse NPY5R sense primer, 5′-AGA GTC AAG CGT TCC CTC AC-3′ and antisense primer, 5′-GCA TCC AGC TAA CAG CGA AC-3′. To detect fecal bacteria, the fresh feces of volunteers (0.2 g) were collected in a sterilized tube and genomic DNA was extracted using a QIAamp PowerFecal Pro DNA Kit (Qiagen). qPCR for gut bacteria was performed with 100 ng genomic DNA with SYBER premix in a Takara thermal cycler. The primers used were as follows: for Enterococcus spp. sense primer, 5’-AGA AAT TCC AAA CGA ACT TG-3’ and antisense primer, 5’-CAG TGC TCT ACC TCC ATC ATT-3’; for Klebsiella spp. sense primer, 5’-GCT AAT ACC GCA TAA CGT CG-3’ and antisense primer, 5’-TAA CCT CAC TCC CTT CCT CC-3’; for Escherichia spp. sense primer, 5’-GTA GCT AAT ACC GCA TAA CGT C-3’ and antisense primer, 5’-AAC TTT ACT CCC TTC CTC CC-3’. Gene expression levels were calculated relative to bacterial 16S rDNA.
Western blot
Protein was extracted from tissue samples isolated in mice by homogenizing with protein lysis buffer (Intron Biotechnology, Seoul, South Korea). Protein concentration was quantified by Bradford assay, and protein denaturation was performed at 95°C for 5 minutes after mixing the sample buffer. The protein was separated using SDS-PAGE, and the separated proteins were transferred to the polyvinylidene difluoride membrane. The membrane was blotted for 30 min with 5% skim milk in Tris-buffered saline (TBS, Boster Biological Technology Ltd., Wuhan, China). The blocked membrane was incubated overnight at 4°C with the primary antibody diluted 1:1000 in TBS-T. The membrane was incubated for 2 h at room temperature with the dilution of the appropriate horseradish peroxidase-linked secondary antibody. After that, enhanced chemiluminescence (ECL) kit (EMD Millipore, Billerica, MA, USA) was used for visualization of immunoreactive bands and detected by Image Quant Las-4000 (GE Healthcare Life Science, WI, USA). NPY and β-actin antibodies were purchased from Santa Cruz Biotechnology (Santa Cruz, CA, USA).
Immunofluorescence staining
The brain and colon sections were blocked with 10% donkey serum for 1 h at room temperature. The sections were incubated with anti-NPY antibodies (1:400) diluted in 0.3% Triton X-100 in PBS at 4°C overnight. Next day, the sections were washed and incubated with secondary antibody (1:1000) conjugated to fluorescent dye in 0.3% Triton X-100 in PBS for 1 h at room temperature. After washing, the sections were mounted with anti-fade mounting medium containing DAPI. The slides were imaged using a confocal microscope. NPY positive cells were counted and intensity were quantified by Image J.
Enzyme-linked immunosorbent assay
Plasma NPY levels were measured using a Human/Mouse/Rat Neuropeptide Y ELISA kit (RayBiotech, Peachtree Corners, GA, USA), according to the manufacturer’s instructions.
Human microbiota sequencing data analysis
Gut microbial data of patients with UC (n = 9) and healthy controls (n = 6) were reanalyzed using the NCBI short read archive (accession number: PRJNA666980). Human Microbiome Project data (http://portal.hmpdacc.org, access data: MAR 30, 2023) were used to compare patients with UC (Project ID:16S-GM-UC, n = 28) to healthy human participants (Project ID: HHS, n = 42). Fecal microbiota was analyzed using the EzBioCloud database and the 16S microbiome pipeline (https://www.ezbiocloud.net).
Statistical analyses
The data were assessed for normal distribution and expressed as mean ± standard error of mean. Comparisons between two groups were assessed using two-tailed, unpaired Student’s t-test. One-way analysis of variance with post hoc tests was used for comparing multiple groups. All statistical analyses were performed using GraphPad Prism 9 software (GraphPad Software, San Diego, CA, USA).
Supplementary Information _Jan18_2024 clean.docx
Download MS Word (314.4 KB)Disclosure statement
No potential conflict of interest was reported by the author(s).
Data availability statement
The sequencing data that support the findings of the study have been deposited in Dataon (https://dataon.kisti.re.kr) with identifier (doi: 10.22711/idr/974)
Supplementary material
Supplemental data for this article can be accessed online at https://doi.org/10.1080/19490976.2024.2319844
Additional information
Funding
References
- Feuerstein JD, Moss AC, Farraye FA. Ulcerative colitis. Mayo Clin Proc. 2019;94(7):1357–19. doi:10.1016/j.mayocp.2019.01.018.
- Roman AL. Comorbidity in inflammatory bowel disease. World J Gastroenterol. 2011;17(22):2723–2733. doi:10.3748/wjg.v17.i22.2723.
- Addolorato G, Capristo E, Stefanini GF, Gasbarrini G. Inflammatory bowel disease: a study of the association between anxiety and depression, physical morbidity, and nutritional status. Scand J Gastroenterol. 1997;32(10):1013–21. doi:10.3109/00365529709011218.
- Magni G, Bernasconi G, Mauro P, D’Odorico A, Sturniolo GC, Canton G, Martin A. Psychiatric diagnoses in ulcerative colitis. A controlled study. Br J Psychiatry. 1991;158(3):413–415. doi:10.1192/bjp.158.3.413.
- Robertson DA, Ray J, Diamond I, Edwards JG. Personality profile and affective state of patients with inflammatory bowel disease. Gut. 1989;30(5):623–6. doi:10.1136/gut.30.5.623.
- Panara AJ, Yarur AJ, Rieders B, Proksell S, Deshpande AR, Abreu MT, Sussman DA. The incidence and risk factors for developing depression after being diagnosed with inflammatory bowel disease: a cohort study. Aliment Pharmacol Ther. 2014;39(8):802–810. doi:10.1111/apt.12669.
- Nahon S, Lahmek P, Durance C, Olympie A, Lesgourgues B, Colombel JF, Gendre JP. Risk factors of anxiety and depression in inflammatory bowel disease. Inflamm Bowel Dis. 2012;18(11):2086–2091. doi:10.1002/ibd.22888.
- Martin-Subero M, Anderson G, Kanchanatawan B, Berk M, Maes M. Comorbidity between depression and inflammatory bowel disease explained by immune-inflammatory, oxidative, and nitrosative stress; tryptophan catabolite; and gut–brain pathways. CNS Spectr. 2016;21(2):184–198. doi:10.1017/S1092852915000449.
- Jang HM, Lee KE, Lee HJ, Kim DH. Immobilization stress-induced Escherichia coli causes anxiety by inducing NF-κB activation through gut microbiota disturbance. Sci Rep. 2018;8(1):13897. doi:10.1038/s41598-018-31764-0.
- Jang HM, Kim JK, Joo MK, Shin YJ, Lee CK, Kim HJ, Kim DH. Transplantation of fecal microbiota from patients with inflammatory bowel disease and depression alters immune response and behavior in recipient mice. Sci Rep. 2021;11(1):20406. doi:10.1038/s41598-021-00088-x.
- Kilincarslan S, Evrensel A. The effect of fecal microbiota transplantation on psychiatric symptoms among patients with inflammatory bowel disease: an experimental study. Actas Esp Psiquiatr. 2020;48:1–7.
- Kurokawa S, Kishimoto T, Mizuno S, Masaoka T, Naganuma M, Liang KC, Kitazawa M, Nakashima M, Shindo C, Suda W. et al. The effect of fecal microbiota transplantation on psychiatric symptoms among patients with irritable bowel syndrome, functional diarrhea and functional constipation: an open-label observational study. J Affect Disord. 2018;235:506–12. doi:10.1016/j.jad.2018.04.038.
- De Palma G, Collins SM, Bercik P. The microbiota-gut-brain axis in functional gastrointestinal disorders. Gut Microbes. 2014;5(3):419–29. doi:10.4161/gmic.29417.
- Carding S, Verbeke K, Vipond DT, Corfe BM, Owen LJ. Dysbiosis of the gut microbiota in disease. Microb Ecol Health Dis. 2015;26(8):26191. doi:10.3402/mehd.v26.26191.
- Baumgart DC, Carding SR. Inflammatory bowel disease: cause and immunobiology. Lancet. 2007;369(9573):1627–40. doi:10.1016/S0140-6736(07)60750-8.
- Carroll IM, Chang YH, Park J, Sartor RB, Ringel Y. Luminal and mucosal-associated intestinal microbiota in patients with diarrhea-predominant irritable bowel syndrome. Gut Pathog. 2010;2(1):19. doi:10.1186/1757-4749-2-19.
- Frank DN, St Amand AL, Feldman RA, Boedeker EC, Harpaz N, Pace NR. Molecular-phylogenetic characterization of microbial community imbalances in human inflammatory bowel diseases. Proc Natl Acad Sci U S A. 2007;104(34):13780–5. doi:10.1073/pnas.0706625104.
- De Palma G, Nadal I, Medina M, Donat E, Ribes-Koninckx C, Calabuig M, Sanz Y. Intestinal dysbiosis and reduced immunoglobulin-coated bacteria associated with coeliac disease in children. BMC Microbiol. 2010;10(1):63. doi:10.1186/1471-2180-10-63.
- Shen XJ, Rawls JF, Randall T, Burcal L, Mpande CN, Jenkins N, Jovov B, Abdo Z, Sandler RS, Keku TO. et al. Molecular characterization of mucosal adherent bacteria and associations with colorectal adenomas. Gut Microbes. 2010;1(3):138–47. doi:10.4161/gmic.1.3.12360.
- Foster JA, McVey Neufeld KA. Gut–brain axis: how the microbiome influences anxiety and depression. Trends Neurosci. 2013;36(5):305–312. doi:10.1016/j.tins.2013.01.005.
- Jiang C, Li G, Huang P, Liu Z, Zhao B. The gut microbiota and alzheimer’s disease. J Alzheimers Dis. 2017;58(1):1–15. doi:10.3233/JAD-161141.
- Qian Y, Yang X, Xu S, Wu C, Song Y, Qin N, Chen SD, Xiao Q. Alteration of the fecal microbiota in Chinese patients with Parkinson’s disease. Brain Behav Immun. 2018;70:194–202. doi:10.1016/j.bbi.2018.02.016.
- Cryan JF, Dinan TG. Mind-altering microorganisms: the impact of the gut microbiota on brain and behaviour. Nat Rev Neurosci. 2012;13(10):701–12. doi:10.1038/nrn3346.
- Carabotti M, Scirocco A, Maselli MA, Severi C. The gut-brain axis: interactions between enteric microbiota, central and enteric nervous systems. Ann Gastroenterol. 2015;28:203–209.
- Houser MC, Tansey MG. The gut-brain axis: is intestinal inflammation a silent driver of Parkinson’s disease pathogenesis? NPJ Parkinsons Dis. 2017;3(1):3. doi:10.1038/s41531-016-0002-0.
- Sharon G, Sampson TR, Geschwind DH, Mazmanian SK. The central nervous system and the gut microbiome. Cell. 2016;167(4):915–32. doi:10.1016/j.cell.2016.10.027.
- Mayer EA, Savidge T, Shulman RJ. Brain–gut microbiome interactions and functional bowel disorders. Gastroenterol. 2014;146(6):1500–1512. doi:10.1053/j.gastro.2014.02.037.
- Fung TC, Olson CA, Hsiao EY. Interactions between the microbiota, immune and nervous systems in health and disease. Nat Neurosci. 2017;20(2):145–55. doi:10.1038/nn.4476.
- Kormos V, Gaszner B. Role of neuropeptides in anxiety, stress, and depression: from animals to humans. Neuropeptides. 2013;47(6):401–19. doi:10.1016/j.npep.2013.10.014.
- Belzung C, Yalcin I, Griebel G, Surget A, Leman S. Neuropeptides in psychiatric diseases: an overview with a particular focus on depression and anxiety disorders. CNS Neurol Disord Drug Targets. 2006;5(2):135–145. doi:10.2174/187152706776359682.
- McGonigle P. Peptide therapeutics for CNS indications. Biochem Pharmacol. 2012;83(5):559–66. doi:10.1016/j.bcp.2011.10.014.
- Holzer P, Reichmann F, Farzi A. Neuropeptide Y, peptide YY and pancreatic polypeptide in the gut–brain axis. Neuropeptides. 2012;46(6):261–274. doi:10.1016/j.npep.2012.08.005.
- Holzer P, Farzi A. Neuropeptides and the microbiota-gut-brain axis. Adv Exp Med Biol. 2014;817:195–219.
- Druce MR, Small CJ, Bloom SR. Minireview: gut peptides regulating satiety. Endocrinol. 2004;145(6):2660–2665. doi:10.1210/en.2004-0089.
- Lach G, Schellekens H, Dinan TG, Cryan JF. Anxiety, depression, and the microbiome: a role for gut peptides. Neurotherapeut. 2018;15(1):36–59. doi:10.1007/s13311-017-0585-0.
- Wei P, Keller C, Li L. Neuropeptides in gut-brain axis and their influence on host immunity and stress. Comput Struct Biotechnol J. 2020;18:843–51. doi:10.1016/j.csbj.2020.02.018.
- Ge L, Liu S, Li S, Yang J, Hu G, Xu C, Song W. Psychological stress in inflammatory bowel disease: psychoneuroimmunological insights into bidirectional gut–brain communications. Front Immunol. 2022;13:1016578. doi:10.3389/fimmu.2022.1016578.
- Sonali S, Ray B, Ahmed Tousif H, Rathipriya AG, Sunanda T, Mahalakshmi AM, Rungratanawanich W, Essa MM, Qoronfleh MW, Chidambaram SB. et al. Mechanistic insights into the link between gut dysbiosis and major depression: an extensive review. Cells. 2022;11(8):11. doi:10.3390/cells11081362.
- Stogner KA, Holmes PV. Neuropeptide-Y exerts antidepressant-like effects in the forced swim test in rats. Eur J Pharmacol. 2000;387(2):R9–10. doi:10.1016/S0014-2999(99)00800-6.
- Bannon AW, Seda J, Carmouche M, Francis JM, Norman MH, Karbon B, McCaleb ML. Behavioral characterization of neuropeptide Y knockout mice. Brain Res. 2000;868(1):79–87. doi:10.1016/S0006-8993(00)02285-X.
- Kastin AJ, Akerstrom V. Nonsaturable entry of neuropeptide Y into brain. Am J Physiol. 1999;276(3):E479–82. doi:10.1152/ajpendo.1999.276.3.E479.
- Jang HM, Kim JK, Joo MK, Shin YJ, Lee KE, Lee CK, Kim HJ, Kim DH. Enterococcus faecium and pediococcus acidilactici deteriorate Enterobacteriaceae-induced depression and colitis in mice. Sci Rep. 2022;12(1):9389. doi:10.1038/s41598-022-13629-9.
- Joo MK, Ma X, Yoo JW, Shin YJ, Kim HJ, Kim DH. Patient-derived Enterococcus mundtii and its capsular polysaccharides cause depression through the downregulation of NF-κB-involved serotonin and BDNF expression. Microbes Infect. 2023;25(6):105116. doi:10.1016/j.micinf.2023.105116.
- Farzi A, Reichmann F, Holzer P. The homeostatic role of neuropeptide Y in immune function and its impact on mood and behaviour. Acta Physiol (Oxf). 2015;213(3):603–627. doi:10.1111/apha.12445.
- Gelfo F, Tirassa P, De Bartolo P, Croce N, Bernardini S, Caltagirone C, Petrosini L, Angelucci F. NPY intraperitoneal injections produce antidepressant-like effects and downregulate BDNF in the rat hypothalamus. CNS Neurosci Ther. 2012;18(6):487–492. doi:10.1111/j.1755-5949.2012.00314.x.
- Bonacina J, Suarez N, Hormigo R, Fadda S, Lechner M, Saavedra L. A genomic view of food-related and probiotic enterococcus strains. DNA Res. 2017;24:11–24. doi:10.1093/dnares/dsw043.
- Young V, Chang E, Meyer F, Sogin M, Schmidt T, Tiedje J. The role of the gut microbiota in ulcerative colitis. Nat Prec. 2010. doi:10.1038/npre.2010.5254.1.
- Shreiner AB, Kao JY, Young VB. The gut microbiome in health and in disease. Curr Opin Gastroenterol. 2015;31(1):69–75. doi:10.1097/MOG.0000000000000139.
- Kamada N, Seo SU, Chen GY, Nunez G. Role of the gut microbiota in immunity and inflammatory disease. Nat Rev Immunol. 2013;13(5):321–35. doi:10.1038/nri3430.
- Leclercq S, Matamoros S, Cani PD, Neyrinck AM, Jamar F, Starkel P, Windey K, Tremaroli V, Bäckhed F, Verbeke K. et al. Intestinal permeability, gut-bacterial dysbiosis, and behavioral markers of alcohol-dependence severity. Proc Natl Acad Sci U S A. 2014;111(42):E4485–93. doi:10.1073/pnas.1415174111.
- Alenghat T, Osborne LC, Saenz SA, Kobuley D, Ziegler CG, Mullican SE, Choi I, Grunberg S, Sinha R, Wynosky-Dolfi M. et al. Histone deacetylase 3 coordinates commensal-bacteria-dependent intestinal homeostasis. Nature. 2013;504(7478):153–7. doi:10.1038/nature12687.
- Dayama G, Priya S, Niccum DE, Khoruts A, Blekhman R. Interactions between the gut microbiome and host gene regulation in cystic fibrosis. Genome Med. 2020;12(1):12. doi:10.1186/s13073-020-0710-2.
- Nichols RG, Davenport ER. The relationship between the gut microbiome and host gene expression: a review. Hum Genet. 2021;140(5):747–60. doi:10.1007/s00439-020-02237-0.
- Enman NM, Sabban EL, McGonigle P, Van Bockstaele EJ. Targeting the neuropeptide Y system in stress-related psychiatric disorders. Neurobiol Stress. 2015;1:33–43. doi:10.1016/j.ynstr.2014.09.007.
- Ruohonen ST, Savontaus E, Rinne P, Rosmaninho-Salgado J, Cavadas C, Ruskoaho H, Koulu M, Pesonen U. Stress-induced hypertension and increased sympathetic activity in mice overexpressing neuropeptide Y in noradrenergic neurons. Neuroendocrinol. 2009;89(3):351–360. doi:10.1159/000188602.
- Chen DL, Dai YC, Zheng L, Chen YL, Zhang YL, Tang ZP. Features of the gut microbiota in ulcerative colitis patients with depression: a pilot study. Med (Baltimore). 2021;100(7):e24845. doi:10.1097/MD.0000000000024845.
- McGuinness AJ, Davis JA, Dawson SL, Loughman A, Collier F, O’Hely M, Simpson CA, Green J, Marx W, Hair C. et al. A systematic review of gut microbiota composition in observational studies of major depressive disorder, bipolar disorder and schizophrenia. Mol Psychiatry. 2022;27(4):1920–1935. doi:10.1038/s41380-022-01456-3.
- Jiang H, Ling Z, Zhang Y, Mao H, Ma Z, Yin Y, Wang W, Tang W, Tan Z, Shi J. et al. Altered fecal microbiota composition in patients with major depressive disorder. Brain Behav Immun. 2015;48:186–94. doi:10.1016/j.bbi.2015.03.016.
- Zhou Y, Chen C, Yu H, Yang Z. Fecal microbiota changes in patients with postpartum depressive disorder. Front Cell Infect Microbiol. 2020;10:10. doi:10.3389/fcimb.2020.567268.
- Lesniewska V, Rowland I, Cani PD, Neyrinck AM, Delzenne NM, Naughton PJ. Effect on components of the intestinal microflora and plasma neuropeptide levels of feeding lactobacillus delbrueckii , bifidobacterium lactis , and inulin to adult and elderly rats. Appl Environ Microbiol. 2006;72(10):6533–6538. doi:10.1128/AEM.00915-06.
- Wang W, Xu T, Chen X, Dong K, Du C, Sun J, Shi C, Li X, Yang Y, Li H. et al. NPY receptor 2 mediates NPY antidepressant effect in the mPFC of LPS rat by suppressing NLRP3 signaling pathway. Mediators Inflamm. 2019;2019:1–12. doi:10.1155/2019/7898095.
- Smialowska M, Domian H, Zieba B, Strosznajder L. Effect of lipopolysaccharide induced inflammation on neuropeptide Y neurons in mouse hippocampus. Acta Neurobiol Exp (Wars). 2009;69(3):317.
- Haghshenas B, Nami Y, Abdullah N, Radiah D, Rosli R, Khosroushahi AY. Anti-proliferative effects of enterococcus strains isolated from fermented dairy products on different cancer cell lines. J Funct Foods. 2014;11:363–74. doi:10.1016/j.jff.2014.10.002.
- Seishima J, Iida N, Kitamura K, Yutani M, Wang Z, Seki A, Yamashita T, Sakai Y, Honda M, Yamashita T. et al. Gut-derived enterococcus faecium from ulcerative colitis patients promotes colitis in a genetically susceptible mouse host. Genome Biol. 2019;20(1):20. doi:10.1186/s13059-019-1879-9.
- Sava IG, Heikens E, Huebner J. Pathogenesis and immunity in enterococcal infections. Clin Microbiol Infect. 2010;16(6):533–40. doi:10.1111/j.1469-0691.2010.03213.x.
- Golińska E. Virulence factors of enterococcus strains isolated from patients with inflammatory bowel disease. World J Gastroenterol. 2013;19(23):3562. doi:10.3748/wjg.v19.i23.3562.
- Lin L, Zhang J. Role of intestinal microbiota and metabolites on gut homeostasis and human diseases. BMC Immunol. 2017;18(1):2. doi:10.1186/s12865-016-0187-3.
- Gonzalez-Santana A, Diaz Heijtz R. Bacterial peptidoglycans from microbiota in neurodevelopment and behavior. Trends Mol Med. 2020;26(8):729–43. doi:10.1016/j.molmed.2020.05.003.
- Wu L, Luo Y. Bacterial quorum-sensing systems and their role in intestinal bacteria-host crosstalk. Front Microbiol. 2021;12:611413. doi:10.3389/fmicb.2021.611413.
- Pascale A, Marchesi N, Govoni S, Barbieri A. Targeting the microbiota in pharmacology of psychiatric disorders. Pharmacol Res. 2020;157:104856. doi:10.1016/j.phrs.2020.104856.
- Jang HM, Lee HJ, Jang SE, Han MJ, Kim DH. Evidence for interplay among antibacterial-induced gut microbiota disturbance, neuro-inflammation, and anxiety in mice. Mucosal Immunol. 2018;11(5):1386–97. doi:10.1038/s41385-018-0042-3.
- Tejada-Simon MV, Pestka JJ. Proinflammatory cytokine and nitric oxide induction in murine macrophages by cell wall and cytoplasmic extracts of lactic acid bacteria. J Food Protect. 1999;62(12):1435–44. doi:10.4315/0362-028X-62.12.1435.
- Yang YI, Wang YY, Ahn JH, Kim BH, Choi JH. CCL2 overexpression is associated with paclitaxel resistance in ovarian cancer cells via autocrine signaling and macrophage recruitment. Biomed Pharmacother. 2022;153:113474. doi:10.1016/j.biopha.2022.113474.