
ABSTRACT
The gut microbiota plays a pivotal role in metabolic disorders, notably type 2 diabetes mellitus (T2DM). In this study, we investigated the synergistic potential of combining the effects of Bifidobacterium longum NBM7–1 (CKD1) with anti-diabetic medicines, LobeglitazoneⓇ (LO), SitagliptinⓇ (SI), and MetforminⓇ (Met), to alleviate hyperglycemia in a diabetic mouse model. CKD1 effectively mitigated insulin resistance, hepatic steatosis, and enhanced pancreatic β-cell function, as well as fortifying gut-tight junction integrity. In the same way, SI-CKD1 and Met- CKD1 synergistically improved insulin sensitivity and prevented hepatic steatosis, as evidenced by the modulation of key genes associated with insulin signaling, β-oxidation, gluconeogenesis, adipogenesis, and inflammation by qRT-PCR. The comprehensive impact on modulating gut microbiota composition was observed, particularly when combined with MetforminⓇ. This combination induced an increase in the abundance of Rikenellaceae and Alistipes related negatively to the T2DM incidence while reducing the causative species of Cryptosporangium, Staphylococcaceae, and Muribaculaceae. These alterations intervene in gut microbiota metabolites to modulate the level of butyrate, indole-3-acetic acid, propionate, and inflammatory cytokines and to activate the IL-22 pathway. However, it is meaningful that the combination of B. longum NBM7–1(CKD1) reduced the medicines’ dose to the level of the maximal inhibitory concentrations (IC50). This study advances our understanding of the intricate relationship between gut microbiota and metabolic disorders. We expect this study to contribute to developing a prospective therapeutic strategy modulating the gut microbiota.
Introduction
Type 2 Diabetes Mellitus (T2DM) stands as a formidable global public health challenge, influenced by an interplay of genetic and environmental factors.Citation1,Citation2 The escalating prevalence of diabetes, propelled by rapid economic development and urbanization worldwide,Citation3 presents a critical concern. The number of adults living with T2DM has nearly quadrupled since 2019, reaching 463 million adults aged 20–79 years, with projections indicating a further increase to 573 million by 2030 and an alarming 700 million by 2045.Citation4
The current management of diabetes adheres to guidelines established by the American Association of Clinical Endocrinology (AACE)/American Diabetes Association (ADA) with glycated hemoglobin (HbA1c) levels serving as a critical treatment efficacy indicator. Initial treatments for early-stage T2DM commonly include weight reduction through dietary and exercise interventions or monotherapy with Metformin.ⓇCitation5 Subsequently, anti-diabetic medicines, including glucagon-like peptide 1 receptor agonists (GLP-1 RAsⓇ), dipeptidyl peptidase-4 (DPP-4) inhibitors,Ⓡ thiazolidinedionesⓇ (TZDs), Metformin,Ⓡ and sodium-dependent glucose transporter- 2 (SGLT2) inhibitors,Ⓡ are employed to normalize blood glucose levels.Citation6 In cases where MetforminⓇ alone proves inadequate, additional medicines such as DPP-4 inhibitors,Ⓡ TZDs,Ⓡ or GLP-1 RAsⓇ are often added. However, the increasing trend toward polypharmacy (PP) in T2DM management raises concerns about potential adverse effects, drug interaction, and reduced quality of life.Citation7
Importantly, the above-mentioned medicines have considerable impacts on the gut microbiota. MetforminⓇ treatment has been shown to increase the abundance of Akkermansia muciniphila and Bifidobacterium adolescentis,Citation8 SitagliptinⓇ increases the abundance of Bacteroidetes and decreases the abundance of Proteobacteria,Citation9 and TZDsⓇ increase the abundance of Proteobacteria, Firmicutes, and Verrucomicrobia.Citation10,Citation11
It is crucial to note that alterations in the gut microbiota have the potential to impact the efficacy and safety of anti-diabetic medicines. The gut microbiota can activate, inactivate, or metabolize medicines through the production of specific enzymes, thereby influencing their pharmacological properties and leading to variations in drug response and potential interactions.
Probiotics, which usually administered live microorganisms, can positively impact host gut health, regulate immune responses, and alleviate metabolic disorders.Citation12,Citation13 Supplementation with Lactobacillus and Bifidobacterium has demonstrated the potential to improve T2DM-related metabolic disorders related to T2DM and reduce pathogenic bacteria.Citation14–16
Understanding this intricate relationship between the gut microbiome and drug metabolisms is pivotal for optimizing the effectiveness of anti-diabetic therapies. A balanced composition of gut bacteria may enhance the functionality of anti-diabetic medicines while minimizing the risk of adverse interactions.Citation6
Given the global surge in T2DM prevalence and the increasing complexity of its management, there is an escalating urgency to explore innovative approaches to address this pressing global health concern. Recognizing the significant impact of anti-diabetic medicines on the gut microbiota, our study aims to investigate how the probiotic strain B. longum NBM7–1 can enhance the effectiveness of anti-diabetic medicines while considering the complex interactions between medicines and the gut microbiome.
Results
Enhancing the efficacy of anti-diabetic medicines in combination with CKD1 to alleviate diabetic phenotypes
This study aimed to investigate the impact of orally administration of anti-diabetic medicines in combination with CKD1 on alleviating diabetic phenotypes ()). The diabetic (DB) group showed a significant increase in body weight and white adipose tissue weight compared to the wild-type (WT) group (p < .05) ()). Although anti-diabetic medicines did not show significant differences in body weight, CKD1 exhibited a remarkable reduction in body weight, particularly in epididymal white adipose tissue (eWAT), subcutaneous white adipose tissue (sWAT), and total white adipose tissue (tWAT) (p < .05). Moreover, combined treatments, SI-CKD1 and Met-CKD1 led to a more pronounced decrease in tWAT weight compared to the DB group.
Figure 1. The synergistic effects of anti-diabetic medicines and probiotics strain B. longum NBM7–1 (CKD1) on T2D-associated phenotypes in DB group. validation for synergistic effects of anti-diabetic medicines such as Lobeglitazone®, Sitagliptin®, and Metformin® with probiotics strain CKD1 on T2DM-associated with metabolic disorder in DB group. (a) body weights of positive control groups and (b) body weights of combined treatment groups. Mice were recorded every week for 8 weeks (n = 6). (c) the weights of epididymal white adipose tissue (eWAT), peripheral white adipose tissues (pWAT), subcutaneous white adipose tissues (sWAT), and total white adipose tissues (tWats). (d) Heatmap summarizing the results of plasma metabolic: FBG; fasting blood glucose, PBG; plasma blood glucose, INS; plasma insulin, HbA1c; glycated hemoglobin, HOMA-IR; Homeostatic model assessment of insulin resistance, C-peptide; plasma C-peptide, GLP-1; glucagon-like peptide 1, TG; plasma triglycerides, and TG; plasma TC in WT group compared to DB group. (e) Heatmap summarizing the results in administered treatments of anti-diabetic medicines or probiotics alone and combined treatments. HOMA-IR [(fasting blood glucose (mmol/L) × fasting insulin (mIU/L)/22.5)] was tested after 12 h fasting at week 8 (n = 6). The parameter values were relatively calculated with DB group. Red color: increase in values (index), blue color: decrease in values (index). Statistical significance is indicated as follows: *p < 0.05, **p < 0.01, and ***p < 0.001 WT vs DB group and #P < 0.05, ##P < 0.01, and ###P < 0.001 DB vs DB-treated with anti-diabetic medicines and CKD1 group by t-test by using PASW statistics 18 software® (IBM Co., Hong Kong).
![Figure 1. The synergistic effects of anti-diabetic medicines and probiotics strain B. longum NBM7–1 (CKD1) on T2D-associated phenotypes in DB group. validation for synergistic effects of anti-diabetic medicines such as Lobeglitazone®, Sitagliptin®, and Metformin® with probiotics strain CKD1 on T2DM-associated with metabolic disorder in DB group. (a) body weights of positive control groups and (b) body weights of combined treatment groups. Mice were recorded every week for 8 weeks (n = 6). (c) the weights of epididymal white adipose tissue (eWAT), peripheral white adipose tissues (pWAT), subcutaneous white adipose tissues (sWAT), and total white adipose tissues (tWats). (d) Heatmap summarizing the results of plasma metabolic: FBG; fasting blood glucose, PBG; plasma blood glucose, INS; plasma insulin, HbA1c; glycated hemoglobin, HOMA-IR; Homeostatic model assessment of insulin resistance, C-peptide; plasma C-peptide, GLP-1; glucagon-like peptide 1, TG; plasma triglycerides, and TG; plasma TC in WT group compared to DB group. (e) Heatmap summarizing the results in administered treatments of anti-diabetic medicines or probiotics alone and combined treatments. HOMA-IR [(fasting blood glucose (mmol/L) × fasting insulin (mIU/L)/22.5)] was tested after 12 h fasting at week 8 (n = 6). The parameter values were relatively calculated with DB group. Red color: increase in values (index), blue color: decrease in values (index). Statistical significance is indicated as follows: *p < 0.05, **p < 0.01, and ***p < 0.001 WT vs DB group and #P < 0.05, ##P < 0.01, and ###P < 0.001 DB vs DB-treated with anti-diabetic medicines and CKD1 group by t-test by using PASW statistics 18 software® (IBM Co., Hong Kong).](/cms/asset/1e357cf5-30cb-46bf-8ba7-1f2d94e2ae20/kgmi_a_2319889_f0001_oc.jpg)
The metabolic parameters, including fasting blood glucose (FBG), plasma blood glucose (PBG), glycated hemoglobin (Hb1A), homeostatic model assessment of insulin resistance (HOMA-IR), C-peptide, triglycerides (TG), total cholesterol (TC) were significantly increased and glucagon- like peptide 1 (GLP-1) was significantly decreased in DB group compared to WT group, indicating increased insulin resistance (IR) (p < .05) ().
Administering LO, SI, CKD1, LO-CKD1, SI-CKD1, and Met-CKD1 resulted in decreased FBG, PBG, HbA1c, HOMA-IR, C-peptide, TG, and TC, and increased GLP-1 compared to the DB group, indicating that CKD1 alleviated the IR (). Recognizing the crucial role of IR in the pathogenesis of T2DM, we performed an oral glucose tolerance test (OGTT). The results of OGTT revealed that the DB group elevated blood glucose levels (p < .05), attributed to a reduction in insulin sensitivity (Figure S2). The combined treatments of LO-CKD1, SI-CKD1, and Met-CKD1 highlight their meaningful efficacy in alleviating T2DM-associated metabolic disorders comparing to LO, SI, or Met alone. SI-CKD1 and Met-CKD1 reduced body weight, but improved T2DM- associated metabolic parameters in the DB group, underscoring the potential of CKD1 in enhancing the efficacy of anti-diabetic medicines.
Suppression of hepatic lipid accumulation by combining anti-diabetic medicines and CKD1
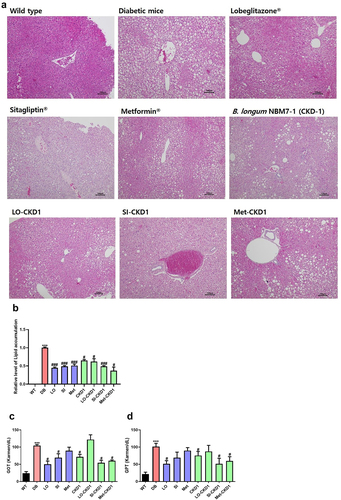
Considering the role of IR in promoting excessive lipid accumulation in the liver, which contributes to the development of hepatic steatosis, the DB group exhibited pronounced hepatic lipid accumulation, along with the elevated levels of glutamic oxaloacetic transaminase (GOT) and glutamic pyruvic transaminase (GPT) compared to the WT group. Both anti-diabetic medicines and probiotics significantly reduced hepatic lipid accumulation (p < .05) ()). The impacts of combined treatments with anti-diabetic medicines and CKD1 were investigated on hepatic steatosis, with particular focuses on SI-CKD1 and Met-CKD1, leading to significant reduction (p < .05) ()). However, when LO was combined with CKD1 (LO-CKD1), no significant difference was observed compared to LO alone. Our findings demonstrated significant reductions in hepatic lipid accumulation and liver toxicity in the DB group treated with SI-CKD1 and Met-CKD1, surpassing the effects of individual medicines (p < .05) ()). These results suggest that the combination of CKD1 may have the potential to prevent hepatic steatosis.
Figure 2. Protective effects of combined treatments on liver steatosis in DB group. the liver samples were collected as shown in Figure S1, which included samples from WT group, DB group, DB group treated with anti-diabetic medicines or probiotics strain alone, and DB group treated with combined treatments of anti-diabetic medicines and probiotics strain for 8 weeks. (a) Representative histological images of liver tissues in DB group and in DB group treated with anti-diabetic medicines or probiotics strain alone, as well as in DB group treated with combined treatments. The presence of T2D led to lipid deposition in the liver, which was assessed using H&E staining. Bar: 100 μM. (b) quantification of lipid accumulation in the liver of WT and DB group, and quantification of lipid accumulation in the liver of DB group and DB group treated with anti-diabetic medicines or probiotics strain alone or combined treatments, as shown in panel A. (c,d) liver injury in DB group, DB-fed anti-diabetic medicines groups, and DB-fed probiotics strain group or DB-fed combined treatments groups. The levels of glutamic-oxaloacetic transaminase (GOT) and glutamic-pyruvic transaminase (GPT) were measured after euthanasia at week 8. The results are presented as means ± SD, *p < .05, **p < .01, and ***p < .001 WT vs DB group and #P < 0.05, ##P < .01, and ###P < 0.001 DB vs DB-treated with anti- diabetic medicines and CKD1 group by t-test by using PASW statistics 18 software® (IBM Co., Hong Kong).
Modulation of hepatic gene expression by combined anti-diabetic medicines and CKD1
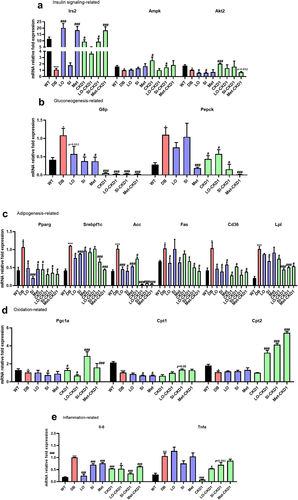
The combined treatments of anti-diabetic medicines and CKD1 showed significant impacts in the modulation of hepatic gene expression, particularly within crucial pathways such as insulin signaling, gluconeogenesis, adipogenesis, β-oxidation, and inflammation. qPCR analysis unveiled significant alterations in hepatic mRNA levels in the DB group compared to the WT group. The DB group exhibited noteworthy decreases in hepatic mRNA levels of insulin signaling genes (Irs2, Ampk, Akt2) (p < .05) and β-oxidation gene (Pgc1α, Cpt1, Cpt2) (p < .05). Conversely, there were an increase in gluconeogenesis (G6p, Pepck), adipogenesis (Pparγ, Srebpf1c, Acc, Fas, Cd36, Lpl), and inflammation genes (Il-6 and Tnfα) (p < .05) compared with WT group.
The administration of anti-diabetic medicines and probiotics up-regulated consistently genes involved in insulin signaling genes (Irs2, Ampk, Akt2) and β-oxidation genes (Pgc1α, Cpt1, Cpt2) while down-regulating those related to gluconeogenesis genes (G6p, Pepck), adipogenesis genes (Pparγ, Srebpf1c, Acc, Fas, Cd36, Lpl), and inflammation genes (Il-6 and Tnfα) (p < .05) compared to the DB group. Remarkably, SI-CKD1 and Met-CKD1 exhibited prominent improvements in insulin sensitivity, anti-obesity, and anti-inflammation effects compared to the DB group treated with anti-diabetic medicines alone (p < .05) ()). These findings underscore the potential benefits by addition of CKD1 to effectively mitigate T2DM-induced hepatic steatosis through the modulation of hepatic gene expression.
Figure 3. Effects of combined treatments on insulin signaling pathway, lipid metabolism, and inflammation-related gene expression in DB group. the liver samples were collected as shown in Figure S1, which were WT, DB, and DB treated with combined treatments for 8 weeks. (a) relative mRNA levels of genes related to hepatic insulin signaling, and (b) relative mRNA levels of genes related to hepatic gluconeogenesis, and (c) relative mRNA levels of genes related to hepatic adipogenesis, and (d) relative mRNA levels of genes related to hepatic oxidation, and (e) relative mRNA levels of genes related to hepatic inflammation in anti-diabetic drugs-fed DB, and CKD1-fed DB, or combined treatments-fed DB group. qPCR measurement of mRNA expression of insulin signaling genes of Irs2, Akt2, Ampk, G6p, and Pepck; adipogenesis genes of Pparγ, Srebpf1c, Acc, Lpl, Fas, Cd36, oxidation genes of Pgc1α, Cpt1, and Cpt2; inflammatory cytokine genes of il-6, and Tnf α; and in liver. The mRNA expression levels were relatively calculated with DB group. The results are presented as means ± SD, *p < .05, **p < .01, and ***p < .001 WT vs DB group and #P < .05, ##P < .01, and ###P < .001 DB vs DB-treated with anti- diabetic medicines and CKD1 group by t-test by using PASW statistics 18 software® (IBM Co., Hong Kong).
Gut microbiota modulation by combined anti-diabetic medicines and CKD1
We conducted a comprehensive investigation into the impact of combined treatments on the gut microbiota of the DB group compared to the WT group. The DB group exhibited a significant increase in abundance of the phylum of Firmicutes and Bacteroidetes compared to the WT group (p < .05), but no differences in Proteobacteria and Deferribacteres. However, the combined treatment significantly increased Deferribacteres compared to the DB group (p < .05) (Figure S5(a,c)).
At the Family and Genus levels, the abundance of Ruminococcaceae, and Lachnospiraceae were significantly increased, while Akkermansia and Alistipes were significantly decreased in the DB group (p < .05) compared to the WT group. In contrast, the combination of anti-diabetic medicines and CKD1 showed that the abundance of Ruminococcaceae was decreased, and Clostridium, Akkermansia, Lachnospiraceae were increased compared to the DB group. No changes were observed in the abundance of Dorea, Alistipes, and Lactobacillus (Figure S5(b,d)).
Additionally, the analysis of short-chain fatty acids (SCFAs), as the metabolites produced by gut microbiota modulation, using Gas Chromatography-MS/MS (GC-MS/MS) showed noteworthy changes. In the DB group, acetate exhibited a decrease, propionate significantly increased, while butyrate significantly decreased compared to the WT group. Conversely, when treated with CKD1, LO-CKD1, SI-CKD1, and Met-CKD1 exhibited that propionate significantly decreased, and acetate and butyrate significantly increased compared to the DB group. Moreover, the combination treatment of LO-CKD1 showed no significant differences in the profiles of SCFAs compared to the LO alone. However, SI-CKD1 and Met-CKD1 increased butyrate and decreased propionate compared to SI or Met alone (Figure S5(E-G)). Furthermore, the free fatty acids receptor 2 (FFAR2, GPR43), and 109a expression showed that SI-CKD1 and Met-CKD1 increased compared to SI or Met alone (Figure S5H, I). These results suggest that CKD1, when used in combination with anti- diabetic medicines SI, and Met, may play a crucial role in modulating the composition of the gut microbiota in the DB group.
CKD1 enhanced the efficacy of anti-diabetic medicines on DB phenotypes
To assess the potential of CKD1 to the efficacy of IC50 anti-diabetic medicines in the DB group (Figure S3), we administered maximal inhibitory concentration (IC50) of anti-diabetic medicines in combination with probiotics CKD1 in the DB group. The DB group exhibited a significant increase in body weight and WAT weights compared to the WT group (p < .05) (). The CKD1 treatment exhibited a remarkable decrease in body weight, while anti-diabetic medicines individually, but combined treatments did not affect body weight. Moreover, individual treatments did not affect the weights of pWAT, sWAT, and tWAT, but CKD1 had a significant decrease in those of WATs. And the combined treatment of LO-CKD1, SI-CKD1, and Met-CKD1 showed significant decreases in WAT weights compared to the DB group (p < .05) ().
Figure 4. CKD1 enhanced the efficacy of the anti-diabetic medicines on T2DM-associated phenotypes in DB group. validation for CKD1 enhancement of the efficacy of the half maximal inhibitory concentration (IC50) of Lobeglitazone®, Sitagliptin®, and Metformin® on T2DM- associated with metabolic disorder. The experiment is described in Figure S3. (a) body weights of CKD1 treated group and (b–d) body weights of combined treatments of IC50 of anti-diabetic medicines and CKD1 groups. Mice were recorded every week for 8 weeks (n = 6). (e) the weights of epididymal white adipose tissue (eWAT), peripheral white adipose tissues (pWAT), subcutaneous white adipose tissues (sWAT), and total white adipose tissues (tWats) changes from IC50 of anti-diabetic medicines and CKD1 groups. (f–n) T2DM associated plasma metabolic parameters; FBG; fasting blood glucose, PBG; plasma blood glucose, INS; plasma insulin, HOMA-IR; Homeostatic model assessment of insulin resistance, HbA1c; glycosylated hemoglobin, C-peptide; plasma C- peptide, GLP-1; glucagon-like peptide 1, TG; plasma triglycerides, and TG; plasma TC, interleukin-1-beta; IL-1β, tumor necrosis factor- alpha; TNF-α, and interferon gamma; IFNγ in administered treatments IC50 of anti-diabetic medicines and CKD1 groups compared to DB group. HOMA-IR [(fasting blood glucose (mmol/L) × fasting insulin (mIU/L)/22.5)] was tested after 12 h fasting at week 8 (n = 6). Statistical significance is indicated as follows: *p < .05, **p < 0.01, and ***p < .001 WT vs DB group and #P < .05, ##P < .01, and ###P < .001 DB vs DB-treated with anti-diabetic medicines and CKD1 group by t-test by using PASW statistics 18 software® (IBM Co., Hong Kong).
![Figure 4. CKD1 enhanced the efficacy of the anti-diabetic medicines on T2DM-associated phenotypes in DB group. validation for CKD1 enhancement of the efficacy of the half maximal inhibitory concentration (IC50) of Lobeglitazone®, Sitagliptin®, and Metformin® on T2DM- associated with metabolic disorder. The experiment is described in Figure S3. (a) body weights of CKD1 treated group and (b–d) body weights of combined treatments of IC50 of anti-diabetic medicines and CKD1 groups. Mice were recorded every week for 8 weeks (n = 6). (e) the weights of epididymal white adipose tissue (eWAT), peripheral white adipose tissues (pWAT), subcutaneous white adipose tissues (sWAT), and total white adipose tissues (tWats) changes from IC50 of anti-diabetic medicines and CKD1 groups. (f–n) T2DM associated plasma metabolic parameters; FBG; fasting blood glucose, PBG; plasma blood glucose, INS; plasma insulin, HOMA-IR; Homeostatic model assessment of insulin resistance, HbA1c; glycosylated hemoglobin, C-peptide; plasma C- peptide, GLP-1; glucagon-like peptide 1, TG; plasma triglycerides, and TG; plasma TC, interleukin-1-beta; IL-1β, tumor necrosis factor- alpha; TNF-α, and interferon gamma; IFNγ in administered treatments IC50 of anti-diabetic medicines and CKD1 groups compared to DB group. HOMA-IR [(fasting blood glucose (mmol/L) × fasting insulin (mIU/L)/22.5)] was tested after 12 h fasting at week 8 (n = 6). Statistical significance is indicated as follows: *p < .05, **p < 0.01, and ***p < .001 WT vs DB group and #P < .05, ##P < .01, and ###P < .001 DB vs DB-treated with anti-diabetic medicines and CKD1 group by t-test by using PASW statistics 18 software® (IBM Co., Hong Kong).](/cms/asset/9738e53c-3d40-4338-b9ca-ce966bc2f822/kgmi_a_2319889_f0004a_oc.jpg)
Figure 4. (Continue).
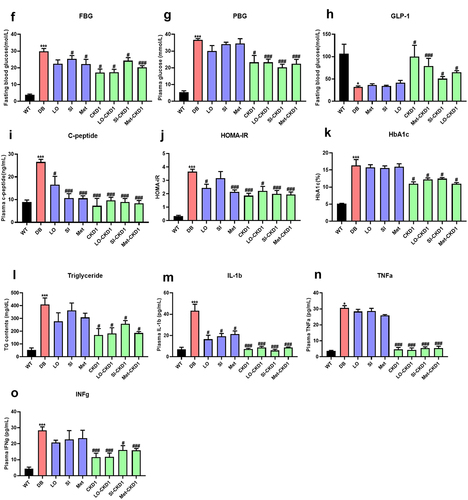
Although the DB group exhibited significantly elevated levels of FBG, PBG, C-peptide, HOMA- IR, HbA1c, IL-1β, TNF-α, and IFNγ, while the level of GLP-1 was remarkably reduced compared to the WT group (p < .05). Oral administrations of individual anti-diabetic medicines alone had negligible effects on these metabolic parameters. In contrast, CKD1 treatment induced significant reductions in insulin resistance and inflammation. Furthermore, the combined treatment of LO- CKD1, SI-CKD1, and Met-CKD1 revealed that the levels of PBG, C-peptide, HOMA-IR, HbA1c, IL-6, TNF-α were significantly decreased and GLP-1 was significantly increased (p < .05) (Figure 4(f–n). These results are distinctive that the probiotics CKD1 has a potency to enhance the efficacy of IC50 of anti-diabetic medicines for improving insulin sensitivity.
The DB group exhibited an excessive lipid droplet accumulation in the liver and significantly elevated GOT, and GPT levels compared to the WT group (p < .05) ()). At the IC50 of all anti-diabetic medicines, there were no effects on hepatic lipid accumulation, while CKD1, LO- CKD1, SI-CKD1, and Met-CKD1 significantly reduced the numbers of hepatic lipid droplet accumulation and decreased the levels of GOT and GPT (p < .05) ()). These findings suggest that the probiotics CKD1 enhances the insulin sensitivity of the IC50 of anti-diabetic medicines, which may help preventing the hepatic steatosis.
Figure 5. CKD1 prevented the hepatic lipid accumulation in DB-fed IC50 of anti-diabetic medicines groups. validation for CKD1 protect effects liver steatosis in DB-fed IC50 of anti-diabetic medicines groups. The experiment is described in Figure S3., which included samples from WT group, diabetic DB group, DB-fed IC50 of anti-diabetic medicines or CKD1 alone, and DB-fed combination of IC50 of anti-diabetic medicines and probiotics strain for 8 weeks. (a) representative histological images of liver tissues in DB group and in DB-fed IC50 of anti- diabetic medicines or probiotics strain alone, as well as in DB-fed combination treatments groups. (b) quantification of lipid accumulation in the liver of as shown in panel A by using ImageJ software. The presence of T2D led to lipid deposition in the liver, which was assessed using H&E staining. Bar: 100 μM. (c) the levels of glutamic-oxaloacetic transaminase (GOT), (d) the levels of glutamic-pyruvic transaminase (GPT), indicating liver injury in DB, DB-fed CKD1, and DB-fed IC50 of anti-diabetic medicines groups. The results are presented as means ± SD, *p < .05, **p < .01, and ***p < .001 WT vs DB group and #P < .05, ##P < .01, and ###P < 0.001 DB vs DB-treated with anti- diabetic medicines and CKD1 group by t-test by using PASW statistics 18 software® (IBM Co., Hong Kong).
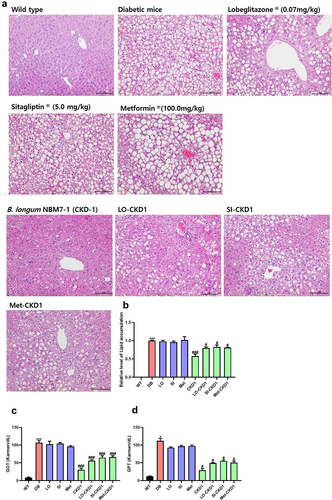
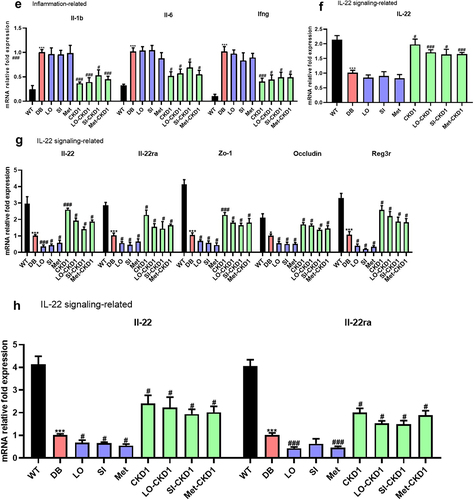
Figure 6. CKD1 changed the mRNA expression levels related to metabolism, inflammation, tight junction, and IL-22 signaling in the liver, ileum, and pancreas the efficacy of anti-diabetic medicines on the T2DM-associated phenotypes in DB group. validation for CKD1 effects gene expression in DB- fed IC50 of anti-diabetic medicines group. The experiment is described in Fig. S3. (a) relative mRNA levels of genes related to hepatic insulin signaling, and (b) relative mRNA levels of genes related to hepatic gluconeogenesis, and (c) relative mRNA levels of genes related to hepatic adipogenesis, and (d) relative mRNA levels of genes related to hepatic oxidation, and (e) relative mRNA levels of genes related to hepatic inflammation, and (F) relative mRNA levels of gene related to hepatic IL-22 signaling, (G) relative mRNA levels of genes related to ileum IL-22 signaling and tight junction protein, and (H) relative mRNA levels of gene related to pancreatic IL-22 signaling in WT group, DB-fed IC50 of anti-diabetic medicines group, DB-fed CKD1 group, or DB-fed combined treatments group relatively compared to DB group. qPCR measurement of mRNA expression of insulin signaling genes of Irs2, Ampk, Akt2, gluconeogenesis genes of G6p, and Pepck; adipogenesis genes of Pparγ, Srebpf1c, Acc, Fas, oxidation genes of Pparα, Pgc1α, Cpt1, and Cpt2; inflammatory cytokine genes of Il-β, Il-6, and Ifnγ; and IL-22 signaling genes of Il-22, Il-22ra, and Reg3γ; tight junction genes of zo-1, and Occ; pro-inflammatory cytokine genes of Il-1β, Infγ and Il-6. The parameter values were relatively calculated with DB group. Statistical significance is indicated as follows: *p < .05, **p < .01, and ***p < .001 WT vs DB group and #P < .05, ##P < .01, and ###P < .001 DB vs DB-treated with anti-diabetic medicines and CKD1 group by t-test by using PASW statistics 18 software® (IBM Co., Hong Kong).
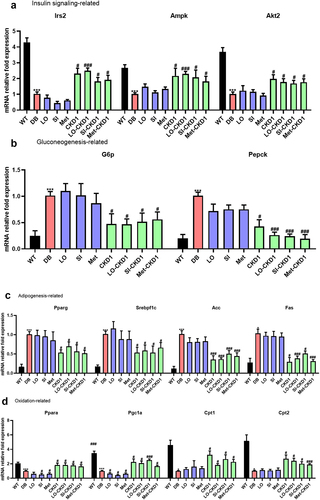
Figure 6. (Continue).
CKD1 activated hepatic, ileum, and pancreatic IL-22 pathways in the anti-diabetic medicines dose-dependent
Next, we aimed to elucidate the molecular mechanisms underlying the shift of the IL-22 pathway induced by CKD1. The CKD1 enhanced the metabolic pathway in hepatic gene expression profiles in the DB group fed with the IC50 of the individual anti-diabetic medicines. Our qPCR analysis revealed that the DB group exhibited significant decreases in hepatic mRNA levels of insulin signaling genes (Akt2, Irs2, Ampk) (p < .05), β-oxidation genes (Ppaγ α, Pgc1α, Cpt1, Cpt2) (p < .05), IL-22 signaling gene (Il-22) (p < .05), increased gluconeogenesis genes (G6p, Pepck) (p < .05), adipogenesis genes (Pparγ, Srebpf1c, Acc, Fas) (p < .05), and inflammation genes (Il-1β, Il-6, Infγ) (p < .05) compared to the WT group ().
The administration of anti-diabetic medicines alone consistently down-regulated insulin signaling, β-oxidation genes, and IL-22 signaling. However, these signaling did not significantly affect gluconeogenesis, adipogenesis, and inflammation genes compared to the DB group. The same results were observed consistently in the ileum and pancreas ()).
Our findings demonstrated a significant decrease in the mRNA levels of IL-22 signaling genes (IL-22, IL-22ra, Reg3γ), tight junction protein genes (Zo-1, Occludin) in the ileum of the DB group (p < .05), and the mRNA levels of IL-22 signaling genes (Il-22, Il-22ra) in the pancreas were also significantly lower in the DB group than the WT group (p < .05). When the DB group were administered each individual anti-diabetic medicine with CKD1, tight junction, and IL-22 signaling were enhanced compared to the DB group treated with the medicine alone. These results suggest that the probiotics CKD1 promotes not only the hepatic insulin and oxidation pathway, and inhibits inflammation, but also the gut-intestinal integrity, and pancreatic IL-22 pathway on DB group fed to the levels of IC50 of the individual anti-diabetic medicine through the activation of the IL-22 pathway.
Impact of Metformin® and CKD1 on gut microbiota composition
The significant differences in gut microbial composition were observed between the DB group and the WT group, with a linear discriminant analysis (LDA) score > 2 effectively highlighting these disparities. At the Family level, there was significant enrichment in Desulfovibrionaceae, unclassified_Eubacteriales, Enterococcaceae, and Streptococcaceae. At the Genus level, an increase in Desulfovibrio, Enterococcus, unclassified_Lachnospiraceae, and unclassified_Eggerthellaceae, Streptococcus in the WT group (p < .05). In contrast, the DB group exhibited significant enrichments at the Family level, including Bacteroidaceae, Staphylococcaceae, Lactobacillaceae, Enterobacteriaceae, and at the Genus level, notable increases in Bacteroides, Lactobacillus, Ligilactobacillus, and Escherichia (p < .05). Particularly a noteworthy was the significant increase Escherichia, known for compromise tight junctions, in the DB group, while Lachnospiraceae, which plays a role in regulating the initial immune response in the host, exhibited a significant reduction. Furthermore, Desulfovibrionaceae, recognized for its anti-obesity effect, exhibited a significant reduction (p < .05) ().
Figure 7. Synergistic effects of Metformin® and CKD1 on gut microbiota. after an 8-week intervention, total bacterial DNA was isolated from feces, the 16S rRNA gene was sequenced, and the SCFA concentration was measured using gas chromatography-mass spectrometry (GC- MS). (a–d) LEfSe analysis with significant differences in abundance between WT group, DB group, DB-fed IC50 of Metformin®, DB-fed CKD1, and DB-fed combination of IC50 of Metformin® and CKD1 groups. (e–g) correlating the gut microbiota T2DM-associated metabolic parameters in WT group, DB group, DB-fed CKD1, and DB-fed combination of IC50 of Metformin® and CKD1 groups (n = 6 animals per groups). Statistical significance is indicated as follows: *p < .05, **p < .01, and ***p < .001 WT vs DB group and #P < 0.05, ##P < .01, and ###P < .001 DB vs DB-treated with anti-diabetic medicines and CKD1 group by t-test by using PASW statistics 18 software® (IBM Co., Hong Kong).
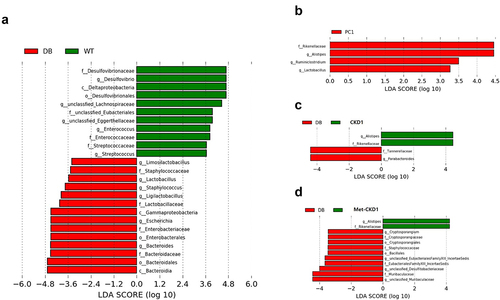
Figure 7. (Continue).
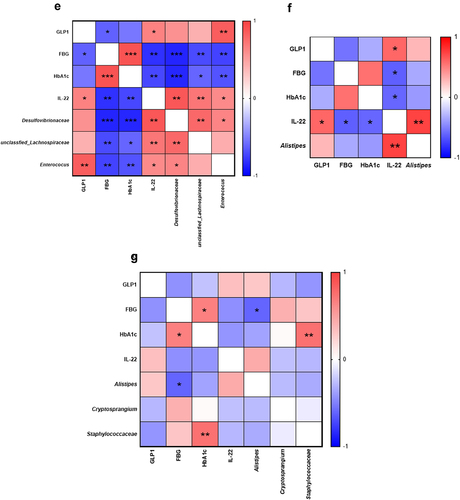
In our analysis, we focused on the enrichment abundance in WT group, specifically Desulfovibrionaceae, Unclassified_Lachnospiraceae, Enterococcus. To find out the possible connection between microbiota and diabetic-related indicators, we analyzed the correlation between altered-microbial taxa and key indicators of T2DM such as FBG, HbA1c, GLP1, and IL-22. The analysis revealed a significant finding regarding the relationship between Desulfovibrionaceae Unclassified_Lachnospiraceae, Enterococcus and the T2DM indicators. Notably, these microbial taxa exhibited a significant negative correlation with FBG, and HbA1c. Conversely, a strong positive correlation was observed with GLP1, and IL-22 (). These findings underscore the potential impact of altered gut microbiota composition, specifically the decrease in the abundance of Desulfovibrionaceae, Unclassified_Lachnospiraceae, Enterococcus on the progression of T2DM. The correlations with FBG, HbA1c, GLP1, and IL-22 highlight the intricate interplay between these microbial taxa and T2DM-related metabolic disorders, and inflammatory processes.
Examining the effects of MetforminⓇ, CKD1, and their combination on gut microbial composition in T2DM, it was observed that MetforminⓇ led to significant increases in the abundance, including Rikenellaceae at the Family level, and Alistipes, Ruminiclostridium, and Lactobacillus at the Genus level (p < .05) (). In the DB group fed with CKD1, there were significant increases in the abundances of Rikenellaceae and Alistipes, as well as remarkable reductions in Tannerllaceae and Parabacteroides (p < .05) (). Additionally, Alistipes in the CKD1 group exhibited a strong positive correlation with IL-22 ().
Furthermore, the Met-CKD1 combination exhibited significant increases in the abundances of Rikenellaceae and Alistipes, along with a notable reduction in the abundance of Cryptosporangiaceae, Staphylococcaceae, Desulfitobacteriaceae, and Muribaculaceae (p < .05) (). Alistipes in the Met-CKD1 group showed a strong positive correlation with IL-22, while Crptosproangium and Streptococcaceae demonstrated positive correlation with FBG and HbA1c (). These results suggest that the probiotics CKD1 may contribute to modulating gut microbiota in a way that reduces potentially pathogenic species when used it in combination with MetforminⓇ. Overall, these findings imply that the probiotics CKD1 may have a beneficial impact on the gut microbiota in the context of T2DM, potentially influencing markers of metabolic disorders and inflammation.
Modulation of short-chain fatty acids (SCFAs) profiles by the combination of MetforminⓇ and CKD1
The alterations in gut microbiota composition were investigated through the analysis of short- chain fatty acid (SCFA) profiles using GC-MS. Figures 7(e–g) revealed that the acetate content showed a decrease in the DB group compared to the WT group, and further reductions in the content of the CKD1 and Met-CKD1 treatments within the DB group (). Then the propionate content exhibited a significantly increase in the DB group compared to the WT group (p < .05), but the contents were comparatively significantly decreased in the groups of MetforminⓇ, CKD1, and Met-CKD1 compared to the DB group (p < .05) (). Similarly, the butyrate content was significantly decreased in the DB group compared to the WT group. However, the content of the groups of MetforminⓇ, CKD1, and Met-CKD1 led to significantly increased compared to the DB group (p < 0.05) ().
Figure 8. Synergistic effects of MetforminⓇ and CKD1 on fecal SCFAs and Gpr43/109a in ileum of DB group. After an 8-week intervention, the SCFA concentration was measured using gas chromatography-mass spectrometry (GC-MS). (a–c) fecal concentrations of SCFAs after an 8-week intervention (n = 3 animals per groups). (d,e) Gpr43/109a expression on ileum in T2DM mouse measured by qRT-PCR (n = 6). Statistical significance is indicated as follows: *p < .05, **p < .01, and ***p < .001 WT vs DB group and #P < .05, ##P < .01, and ###P < .001 DB vs DB-treated with anti-diabetic medicines and CKD1 group by t-test by using PASW statistics 18 softwareⓇ (IBM Co., Hong Kong).
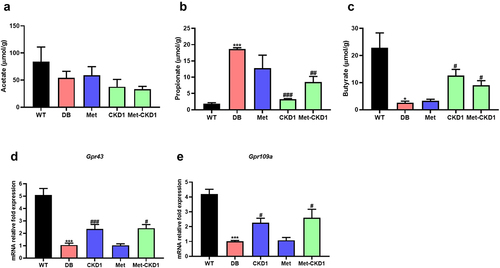
The expression of GPR43 and 109A, known as SCFA transporters, indicated a significant decrease in the DB group compared to the WT group. And no significant difference in the MetforminⓇ. In contrast, the CKD1 and Met-CKD1 groups showed significant increases in the expression compared to the DB group. These findings suggest that CKD1 may play a role in modulating SCFA profiles, especially when CKD1 combined with MetforminⓇ, indicating a consistent modulation of gut microbiota ()).
CKD1 enhanced IL-22 pathway with IC50 of anti-diabetic medicines
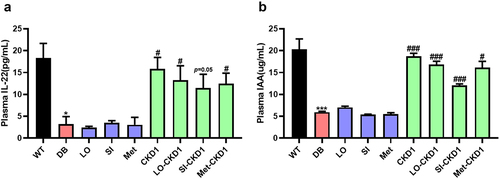
We investigated the potential significance of CKD1-derived metabolites as metabolic mediators capable of activating the IL-22 signaling pathway, and verify the metabolite can be mitigating metabolic disorders associated with T2DM. Both anti-diabetic medicines and CKD1 led to increased levels of serum IL-22 and indole-3-acetic acid (IAA). The administration of the IC50 of anti-diabetic medicines did not yield significant differences compared to the DB group. However, in the IC50 of the medicines combined with the probiotics CKD1, there were significant increases in the levels of serum IL-22 and IAA compared to the DB group (p < .05) ()). Figure S1 demonstrated that both anti-diabetic medicines and the probiotics CKD1 led to significant increases in IAA compared to the DB group. These findings suggest that the probiotics CKD1 may contribute to promoting insulin sensitivity through activation of the IL-22 pathway, although the exact underlying mechanisms are still required further investigation.
Figure 9. CKD1 enhanced the IL-22 signaling through the elevated plasma IAA and IL-22. after an 8-week experimental period, the blood samples were collected as shown in Figure S3, which were WT, DB, and DB-fed IC50 of anti-diabetic medicines and probiotics strain alone or in combination for 8 weeks. (a) ELISA measurement of plasma IL-22. (b) ELISA measurement of plasma indole-3-acetic acids (IAA). n = 5 to 6 mice per group. Statistical significance is indicated as follows: *p < .05, **p < .01, and ***p < .001 WT vs DB group and #P < .05, ##P < 0.01, and ###P < .001 DB vs DB-treated with anti-diabetic medicines and CKD1 group by t-test by using PASW statistics 18 softwareⓇ (IBM Co., Hong Kong).
Discussion
The disruption of the normal gut microbiome has been related to the outbreak of various metabolic diseases, such as obesity, nonalcoholic fatty liver, cardiovascular, and T2DM.Citation17 The commercial anti-diabetic medicines have been reported to modulate the composition of gut microbiota by anti-diabetic medicines.Citation17–21 Additionally, the efficacy of anti-diabetic medicines in human T2DM patients can be influenced by gut microbiota modulation. Koh AR et al.Citation22reported that the imidazole propionate produced by microbiota inhibits the efficacy of MetforminⓇ. The probiotics originating from gut microbes can be useful microbial strategies to modulate gut microbiome and disease status. There are some reports that some strains of probiotic microorganism may alleviate metabolic disorders and inflammatory diseases.Citation22–26 In this point, our study contributes to advancing our understanding of the potential mechanisms through which the probiotics strain of B. longum NBM7–1 (CKD1) inhibits T2DM development and how the combination of the IC50 of anti-diabetic medicines and CKD1 can exert anti-diabetic effects.
The type 2 diabetes mellitus (T2DM) exerts an influence on the changes in body weight, encompassing both gains and losses. According to Ferreira et al. patients experiencing weight gains tend to exhibit an approximately 1.5-fold than weight losses. Moreover, the causes of weight loss in T2DM patients are closely associated with severe complications, such as cardiovascular disease.Citation27 In our experiment, a T2DM mice model utilizing the leptin receptor-deficient mouse model was employed. This animal lacks leptin receptors, rendering feed intake unregulated even when the appetite-regulating hormone leptin is secreted. Consequently, an excessive fat accumulation occurs, leading to the pancreatic β-cell dysfunction and insulin resistance. Therefore, in this study, the observed increase in body weight () is identified as a characteristic feature of the general db/db+/+ mouse, consistent with similar findings in other studies involving the same db/db+/+ mouse.Citation27–29
The elevation in the level of FBG, C-peptide, HOMA-IR, TG, and TC observed in the DB group, indicates the outbreak of metabolic disorder. The insulin resistance (IR) is related to the hepatic lipid accumulation, the elevation of plasma inflammatory cytokines,Citation30–33 and the reductions in plasma IAA and IL-22, which are related to a bidirectional relationship between T2DM-associated dysbiosis and impaired glucose metabolism.Citation34–37 It is reported that the precise mechanism underlying the contribution of modulated gut microbiota or hyperglycemia to increased gut permeability and lipid accumulation remains elusive.Citation38,Citation39
In our experiment on hepatic mRNA expression, down-regulation of the insulin pathway and β- oxidation were observed along with increased adipogenesis and inflammation in the DB group This observation indicates that typical T2DM-associated gut dysbiosis leads to the hepatic steatosis complications coincides with Tanase et al .Citation40 Sharma et al Citation41 suggested the potential role of the gut microbiota in disease progress in the Phylum levels, increased the abundance of Firmicutes, but decreased the abundance of Bacteroidetes, increased the abundance in the Families of Ruminococcaceae, and Lachnospiraceae in T2DM. The microbiota-mediated inflammation weakens the intestinal epithelial cells resulting in the increased flux of LPS from the gut lamina propria into the blood may be causal for metabolic dysfunction.Citation41–44
The IR has increasingly recognized its role in the pathogenesis of NAFLD.Citation45,Citation46 We show for the first time that the administration of anti-diabetic medicines or CKD1 had significantly lower the level of IR. The combination of anti-diabetic medicines and CKD1 decreased the levels of IR and hepatic steatosis, and exhibited a more significant enhancement in the efficacy of individual medicine alone, except for LobeglitazoneⓇ. These results provide evidence that the probiotics CKD1 may enhance the efficacy of SitagliptinⓇ and MetforminⓇ.
In an intestinal tract, the cecum (Figure S5) was also an increase in Defferibactere, and Bacteoidetes and no significant differences in Firmicutes, Ruminococcaceae, and Lachnospiraceae. Interestingly, SitagliptinⓇ treatment resulted an increase in the abundance of Clostridium, but administration together with the probiotics CKD1 increased the abundance of Lachnospiraceae, Clostridium, and Akkermansia. These findings suggest that probiotics CKD1 may enhance the anti-diabetic effects of MetforminⓇ and SitagliptinⓇ, and reveal the prominent synergistic effects of probiotics and the known actions of individual medicine.Citation47,Citation48 Furthermore, our findings raise the possibility that this combined treatment not only influences the composition of gut microbiota, but also enhances the effectiveness of anti-diabetic medicines in alleviating diabetic phenotypes. This result highlights the potential role of the probiotics CKD1 as a valuable adjunct to anti- diabetic treatments.
We observed a notable reduction in the anti-diabetic effects at the lower concentration of anti- diabetic medicines indicated the importance of dosage in achieving therapeutic outcomes (Figure S3). This reduction in dosage failed to produce significant differences in phenotypic characteristics between DB-fed normal concentration of anti-diabetic medicines group and DB-fed IC50 of anti- diabetic medicines group, but also had no impact on hepatic steatosis. Furthermore, we found the down-regulation of the IL-22 pathway in the liver, pancreas, and ileum tissues of the DB group, also the decreased production of indole-3-acetic acid (IAA) as an inducer of the IL-22 pathway. This down-regulation in the IL-22 pathway is associated with the impaired metabolic functions and tissue damage.Citation49 The IAA, an indole derivatives metabolized from tryptophan by gut microbiota, possesses direct functions as an antioxidant and anti-inflammatory cytokine mediator. Additionally, it increases the secretion of GLP-1 and activates Type 3 innate lymphoid cells (ILC3), leading to an elevation in IL-22 secretion and the generation of antimicrobial proteins. Moreover, the IAA directly contributes to the augmentation of the mucus layer and the reinforcement of tight junctions.Citation50
In contrast to these findings, the combined treatments with CKD1 yielded promising results. In the phenotype analysis, we observed a reduction in adipose tissue weight, an increase in insulin sensitivity, and elevated levels of plasma IL-22 and IAA. Moreover, in the liver, ileum, and pancreas tissues, the up-regulation of insulin signaling, β-oxidation, IL-22 signaling, and tight junction proteins observed, while inflammation was desirably down-regulated. These results underscore the potential of the probiotics CKD1 in enhancing the therapeutic effects of anti-diabetic medicines. The rehabilitation of the IL-22 pathway, improved insulin sensitivity, and regulation of metabolic processes suggest the synergistic effects between CKD1 and anti-diabetic medicines. These results imply that the efficacy of anti-diabetic medicines enhances the upregulating IL-22 pathway through IAA production derived by CKD1.
The IL-22, an anti-inflammatory cytokine belonging to the IL-10 family, is primarily produced by innate lymphoid cells (ILCs). It has negative correlations with various diseases such as T2DM, coronary artery disease, nonalcoholic fatty liver, renal injury, and β-cell dysfunction,Citation17,Citation49–55 IL- 22 provides protective action against metabolic disorders and contributes to the reprogramming of metabolisms.Citation36,Citation56 The expression of IL-22 depends on the compositions of the gut microbiota and the profiles of SCFAs derived from them.Citation57
The absorption of SCFAs facilitated by receptors such as Free Fatty Acid Receptor 3 (FFAR3) and G-protein coupled receptors (GPRs) like GPR41, GPR43, and GPR109A. These receptors are present in adipocytes, intestinal epithelial cells, and pancreatic beta-cells. The propionate activates GPR41 and GPR43, the acetate activates GPR43 and GPR119, while the butyrate activates GPR43 and GPR109A.Citation58,Citation59 The activation of GPR43 by the propionate and butyrate is associated with appetite suppression through mechanisms involving leptin and peptide tyrosine-tyrosine (PYY), as well as the enhancement of insulin secretion. Moreover, the activated GPR43 promotes the activation of colonic innate lymphoid cells (ILC3), leading to an increase in IL-22 expression, which, in turn, influences epithelial regeneration.Citation60 Our experimental results indicate an increase in the ratio of propionate with a decrease in the butyrate due to T2DM-induced gut microbiota modulation. Consequently, the GPR41 activation by propionate increases leptin; however, given the leptin receptor knockout model, appetite regulation appears unaffected. In contrast, the treatment of CKD1 led to a decrease in the ratio of propionate and an increase in butyrate. This suggests that activation of GPR43 and GPR109A improves glucose tolerance by increasing GLP-1 secretion and reducing inflammatory cytokines. While some studies suggest associations between GPR41, GPR43, and glucose tolerance, activated GPR41 is known to increase metabolic syndrome by inhibiting insulin or GLP-1 secretion. Conversely, the metabolic disorders are alleviated in GPR41 and GPR43 deficient mice.Citation61 Due to conflicting research findings, understanding the precise mechanisms remains still to be challenging.
In the IL-22 knockout mice, there was a decrease in Lactobacillus abundance while an increase in pathogens such as E. coli and Salmonella among the gut microbiota.Citation62 In this study, the combined administration of anti-diabetic medicines with probiotics were proved to enhance IL-22 expression in the gut, offering the protective effects against liver steatosis and pancreatic functions and restoring the intestinal epithelial tight junctions.
The combination of MetforminⓇ and the probiotics CKD1 ameliorated T2DM-associated metabolic parameters significantly by enhancing the IL-22 pathway. The effects of Met-CKD1 treatment were observed as an initiative fruit with the significant differences in gut microbial composition between the WT and DB groups. Based on the LeFSe analysis, the DB group exhibited an enrichment of taxa associated with metabolic dysfunction, such as Enterobacteriaceae, and Escherichia. In contrast, the abundance of Desulfovibrionaceae was significantly reduced in the DB group. Peralta et al.Citation63 reported Enterobacteriaceae to exhibit a high abundance in T2DM patients. Also, Desulfovibrionacae is associated with the high abundance in healthy persons.Citation64 Additionally, the correlation plot depicting the rich species within the WT and DB groups and their associations with metabolic parameters revealed noteworthy patterns. Deseulfovibrionaceae bacterium LT0009 exhibited a negative correlation with FBG, OGTT, C- peptide, and TNFa, while showing a positive correlation with IL-22 and IAA. In contrast, Escherichia fergusonoii ATCC354569 displayed a positive correlation with FBG, OGTT, HOMA- IR, C-peptide, and IL-6, while demonstrating a negative correlation with IL-22 and IAA (Fig S6).
In the DB group, both MetforminⓇ and CKD1 administration resulted in an abundance of Alistipes, a species known for its higher abundance in healthy persons and its influence on tryptophan metabolism.Citation38,Citation65 Importantly, our findings showed a significant reduction in the abundance of Cryptosporangdium, a microbe associated with urogenital and intestinal parasitosis and T2DM.Citation66 While the administration of MetforminⓇ or CKD1 alone did not induce T2DM- related gut dysbiosis, the combined treatments of Met-CKD1 were effective in ameliorating T2DM-induced gut dysbiosis promoting a healthier gut microbiota composition. These results mean that the CKD1 supplementation with MetforminⓇ influences the composition of gut microbiota by increasing the abundance of Alistipes, a positively associated with the incidence of T2DM while reducing the abundance of Cryptosporangdium, Staphylococcaceae, Muribaculaceae which are negatively associated. Therefore, it may be thought that the alterations in the gut microbiota result in the production of specific metabolites.
The findings can be summarized as that T2DM was associated with an increase in the abundance of Enterobacteriaceae, Escherichia, and Staphylococcaceae, leading to an increase in propionate levels. Additionally, T2DM results in a decrease in plasma IAA levels. These changes contribute to the down-regulation of the IL-22 pathway, resulting in the degradation of tight junctions and the induction of innate immune responses.Citation66–69
However, the combined with CKD1 leads to change in the gut microbiota composition and their SCFAs profiles. As a result, the combined with CKD1 enhances IL-22 signaling, based on the altered gut microbial composition, leading to increased butyrate and reduced propionate, along with the elevated IAA levels, contributing to the improvement of IL-22 signaling in conditions such as CKD1. Moreover, the up-regulation of the IL-22 pathway through the increase in the IAA levels strengthens tight junctions and enhances the Reg3γ secretion. The results show that CKD1 prevents the translocation of pathogen and reduces the inflammatory cytokine levels. These findings shed light on the complex interplay between CKD1-induced gut microbiota modulation, derived metabolites, and the IL-22 pathway in T2DM.
LobeglitazoneⓇ (LO) functions as a PPAR-gamma agonist, activating PPARγ to facilitate the storage of free fatty acids into triglycerides through insulin signaling. Additionally, it activates insulin signaling and AMPK signaling, inhibiting gluconeogenesis, and PPAR alpha, promoting the activation of β-oxidation.
In our experiments, the diminished anti-diabetic efficacy observed with the combination of LO and CKD1 (LO-CKD1 group), which can be attributed to the fact that LO is a PPARγ agonist, while CKD1 inhibits PPARγ. The combination of LO and CKD1 leaded to a decrease in synergistic effects, as CKD1‘s inhibition of PPARγ counter-acted the agonistic action of LO on PPARγ.
The DPP4 inhibitor (DPP4iⓇ) increased the secretion of glucagon-like peptide 1 (GLP-1). This leads to an elevation in insulin secretion, activating the AMPK pathway and GLP-1 to regulate blood glucose levels. The enhanced anti-diabetic efficacy observed when SitagliptinⓇ was combined with CKD1 (SI-CKD1 group), which can be attributed to the fact that SI is a GLP-1 agonist, and CKD1 activates both AMPK and GLP-1. Therefore, the combined use of SI and CKD1 was inferred to result in an increased synergistic effect due to their complementary mechanisms of action in regulating blood glucose levels.
The MetforminⓇ (Met) activates the AMPK pathway and GLP-1 to regulate blood glucose levels. Also it inhibits the adipogenesis transcription factor SREBP-1c, thereby suppressing de novo lipogenesis in the liver, inhibiting hepatic fat accumulation, and reducing triglyceride levels. The increased anti-diabetic effect observed when Met is combined with CKD1 (Met-CKD1 group) can be attributed to the fact that Met is an AMPK activator and a GLP-1 agonist. The probiotics CKD1 also activates both AMPK and GLP-1. Therefore, the combined use of Met and CKD1 was inferred to result in an increased synergistic effect, as their complementary mechanisms of action contributed to the enhanced regulation of blood glucose levels.
In this study, the enhanced efficacy of anti-diabetic medicines observed with combination treatment is attributed to the increased activation of the AMPK pathway and GLP-1 secretion induced by the probiotic CKD1. Furthermore, the administration of Met-CKD1 resulted in a reduction of T2DM-induced pathogens, alterations in SCFAs profiles, and enhanced activation of the GPR43/109A pathway, suggesting an association with IL-22 signaling.
However, it remains unclear whether the probiotics CKD1 alleviates diabetes, leading to a reduction in the IL-22 pathway, or if CKD1 activates the IL-22 pathway, subsequently alleviating diabetes. Therefore, the further researches on the impact of CKD1 treatment on IL-22 activation in healthy wild-type mice should be investigated. Moreover, administering the known IL-22 pathway precursors, indole-metabolites, as a positive control in T2DM mouse mice could offer insights into its potential anti-diabetic effects.
In conclusion, this study has successfully uncovered the anti-diabetic properties of a probiotic strains of B. longum NBM7–1 (CKD1) derived from healthy individuals, elucidating their synergistic effects when combined with diabetic medications in a T2DM mouse model. Although the CKD1 demonstrated no synergistic effects with LobeglitazoneⓇ, possibly attributable to CKD1‘s inhibition of PPARγ, in contrast to the PPARγ agonist property of LobeglitazoneⓇ. but, the insulin secretion agonists SitagliptinⓇ and MetforminⓇ exhibited synergistic effects with the combination with the probiotics CKD1, attributed to the probiotics’ capacity to elevate GLP-1 and activate AMPK. Furthermore, our exploration of the correlation between T2DM and IL-22 signaling has unveiled valuable insights into the impact of T2DM on gut microbiota composition.
The present study suggests that probiotic strain CKD1 holds significant promise as an adjunct therapy for T2DM patients. The combination of anti-diabetic medicines with CKD1 markedly enhances the efficacy of diabetes medicines by activating the IL-22 pathway, renowned for its role in epithelial regeneration and the amelioration of metabolic disorders. These combinations contribute to improved insulin signaling and a noteworthy reduction in T2DM-associated markers. The implications of our findings extend to the realm of personalized diabetes management, highlighting the potential for tailored approaches through the intricate interplay between gut microbiota and the IL-22 pathway. This research not only expands our understanding of the mechanisms underlying anti-diabetic effects but also opens avenues for innovative strategies in treating and managing T2DM.
Materials and methods
Probiotics strain and anti-diabetic medicines
B. longum NBM7–1 selected from the previous studyCitation70 was cultured at 37°C for 24 hours in MRS broth (de Man, Rogosa and Sharpe, BD Life Science, USA) supplemented 0.05% L-cysteine under anaerobic conditions (75% N2, 20% CO2, and 5% H2). The cell pellet was obtained by centrifugation at 5,000 × g for 10 min at 4°C and resuspended in phosphate-buffered saline (PBS, Corning, USA) by 1 × 10⁹ CFU/mL. Three anti-diabetic medicines MetforminⓇ (Withus Pharm, Korea), SitagliptinⓇ (Merck & Co., USA), and LobeglitazoneⓇ (Chong Kun Dang Pharm, Korea) were purchased.
Animal experiments
5-week-old male diabetic (DB; db/db+/+) group and age-matched wild type (WT; db/db+/-) group were purchased from Daehan Biolink Co. (Korea) and housed at Designed Animal Resource Center (Green campus of SNU, Korea). The groups were maintained under 12 h intervals of a light – dark cycle at a constant temperature and humidity (23.1°C and 55.5%) for eight weeks, allowed free access to water, and received a modified diet (Ddobio Inc., Korea) of the American Institute of Nutrition 93 G diet. All animal experiments were conducted during eight weeks, and the experimental designs are detailed in Figure S1 and S3. Briefly, the synergistic effects of anti- diabetic medicine and probiotics on the DB group were validated (Figure S1). The potential enhancement of the efficacy of IC50 anti-diabetic medicines by CKD1 was assessed (Figure S3). The in vivo experiments carried out by the guidelines from the Korean Association for Laboratory Animals, and the experimental protocol approved by the Institutional Animal Care and Use Committee of Seoul National University (IACUC Approval NO. SNU-210415-3-2, and NO. SNU- 220311-3). All experiments adhered to the principles outlined in the “Guide for the Care and Use of Laboratory Animals” published by the NIH (National Institute of Health, USA).
Biochemical parameters
The serum insulin, glucose, GLP-1 (Glucagon-like peptide-1), and C-peptide were measured using ELISA kits (Crystal Chem, USA). The levels of triglyceride, total cholesterol, and glutamic- oxaloacetic transaminase (GOT), glutamic pyruvic transaminase (GPT) were measured using assay kits (Asan Parm, Korea), The levels of cytokine (IL-6, IL-10, INFγ) (BioLegend, USA), and IL-22, and indole-3-acetic acids (IAA) (Abcam, USA) measured according to each manufacturer’s instruction.
Histopathological examination
After euthanizing the diabetic group, the samples of liver were fixed with 10% formalin solution (Sigma-Aldrich, USA), embedded in paraffin, sectioned in a diameter of 5 μm by a microtome (Leica Biosystems, Germany) and stained with the hematoxylin and eosin (H&E) (Sigma-Aldrich, USA). The area of lipid droplets was quantified by ImageJ software (NIH, USA).Citation71
Real-time qPCR analysis
The total RNA was extracted from the tissues of the liver, ileum, and pancreas following the protocol described for the TRIzol reagent (Invitrogen, USA). The cDNA synthesis was performed using a cDNA synthesis kit (TOYOBO, Japan) and the iQTM SYBRⓇ Green Supermix master kit (Bio-Rad, USA), and assayed on a Bio-Rad CFX (Bio-Rad, USA). The expression levels of mRNA related to the insulin signaling, gluconeogenesis, inflammatory cytokines, adipogenesis, β- oxidation, tight junction proteins, and IL-22 signaling were measured from the tissues of the liver, ileum, and pancreas as the primers (Table S1). The RT-PCR cycling conditions were as follows: one cycle at 94°C for 10 min, then denaturation at 95°C for 15 s, annealing at 52–62°C depending on the primers used for 40 cycles, and elongation and fluorescence data collection at 60°C for 2 s as previously described.Citation72
16 S rRNA gene amplicon sequencing and analysis
The bacterial genomic DNA was extracted from the cecum, and feces in the colon of the DB group by using a QiAamp PowerFecal Pro DNA kit (Qiagen, USA).Citation73 The V3-V4 region of the 16S rRNA gene was amplified by following the manufacturer’s instructions.Citation74 The raw sequences were preprocessed and quality-controlled using QIIME 2 with default parameters of the Illumina MiSeq System.Citation75
GC-MS analysis of SCFAs
The short-chain fatty acids (SCFAs) contents of the feces in the colon were measured by modifying a previous method.Citation75 Briefly, about 100 mg of feces was dispensed in 1 mL of distilled water containing an internal standard of 2,2-dimethylbutyric acid (Sigma-Aldrich, USA) and homogenized by a Vortex mixer. The homogenate was centrifuged at 12,000 rpm for 10 min at 4°C and a portion of the supernatant (1 μL) was injected into the GC-MS (7890B GC, Agilent, USA) equipped with an analytical capillary column (thickness 0.25 um × dia. 0.25 mm.× length 30 m) (Supelco, USA).
Statistical analysis
All the data were analyzed using a statistical package (SPSS PASW Statistics 18, IBM Co., Hong Kong). All data were presented as the mean ± S.D. The biochemical parameters, and gene expression data, and the results from animal histological studies were analyzed by a Student’s t- test or Duncan’s multiple comparisons test after analysis of variance (one-way ANOVA). The levels of the significant differences (α >0.5) of the mean were evaluated at *p < .05, ** p < .01, *** p < .0001 WT vs DB, #p < .05, ## p < .01, ### p < 0.0001 DB vs DB-fed anti-diabetic medicines and CKD1.
Author contribution
WJK, CHS, and CSH conceived and designed the experiments; WJK, YKC, and KHK performed the experiments; WJK, BJK, and CWL analyzed the data; TYK and GEH contributed data or analysis tools; WJK, SYP, MHK, and CSH wrote the paper; SYP, HBK, MHK, and CSH reviewed and edited the paper.
Supplemental Material
Download Zip (682.8 KB)Disclosure statement
No potential conflict of interest was reported by the author(s).
Data availability statement
The 16s rRNA sequencing data for CKD1(SUB12927731) was registered in the NCBI sequence Read Archive (SRA) database.
Supplementary material
Supplemental data for this article can be accessed online at https://doi.org/10.1080/19490976.2024.2319889
Additional information
Funding
References
- Sun X, Yu W, Hu C. Genetics of type 2 diabetes: insights into the pathogenesis and its clinical application. Biomed Res Int. 2014;2014:926713. doi:10.1155/2014/926713.
- Zheng Y, Ley SH, Hu FB. Global aetiology and epidemiology of type 2 diabetes mellitus and its complications. Nat Rev Endocrinol. 2018;14(2):88–26. doi:10.1038/nrendo.2017.151.
- Edward Michieka O, Benjamin Moranga O. The rise of noncommunicable diseases in Kenya: an examination of the time trends and contribution of the changes in diet and physical inactivity. J Epidemiol Glob Health. 2018;8(1–2):1–7. doi:10.2991/j.jegh.2017.11.004.
- Saeedi P, Petersohn I, Salpea P, Malanda B, Karuranga S, Unwin N, Colagiuri S, Guariguata L, Motala AA, Ogurtsova K. et al. Global and regional diabetes prevalence estimates for 2019 and projections for 2030 and 2045: results from the international diabetes federation diabetes atlas, 9(th) edition. Diabetes Res Clin Pract. 2019;157:107843. doi:10.1016/j.diabres.2019.107843.
- Thrasher J. Pharmacologic management of type 2 diabetes mellitus: available therapies. Am J Med. 2017;130(6):S4–S17. doi:10.1016/j.amjmed.2017.04.004.
- Whang A, Nagpal R, Yadav H. Bi-directional drug-microbiome interactions of anti-diabetics. EBioMedicine. 2019;39:591–602. doi:10.1016/j.ebiom.2018.11.046
- Horii T, Iwasawa M, Kabeya Y, Atuda K. Polypharmacy and oral antidiabetic treatment for type 2 diabetes characterised by drug class and patient characteristics: a Japanese database analysis. Sci Rep. 2019;9(1):12992. doi:10.1038/s41598-019-49424-2.
- Wu H, Esteve E, Tremaroli V, Khan MT, Caesar R, Mannerås-Holm L, Ståhlman M, Olsson LM, Serino M, Planas-Fèlix M. et al. Metformin alters the gut microbiome of individuals with treatment-naive type 2 diabetes, contributing to the therapeutic effects of the drug. Nat Med. 2017;23(7):850–858. doi:10.1038/nm.4345.
- Liao X, Song L, Zeng B, Liu B, Qiu Y, Qu H, Zheng Y, Long M, Zhou H, Wang Y. et al. Alteration of gut microbiota induced by DPP-4i treatment improves glucose homeostasis. EBioMedicine. 2019;44:665–674. doi:10.1016/j.ebiom.2019.03.057.
- Chan CW, Yu C-L, Lin J-C, Hsieh Y-C, Lin C-C, Hung C-Y, Li C-H, Liao Y-C, Lo C-P, Huang J-L. et al. Glitazones and alpha-glucosidase inhibitors as the second-line oral anti-diabetic agents added to metformin reduce cardiovascular risk in type 2 diabetes patients: a nationwide cohort observational study. Cardiovasc Diabetol. 2018;17(1):20. doi:10.1186/s12933-018-0663-6.
- Tomas J, Mulet C, Saffarian A, Cavin J-B, Ducroc R, Regnault B, Kun Tan C, Duszka K, Burcelin R, Wahli W. et al. High-fat diet modifies the PPAR-γ pathway leading to disruption of microbial and physiological ecosystem in murine small intestine. Proc Natl Acad Sci USA. 2016;113(40):E5934–e5943. doi:10.1073/pnas.1612559113.
- Xavier-Santos D, Bedani R, Lima ED, Saad SMI. Impact of probiotics and prebiotics targeting metabolic syndrome. J Funct Foods. 2020;64:103666. doi:10.1016/j.jff.2019.103666
- Mazziotta C, Tognon M, Martini F, Torreggiani E, Rotondo JC. Probiotics mechanism of action on immune cells and beneficial effects on human health. Cells. 2023;12(1):184. doi:10.3390/cells12010184.
- Ejtahed HS, Mohtadi-Nia J, Homayouni-Rad A, Niafar M, Asghari-Jafarabadi M, Mofid V, Akbarian-Moghari A. Effect of probiotic yogurt containing Lactobacillus acidophilus and Bifidobacterium lactis on lipid profile in individuals with type 2 diabetes mellitus. J Dairy Sci. 2011;94(7):3288–3294. doi:10.3168/jds.2010-4128.
- Qian X, Si Q, Lin G, Zhu M, Lu J, Zhang H, Wang G, Chen W. Bifidobacterium adolescentis is effective in relieving type 2 diabetes and May Be related to its dominant core genome and gut microbiota modulation capacity. Nutrients. 2022;14(12):2479. doi:10.3390/nu14122479.
- Yan F, Li N, Shi J, Li H, Yue Y, Jiao W, Wang N, Song Y, Huo G, Li B. et al. Lactobacillus acidophilus alleviates type 2 diabetes by regulating hepatic glucose, lipid metabolism and gut microbiota in mice. Food Funct. 2019;10(9):5804–5815. doi:10.1039/C9FO01062A.
- Abenavoli L, Scarlata GGM, Scarpellini E, Boccuto L, Spagnuolo R, Tilocca B, Roncada P, Luzza F. Metabolic- Dysfunction-Associated Fatty liver disease and gut microbiota: from Fatty liver to dysmetabolic syndrome. Med (Kaunas). 2023;59(3):594. doi:10.3390/medicina59030594.
- Yan X, Feng B, Li P, Tang Z, Wang L. Microflora disturbance during progression of glucose intolerance and effect of Sitagliptin: an animal study. J Diabetes Res. 2016;2016:2093171. doi:10.1155/2016/2093171.
- Zhao L, Chen Y, Xia F, Abudukerimu B, Zhang W, Guo Y, Wang N, Lu Y. A glucagon-like peptide-1 receptor agonist lowers weight by modulating the structure of gut microbiota. Front Endocrinol. 2018;9. doi:10.3389/fendo.2018.00233.
- Pryor R, Martinez-Martinez D, Quintaneiro L, Cabreiro F. The role of the microbiome in drug response. Annu Rev Pharmacol Toxicol. 2020;60(1):417–435. doi:10.1146/annurev-pharmtox-010919-023612.
- Wang D, Liu J, Zhong L, Ding L, Zhang Q, Yu M, Li M, Xiao X. Potential benefits of metformin and pioglitazone combination therapy via gut microbiota and metabolites in high-fat diet-fed mice. Front Pharmacol. 2022;13:1004617. doi:10.3389/fphar.2022.1004617.
- Koh A, Mannerås-Holm L, Yunn N-O, Nilsson PM, Ryu SH, Molinaro A, Perkins R, Smith JG, Bäckhed F. Microbial imidazole propionate affects responses to metformin through p38γ-dependent inhibitory AMPK phosphorylation. Cell Metab. 2020;32(4):643–653.e644. doi:10.1016/j.cmet.2020.07.012.
- Sato J, Kanazawa A, Azuma K, Ikeda F, Goto H, Komiya K, Kanno R, Tamura Y, Asahara T, Takahashi T. et al. Probiotic reduces bacterial translocation in type 2 diabetes mellitus: a randomised controlled study. Sci Rep. 2017;7(1):12115. doi:10.1038/s41598-017-12535-9.
- Kocsis T, Molnár B, Németh D, Hegyi P, Szakács Z, Bálint A, Garami A, Soós A, Márta K, Solymár M. et al. Probiotics have beneficial metabolic effects in patients with type 2 diabetes mellitus: a meta- analysis of randomized clinical trials. Sci Rep. 2020;10(1):11787. doi:10.1038/s41598-020-68440-1.
- Zhang Y, Gu Y, Ren H, Wang S, Zhong H, Zhao X, Ma J, Gu X, Xue Y, Huang S. et al. Gut microbiome-related effects of berberine and probiotics on type 2 diabetes (the PREMOTE study). Nat Commun. 2020;11(1):5015. doi:10.1038/s41467-020-18414-8.
- Gai Z, Liao W, Huang Y, Dong Y, Feng H, Han M. Effects of bifidobacterium BL21 and lacticaseibacillus LRa05 on gut microbiota in type 2 diabetes mellitus mice. AMB Express. 2023;13(1):97. doi:10.1186/s13568-023-01603-1.
- Ferreira JP, Rossignol P, Bakris G, Mehta C, White WB, Zannad F. Body weight changes in patients with type 2 diabetes and a recent acute coronary syndrome: an analysis from the EXAMINE trial. Cardiovasc Diabetol. 2021;20(1):187. doi:10.1186/s12933-021-01382-8.
- Choi H-M, Kim HR, Kim E-K, Byun YS, Won Y-S, Yoon W-K, Kim H-C, Kang J-G, Nam K-H. An age-dependent alteration of the respiratory exchange ratio in the db/db mouse. Lar. 2015;31(1):1–6. doi:10.5625/lar.2015.31.1.1.
- Ko KY, Wu YW, Liu CW, Cheng MF, Yen RF, Yang WS. Longitudinal evaluation of myocardial glucose metabolism and contractile function in obese type 2 diabetic db/db mice using small-animal dynamic (18)F-FDG PET and echocardiography. Oncotarget. 2017;8(50):87795–87808. doi:10.18632/oncotarget.21202.
- Suriano F, Vieira-Silva S, Falony G, Roumain M, Paquot A, Pelicaen R, Régnier M, Delzenne NM, Raes J, Muccioli GG. et al. Novel insights into the genetically obese (ob/ob) and diabetic (db/db) mice: two sides of the same coin. Microbiome. 2021;9(1):147. doi:10.1186/s40168-021-01097-8.
- Utzschneider KM, Kahn SE. The role of Insulin Resistance in nonalcoholic fatty liver disease. J Clin Endocrinol Metab. 2006;91(12):4753–4761. doi:10.1210/jc.2006-0587.
- Tilg H, Moschen AR. Inflammatory mechanisms in the regulation of insulin resistance. Mol Med. 2008;14(3–4):222–231. doi:10.2119/2007-00119.Tilg.
- Rehman K, Akash MSH. Mechanisms of inflammatory responses and development of insulin resistance: how are they interlinked? J Biomed Sci. 2016;23(1):87. doi:10.1186/s12929-016-0303-y.
- Kitade H, Chen G, Ni Y, Ota T. Nonalcoholic fatty liver disease and insulin resistance: new insights and potential new treatments. Nutrients. 2017;9(4):387. doi:10.3390/nu9040387.
- Sargent J. IL-22 and metabolic disease. Nat Rev Endocrinol. 2014;10(11):639–639. doi:10.1038/nrendo.2014.148.
- Wang X, Ota N, Manzanillo P, Kates L, Zavala-Solorio J, Eidenschenk C, Zhang J, Lesch J, Lee WP, Ross J. et al. Interleukin-22 alleviates metabolic disorders and restores mucosal immunity in diabetes. Nature. 2014;514(7521):237–241. doi:10.1038/nature13564.
- Chen H, Sun L, Feng L, Yin Y, Zhang W. Role of innate lymphoid cells in obesity and insulin resistance. Front Endocrinol. 2022;13. doi:10.3389/fendo.2022.855197.
- Kalyesubula M, Mopuri R, Rosov A, Alon T, Edery N, Moallem U, Dvir H. Hyperglycemia-stimulating diet induces liver steatosis in sheep. Sci Rep. 2020;10(1):12189. doi:10.1038/s41598-020-68909-z.
- Thaiss CA, Levy M, Grosheva I, Zheng D, Soffer E, Blacher E, Braverman S, Tengeler AC, Barak O, Elazar M. et al. Hyperglycemia drives intestinal barrier dysfunction and risk for enteric infection. Science. 2018;359(6382):1376–1383. doi:10.1126/science.aar3318.
- Tanase DM, Gosav EM, Costea CF, Ciocoiu M, Lacatusu CM, Maranduca MA, Ouatu A, Floria M. The intricate relationship between type 2 diabetes mellitus (T2DM), insulin resistance (IR), and nonalcoholic fatty liver disease (NAFLD). J Diabetes Res. 2020;2020:3920196. doi:10.1155/2020/3920196.
- Sharma BR, Jaiswal S, Ravindra PV. Modulation of gut microbiota by bioactive compounds for prevention and management of type 2 diabetes. Biomed Pharmacother. 2022;152:113148. doi:10.1016/j.biopha.2022.113148
- Jayashree B, Bibin YS, Prabhu D, Shanthirani CS, Gokulakrishnan K, Lakshmi BS, Mohan V, Balasubramanyam M. Increased circulatory levels of lipopolysaccharide (LPS) and zonulin signify novel biomarkers of proinflammation in patients with type 2 diabetes. Mol Cell Biochem. 2014;388(1–2):203–210. doi:10.1007/s11010-013-1911-4.
- Sakura T, Morioka T, Shioi A, Kakutani Y, Miki Y, Yamazaki Y, Motoyama K, Mori K, Fukumoto S, Shoji T. et al. Lipopolysaccharide-binding protein is associated with arterial stiffness in patients with type 2 diabetes: a cross-sectional study. Cardiovasc Diabetol. 2017;16(1):62. doi:10.1186/s12933-017-0545-3.
- Khondkaryan L, Margaryan S, Poghosyan D, Manukyan G. Impaired inflammatory response to LPS in type 2 diabetes mellitus. Int J Inflam. 2018;2018:2157434. doi:10.1155/2018/2157434.
- Armandi A, Rosso C, Caviglia GP, Bugianesi E. Insulin resistance across the spectrum of nonalcoholic fatty liver disease. Metabolites. 2021;11(3):155. doi:10.3390/metabo11030155.
- Muzurović E, Mikhailidis DP, Mantzoros C. Non-alcoholic fatty liver disease, insulin resistance, metabolic syndrome and their association with vascular risk. Metabolism. 2021;119:154770. doi:10.1016/j.metabol.2021.154770.
- Gallwitz B. Review of sitagliptin phosphate: a novel treatment for type 2 diabetes. Vasc Health Risk Manag. 2007;3(2):203–210. doi:10.2147/vhrm.2007.3.2.203.
- Rena G, Hardie DG, Pearson ER. The mechanisms of action of metformin. Diabetologia. 2017;60(9):1577–1585. doi:10.1007/s00125-017-4342-z.
- Shen J, Fang Y, Zhu H, Ge W. Plasma interleukin-22 levels are associated with prediabetes and type 2 diabetes in the Han Chinese population. J Diabetes Investig. 2018;9(1):33–38. doi:10.1111/jdi.12640.
- Hendrikx T, Schnabl B. Indoles: metabolites produced by intestinal bacteria capable of controlling liver disease manifestation. J Intern Med. 2019;286(1):32–40. doi:10.1111/joim.12892.
- Gong F, Wu J, Zhou P, Zhang M, Liu J, Liu Y, Lu X, Liu Z. Interleukin-22 might act as a double-edged sword in type 2 diabetes and coronary artery disease. Mediators Inflamm. 2016;2016:8254797. doi:10.1155/2016/8254797.
- Zai W, Chen W, Liu H, Ju D. Therapeutic opportunities of IL-22 in Non-Alcoholic Fatty liver disease: from molecular mechanisms to clinical applications. Biomedicines. 2021;9(12):1912. doi:10.3390/biomedicines9121912.
- Chen W, Zai W, Fan J, Zhang X, Zeng X, Luan J, Wang Y, Shen Y, Wang Z, Dai S. et al. Interleukin-22 drives a metabolic adaptive reprogramming to maintain mitochondrial fitness and treat liver injury. Theranostics. 2020;10(13):5879–5894. doi:10.7150/thno.43894.
- Abadpour S, Halvorsen B, Sahraoui A, Korsgren O, Aukrust P, Scholz H. Interleukin-22 reverses human islet dysfunction and apoptosis triggered by hyperglycemia and LIGHT. J Mol Endocrinol. 2018;60(3):171–183. doi:10.1530/jme-17-0182.
- Ma Q, Luan J, Bai Y, Xu C, Liu F, Chen B, Ju D, Xu H. Interleukin-22 in renal protection and its pathological role in kidney diseases. Front Immunol. 2022;13:851818. doi:10.3389/fimmu.2022.851818.
- Gulhane M, Murray L, Lourie R, Tong H, Sheng YH, Wang R, Kang A, Schreiber V, Wong KY, Magor G. et al. High fat diets induce colonic epithelial cell stress and inflammation that is reversed by IL- 22. Sci Rep. 2016;6(1):28990. doi:10.1038/srep28990.
- Yang W, Yu T, Huang X, Bilotta AJ, Xu L, Lu Y, Sun J, Pan F, Zhou J, Zhang W. et al. Intestinal microbiota-derived short-chain fatty acids regulation of immune cell IL-22 production and gut immunity. Nat Commun. 2020;11(1):4457. doi:10.1038/s41467-020-18262-6.
- Cunningham AL, Stephens JW, Harris DA. Intestinal microbiota and their metabolic contribution to type 2 diabetes and obesity. J Diabetes Metab Disord. 2021;20(2):1855–1870. doi:10.1007/s40200-021-00858-4.
- Tang R, Li L. Modulation of short-chain fatty acids as potential therapy method for type 2 diabetes mellitus. Can J Infect Dis Med Microbiol. 2021;2021:6632266. doi:10.1155/2021/9756586.
- Chun E, Lavoie S, Fonseca-Pereira D, Bae S, Michaud M, Hoveyda HR, Fraser GL, Gallini Comeau CA, Glickman JN, Fuller MH. et al. Metabolite-sensing receptor Ffar2 regulates colonic group 3 Innate Lymphoid Cells and gut immunity. Immunity. 2019;51(5):871–884.e876. doi:10.1016/j.immuni.2019.09.014.
- Sivaprakasam S, Prasad PD, Singh N. Benefits of short-chain fatty acids and their receptors in inflammation and carcinogenesis. Pharmacol Ther. 2016;164:144–151. doi:10.1016/j.pharmthera.2016.04.007.
- Zenewicz LA, Yin X, Wang G, Elinav E, Hao L, Zhao L, Flavell RA. IL-22 Deficiency Alters Colonic Microbiota To Be Transmissible and Colitogenic. J Immunol. 2013;190(10):5306–5312. doi:10.4049/jimmunol.1300016.
- Peralta G, Sánchez MB, Roiz MP, Garrido JC, Teira R, Mateos F. Diabetes does not affect outcome in patients with Enterobacteriaceae bacteremia. BMC Infect Dis. 2009;9(1):94. doi:10.1186/1471-2334-9-94.
- Chen YR, Jing QL, Chen FL, Zheng H, Chen LD, Yang ZC. Desulfovibrio is not always associated with adverse health effects in the Guangdong gut microbiome project. PeerJ. 2021;9:e12033. doi:10.7717/peerj.12033
- Kaur H, Bose C, Mande SS. Tryptophan metabolism by gut microbiome and gut-Brain-Axis: an in silico analysis. Front Neurosci. 2019;13. doi:10.3389/fnins.2019.01365.
- Almugadam BS, Ibrahim MK, Liu Y, Chen SM, Wang CH, Shao CY, Ren BW, Tang L. Association of urogenital and intestinal parasitic infections with type 2 diabetes individuals: a comparative study. BMC Infect Dis. 2021;21(1):20. doi:10.1186/s12879-020-05629-9.
- Yoshida M, Funasaka Y, Saeki H, Yamamoto M, Kanda N. Dietary Fiber Inulin Improves Murine Imiquimod- Induced Psoriasis-like Dermatitis. Int J Mol Sci. 2023;24(18):14197. https://www.mdpi.com/1422-0067/24/18/14197.
- Su X, Zhang M, Qi H, Gao Y, Yang Y, Yun H, Zhang Q, Yang X, Zhang Y, He J. et al. Gut microbiota–derived metabolite 3-idoleacetic acid together with LPS induces IL-35+ B cell generation. Microbiome. 2022;10(1):13. doi:10.1186/s40168-021-01205-8.
- Dupraz L, Magniez A, Rolhion N, Richard ML, Da Costa G, Touch S, Mayeur C, Planchais J, Agus A, Danne C. et al. Gut microbiota-derived short-chain fatty acids regulate IL-17 production by mouse and human intestinal γδ T cells. Cell Rep. 2021;36(1):109332. doi:10.1016/j.celrep.2021.109332.
- WJ RR K, Doo EH, Choi YK, Kim KH, Kim BK, Kim BK, Kim H, Kim M, Huh CS. Supplementation with the probiotic strains Bifidobacterium longum and lactiplantibacillus rhamnosus alleviates glucose intolerance by restoring the IL-22 response and pancreatic beta cell dysfunction in type 2 diabetic mice. Probiotics Antimicrob Proteins. 2023. doi:10.1007/s12602-023-10156-5.
- Song I, Patel O, Himpe E, Muller CJ, Bouwens L, Rooman I. Beta cell Mass restoration in alloxan-diabetic mice treated with EGF and Gastrin. PLoS One. 2015;10(10):e0140148. doi:10.1371/journal.pone.0140148.
- Kwon EY, Kim SY, Choi MS. Luteolin-enriched artichoke leaf extract alleviates the metabolic syndrome in mice with high-fat diet-induced obesity. Nutrients. 2018;10(8):979. doi:10.3390/nu10080979.
- Yao B, Dong T, Fu A, Li H, Jiang C, Li N, Cai S. Quantification and characterization of mouse and human tissue- resident microbiota by qPCR and 16S sequencing. STAR Protoc. 2022;3(4):101765. doi:10.1016/j.xpro.2022.101765.
- Illumina. 16S Metagenomic Sequencing Library Preparation_Preparing 16S ribosomal RNA gene amplicons for the Illumina MiSeq system. https://support.illumina.com/documents/documentation/chemistry_documentation/16s/16s-metagenomic-library-prep-guide-15044223-b.pdf.
- Wang H, Song W, Wu Q, Gao X, Li J, Tan C, Zhou H, Zhu J, He Y, Yin J. et al. Fecal transplantation from db/db mice treated with sodium butyrate attenuates ischemic stroke injury. Microbiol Spectr. 2021;9(2):e0004221. doi:10.1128/Spectrum.00042-21.