
ABSTRACT
Ulcerative colitis (UC) is a challenging form of inflammatory bowel disease, and its etiology is intricately linked to disturbances in the gut microbiome. To identify the potential alleviators of UC, we employed an integrative analysis combining microbial community modeling with advanced machine learning techniques. Using metagenomics data sourced from the Integrated Human Microbiome Project, we constructed individualized microbiome community models for each participant. Our analysis highlighted a significant decline in both α and β-diversity of strain-level microbial populations in UC subjects compared to controls. Distinct differences were also observed in the predicted fecal metabolite profiles and strain-to-metabolite contributions between the two groups. Using tree-based machine learning models, we successfully identified specific microbial strains and their associated metabolites as potential alleviators of UC. Notably, our experimental validation using a dextran sulfate sodium-induced UC mouse model demonstrated that the administration of Parabacteroides merdae ATCC 43,184 and N-acetyl-D-mannosamine provided notable relief from colitis symptoms. In summary, our study underscores the potential of an integrative approach to identify novel therapeutic avenues for UC, paving the way for future targeted interventions.
1. Introduction
With an ongoing shift toward Western lifestyles and dietary habits, the global incidence of inflammatory bowel disease (IBD) is on the rise.Citation1 IBD, characterized by recurring gastrointestinal disturbances, is influenced by several factors, including diet, gut microbiota composition, geographical location, and genetic predispositions.Citation2 Ulcerative colitis (UC), a primary subtype of IBD, predominantly affects the colon and rectum. This condition leads to damage to the mucosal layer of the bowel wall in patients with sporadic abdominal discomfort and bloody diarrhea, severely affecting their daily lives.Citation3 Although certain gut microbes and their metabolic by-products play pivotal roles in UC pathogenesis, the exact causative agents and mechanisms remain elusive.Citation4 The presentation of UC varies among individuals in terms of both pathological features and symptom severity. The identification of reliable, noninvasive biomarkers, possibly from fecal samples, could revolutionize early UC detection, potentially reducing treatment costs and duration.Citation5,Citation6 Numerous studies have attempted to correlate specific microbial taxa with metabolites in patients with UC using genomic and metabolomic analyses.Citation7,Citation8 However, given the complexity of the metabolome and vast array of small-molecule metabolites, current analytical platforms often fail to capture the complete metabolomic spectrum ,Citation9–11. This limitation hinders rapid identification of potential UC biomarkers by linking gut metabolites and microbes. Moreover, many researchers usually mapped metagenomic sequencing data of gut microbiota onto metabolic networks using Kyoto Encyclopedia of Genes and Genomes for functional annotation,Citation12,Citation13 aiming to infer the metabolic profile of the host. In practice, however, this approach typically infers the metabolic functions of the gut microbiota as a whole, making it challenging to accurately identify the contribution of each microbial strain to each metabolite, and failing to elucidate possible interactions between reactions. Thus, a method that can systematically characterize the contribution of each microbial strain to each metabolite at the overall gut microbial level is urgently needed, which helps explain the physiological changes in patients with UC in more detail at the level of species composition and function.
The constraint-based reconstruction and analysis (COBRA) methodology offers a promising avenue for decoding the genotype-phenotype-environment triad.Citation14 Utilizing genome-scale metabolic models (GSMMs), COBRA allows for in-depth microbial community analyses. GSMMs are mathematical models constructed in a bottom-up manner based on the genome annotation and experimental information of the target organism, which can be computationally assessed for their phenotypic properties.Citation15 Thus, it serves as the basis for constructing models under specific constraints. The microbiome community model is constructed based on interested constraints using the COBRA method on the basis of GSMMs. Yet, the quality of GSMMs constructed via different approaches varies greatly. Numerous studies are working to improve the quality of GSMMs, such as AGORA (assembly of gut organisms through reconstruction and analysis) framework which has paved the way for systematic gut microbe studies.Citation16 In brief, AGORA is a comprehensive resource of 773 GSMMs of prevalent gut microbes, enabling the prediction of metabolic potential and biochemical interactions among gut microbes. To date, several studies have successfully developed verifiable hypotheses regarding the microbial metabolic activities associated with IBD, such as revealing extensive changes in the gut microbiome of patients with dysbiosis,Citation17 assessing the metabolic capacity of secondary bile acids in the gut microbes,Citation18 and evaluating the efficacy of anti-tumor necrosis factor (TNF) therapy.Citation19 By utilizing a range of data types employed as model constraints, including metagenomics,Citation20 transcriptomics,Citation21 proteomics,Citation22 and dietary information,Citation23 the functional states of interest of reconstructed contextualized models can be analyzed computationally using off-the-shelf methods, such as flux balance analysis.Citation24 Hence, COBRA models can probe the influence of diet on the gut microbial metabolism and offer new insights into IBD pathogenesis.Citation25 The accuracy of microbiome community models for predicting metabolic profiles has also been demonstrated.Citation17,Citation26 However, interpreting data from these intricate metabolic network models remains challenging.
Machine learning (ML) has emerged as a powerful tool for dissecting high-throughput sequencing datasets and shows promise for differentiating IBD subtypes.Citation27,Citation28 When integrated with GSMMs, the complementary nature of the two methodologies becomes evident. On the one hand, the mechanistic insights derived from GSMMs, often referred to as fluxomic data, increase the feature dimensions of the ML model inputs to some extent. This integration enhances the mechanistic interpretation of ML outputs. On the other hand, ML techniques contribute to both the reconstruction and analysis of GSMMs, thereby improving the model quality.Citation29,Citation30 While previous studies have tapped into this synergy to unearth disease biomarkers ,Citation31,,Citation32,Citation33 its application to UC microbiome data is still in its infancy.
By leveraging the comprehensive dataset of Lloyd-Price et al.,Citation34 we endeavored to bridge this gap. As part of the Integrated Human Microbiome Project (iHMP), the cohort followed 132 subjects for one year, with metagenomic sequencing analysis of 1595 stool samples from 130 subjects and untargeted metabolomic assays of 546 samples from 106 subjects.Citation34 To identify highly dysbiotic samples from microbial metagenomics, a dysbiosis score was defined based on Bray-Curtis dissimilarities with the non-IBD control samples.Citation34 We screened 67 UC and 69 non-IBD control samples based on the defined dysbiosis scores. Using the COBRA methodology, we crafted microbiome community models for each sample to investigate the metabolite uptake and secretion potential. The corresponding strains that contributed each secreted metabolite were also calculated. Differences in the microbial community composition, metabolic profiles, and strain-level contributions to all secreted metabolites between UC and control samples were characterized. Then, we employed supervised ML techniques to refine our search using tree-based classifiers, which led to the identification of promising UC biomarkers. Finally, our validation studies centered on Parabacteroides merdae ATCC 43,184, and N-acetyl-D-mannosamine showed substantial anti-inflammatory properties in a dextran sulfate sodium (DSS)-induced UC mouse model. Our integrative approach, which combines GSMMs and ML, provides a holistic view of UC metabolic mechanisms, offering novel biomarkers that augment our understanding and initial screening capabilities.
2. Materials and methods
2.1. Metagenomic data sources and pre-processing
Paired-end Illumina raw sequencing reads were obtained from the Inflammatory Bowel Disease Multi-omics Database resource in the iHMP, and retrieved from the NCBI BioProject under accession number PRJNA398089. Based on the previously defined dysbiosis score (DS),Citation34 the dysbiotic subset was defined as being outside the 90th percentile of the healthy group; a cohort of 70 UC samples with DS > 0.8, and 69 non-IBD controls with DS < 0.7 were selected to capture the most notable differences between the two groups. Paired-end Illumina sequences were pre-processed using TrimmomaticCitation35 to trim low-quality read bases. The remaining reads were mapped to the human genome version 38 using Burrows-Wheeler Alignment tool (BWA)Citation36 to remove human contaminant sequences. Next, the clean reads obtained were mapped onto the reference set of 773 AGORA genomes using default BWA parameters.Citation36 The AGORA reference genome was constructed as previously described.Citation37 Microbiome models with fewer than 20 strains after mapping to the AGORA reference genomes were not included in subsequent analyses.Citation18 This was observed for three samples from the UC group: SRR5950762, SRR5947056, and SRR5950615. SamtoolsCitation38 (MAPQ: 1) was used to filter cross-mapped reads. Finally, the R package “Rsamtools” v2.14.0 was used to calculate the abundance table of the microbial community for each sample. The genome coverage threshold was set to 1% to reduce false positives, that is, microbes with < 1% genome coverage for each individual were excluded. The resulting coverage was regularized to obtain the relative microbial abundances.
2.2. Construction of personalized microbiome community models
The mgPipe module in the COBRA ToolboxCitation14 extension Microbiome Modelling Toolbox 2.0Citation39 was used to construct 136 personalized microbiome community models that integrated the relative abundances (obtained from metagenomic data) with constraint-based modeling. Briefly, AGORACitation16 v1.03 reconstructions, retrieved from http://vmh.life,Citation23 served as model-building resources. First, the ‘buildModelStorage’ function within the mgPipe module was employed to construct a comprehensive constraint-based microbiome community reconstruction that encompassed all the strains identified in at least one metagenomic sample. To save computational time, coupling constraints were added to each model for subsequent microbiome community modeling in mgPipe and exchange reactions that could not convert the given diet into fluxes. Subsequently, the ‘createPersonalizedModel’ function created personalized models from combination of all microbe abundances into the previously built global setup. Each personalized model was built based on a community biomass reaction consisting of all mapped strains, and strain-level abundances were used as coefficients. These constraints allowed all the strains to grow at experimentally determined rates. Coupling constraints were also added for each organism, and 136 personalized microbiome community models were generated. Finally, following the mgPipe process, we used the default EU average diet from the Virtual Metabolic Human (VMH) databaseCitation23 as exceptional constraints. The ‘adaptVMHDietToAGORA’ function adapted AGORA strains to grow appropriately under the given diet. And the function ‘microbiotaModelSimulator’ in mgPipe and fastFVACitation40 were used to calculate the maximum and minimum fluxes for all available exchange reactions in 136 microbiome community models. Furthermore, to mimic a state of microbe transportation that closely resembles reality, we established a range of 0.4 to 1 mmol/person/day as the allowable flux through the community biomass reaction.Citation18
We conducted an analysis of interest using the startMgPipe.m script. The absolute presence and total abundance of reactions were obtained by executing the ‘fastCalculateReactionAbundance’ function in the Microbiome Modelling Toolbox.Citation20 The ‘calculateSubsystemAbundance’ function then quantified abundances of all subsystems in the 136 microbiomes, after summarizing abundances for the corresponding reactions. And ‘predictMicrobeContributions’ function was employed to compute the individual strain’s contribution to each metabolite. All personalized microbiome community models were constructed and simulated using the COBRA ToolboxCitation14 and Microbiome Modelling ToolboxCitation20,Citation39 in MATLAB version R2019a (Mathworks, Inc.). Simultaneously, the IBM CPLEX solver (IBM, Inc.) and a Parallel Computing Toolbox were used to save time and cost.
2.3. Feature selection method
To identify the strains and metabolites that best stratified samples with UC from non-IBD controls, we employed an ensemble of tree-based machine learning models to screen for important features. In particular, Random Forest (RF), Gradient Boosted Regression Trees (GBRT), eXtreme Gradient Boosting (XGB), eXtreme Gradient Boosting Random Forest (XGBRF), and a Light Gradient Boosting Machine (LGB) were used to score the importance of all features separately and filter out features with scores greater than 0. The features shared by these five classifiers were used as potential biomarkers of UC. Finally, we evaluated the predictive performance of the selected features using 10 times 5-fold cross-validation with accuracy (ACC) and the area under the Receiver Operating Characteristic curve (AUC) score as assessment indicators. The effects of the most predictive strains and metabolites on the total predicted outcome were assessed separately based on SHapley Additive explanations (SHAP) and ranked in descending order of importance.
2.4. Experimental design of DSS-induced ulcerative colitis
Forty SPF-grade male C57BL/6J mice, aged 5 weeks and weighing 19–21 grams, were obtained from Vital River Laboratory Animal Technology Co., Ltd., Beijing, China. These mice were housed in a controlled environment maintained at 23 ± 2°C with a relative humidity of 60 ± 20% and subjected to a 12-hour light/dark cycle. Every four mouse were placed in an individually ventilated cage and provided unrestricted access to normal chow and sterile water ad libitum. After 1-week of acclimatization, the experimental mice were randomly assigned to one of five groups: the control group, DSS group, Parabacteroides merdae ATCC 43,184 (P. merdae) group, N-acetyl-D-mannosamine (ManNAc) group, or salazosulfapyridine (SASP) group, with eight mice in each group. The control group had unrestricted access to sterile water for 14 days. In contrast, the mice in the remaining four treatment groups had access to sterile water for the initial 7 days and were subsequently provided with water containing 3% (wt/vol) DSS (36–50 kDa, MP Biomedicals Ltd., Santa Ana, USA) from the 8th day onward to induce the development of a UC model. Starting from day 1 and continuing until day 14, the control, DSS, P. merdae, ManNAc, and SASP groups were orally administrations of phosphate-buffered saline (PBS), P. merdae (1 × 10Citation9 c. f. u. mL−1), ManNAc (200 mg/kg), and SASP (200 mg/kg), respectively. Animal experiment and related protocols were approved by the Jiangnan University Animal Studies Committee, Wuxi, China (JN.No20230615c0800820[289]).
2.5. Parabacteroides merdae culture
The P. merdae (ATCC 43,184) used in this study was obtained from the BeNa Culture Collection (BNCC, China) and activated according to the manufacturer’s instructions. P. merdae was grown anaerobically in YCFA medium (Supplementary Table S1) at 37°C for 24 h. The cell pellets prepared by centrifuging at 8,000 × g for 10 min at 4°C was adjusted to the final cell density of 1 × 10Citation9 c. f. u. mL−1 using the oxygen-free PBS for subsequent animal experiments.
2.6. Physiological indexes
Daily weight measurements were performed throughout the experiment to assess physical well-being. Fecal consistency and fecal occult blood were additionally recorded during UC modeling, in which fecal occult blood was measured using the Pyramidon method (BaSO, Zhuhai, China). Disease Activity Index (DAI) scores were based on the scoring criteria of a previous study.Citation41 Upon completion of the experiment, the mice were anesthetized using isoflurane, and various tissues, including the spleen, cecum, and colon, were collected from all mice. In addition, the colon tissue of each mouse was isolated for length measurements, and the spleen weight was measured. The spleen index was determined using the following formula: spleen index = spleen weight (mg)/body weight (g).Citation42
2.7. Determination of colonic inflammatory cytokines and tight junction
Total colonic protein was extracted from a random selection of six mice in each group using the following procedure: 50 mg of colon tissue was weighed and thoroughly lysed on ice with 500 µL of RIPA Lysis Buffer and 10 µL protease phosphatase inhibitor cocktail, followed by homogenization and centrifugation (3,500 g, 4°C for 15 min) to collect the supernatant for subsequent experiments. The total protein concentration was determined using a BCA Protein Assay Kit (Beyotime Biotechnology Ltd.). Enzyme-linked immunosorbent assay (ELISA) kits for Interleukin-1beta (IL-1β), interleukin-17 (IL-17), tumor necrosis factor-alpha (TNF-α), interferon gamma (IFN-γ), interleukin-6 (IL-6), and interleukin-10 (IL-10) were sourced from R&D Systems China Co., Ltd. (Shanghai, China). ELISA kits for Zonula occludens-1 (ZO-1), Occludin, and Claudin-1 were procured from Fcmacs Biotech Co., Ltd. (Nanjing, China). All inflammatory cytokines and tight junctions were measured according to manufacturer’s instructions.
2.8. Histology assessment and mucous layer analyses
At the end of the experiment, a randomly chosen 1-cm segment of the distal colon from six mice in each group was placed in 10% Carnot’s fixative for subsequent Hematoxylin and Eosin (H&E) and Alcian blue-periodic acid-Schiff (AB-PAS) staining. The following steps of Dehydration, paraffin embedding, sectioning, and staining were performed by Servicebio Technology Co., Ltd. (Wuhan, China). In addition, histopathological scores, intestinal wall thickness, mucin-containing goblet cells, and mucous production were further measured with reference to the methodology of previous studies,Citation41,Citation43 based on a light microscope (Nikon Corporation, Japan) and ImageJ v2.14.0 analysis software.
2.9. Determination of SCFAs
The SCFAs (acetate, propionate, butyrate, isobutyrate, valerate, and isovalerate) concentrations in the cecal contents were quantified in six randomly selected mice from each group. Firstly, 20–50 mg of lyophilized cecal contents were weighted and added to 500 µL of saturated NaCl solution and homogenized until no visible lumps were present. Subsequently, the system was acidified by the addition of 200 μL of 10% sulfuric acid, followed by the extraction of SCFAs with the inclusion of 1 mL of ether. Finally, the SCFAs in the ether layer were isolated by centrifugation (14,000 rpm, 15 min), and the resulting supernatant was transferred to a centrifuge tube containing 0.25 g of anhydrous Na2SO4 to get rid any excess water. After centrifugation, the supernatant was transferred to a vial for subsequent analysis. Gas chromatography-mass spectrometry (GC-MS) analysis was conducted using a GCMS-QP2010 Ultra system (Shimadzu Corporation, Kyoto, Japan) equipped with an Rtx-Wax column (30 m × 0.25 μm, 0.25 μm) to separate and quantify the peak area of the six aforementioned SCFAs in the samples. The SCFAs concentrations were determined using the external standard method and reported as μmol/g of dry sample.
2.10. Statistical analysis and data visualization
The Wilcoxon rank sum test was conducted in MATLAB utilizing the ‘ranksum’ function. The resulting P-values were adjusted for the false-positive discovery rate (FDR) using the Benjamini-Hochberg method through the ‘mafdr’ function in MATLAB. Spearman correlations between net production fluxes and species abundances were computed in MATLAB through the dedicated ‘correlateFluxWithTaxonAbundance’ function within the Microbiome Modelling Toolbox. GraphPad Prism 8.0.2. was used to analyze one-way ANOVA and the Mann-Whitney U test. And the data of all groups was presented as means ± SEM. Statistical significance levels were defined as follows: + P < 0.1; * p < 0.05; ** p < 0.01; *** p < 0.001; and **** p < 0.0001. The contributions of the phyla to the subsystems were depicted using the online Circos toolCitation44 (http://circos.ca). All remaining data were graphically represented using MATLAB version R2019a (MathWorks, Inc.), R version 4.2.2, and Python version 3.7.13.
3. Results
3.1. Microbial modelling characterized differential metabolic profiles between UC samples and non-IBD controls
Individual subject characteristics and fecal samples are summarized (Supplementary Table S2). The pre-processed clean reads were then mapped to the AGORA reference genomes, accounting for 419 strains in 136 personalized microbial communities, and three microbiome models with less than 20 strains were removed (Methods). Among them, the relative abundance of 117 strains were significantly different between the UC and control microbiomes (Supplementary Table S5 and Supplementary FIgure S3). For instance, Faecalibacterium prausnitzii significantly decreased in UC microbiomes (p = 5.47 × 10⁻⁸), while that of Ruminococcus gnavus significantly increased (p = 1.40 × 10⁻⁵). On average, each in silico microbiota covered 151 of the 773 microbial strains, with the smallest containing only 31 strains and the largest containing 227 strains (Supplementary Fig. S1). Consistent with previous studies,Citation45,Citation46 the α-diversity of gut microbes was significantly decreased in samples with UC compared to that in controls (Supplementary Fig. S2a-c). In addition, differences in the microbiome between the UC and control groups were identified using principal coordinate analysis (PCoA) (Supplementary Fig. S2d, permutational multivariate analysis of variance (PERMANOVA) R2 = 0.113, p = 0.001). We further examined the effectiveness of microbial composition-based disease prediction using tree-based classifiers (Methods). The results showed that samples with UC could be well separated from controls based on microbial composition (AUC >0.95) (Supplementary Fig. S2g).
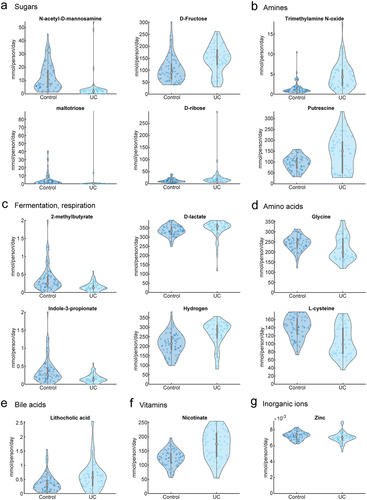
Next, we evaluated the metabolic capacity of 136 microbiomes. The minimum and maximum fluxes through all exchange reactions were calculated using fastFVA,Citation40 with calculations based on the community biomass reaction of each model (Methods). In total, exchange reactions for 420 metabolites were calculated, of which 180 metabolites were net secreted into the fecal compartment without absorption by at least one microbiome model, and 68 metabolites were both absorbed and secreted. In other words, the former is derived from microbes only, while the latter is derived from both microbes and diet.Citation17 We statistically analyzed the net uptake and secreted fluxes of 136 individual microbiomes (Supplementary Table S3 and S4). In the in silico simulations, we focused on metabolites that could be secreted into the fecal compartment, corresponding to metabolites that could be produced by intestinal microorganisms. Of the 248 metabolites secreted by at least one microbiome, 101 differed significantly between UC and non-IBD control samples (Supplementary Table S5). Decreased metabolite production in the microbiome of samples with UC was focused on glycan degradation, fermentation, and amino acid metabolism subsystems, while increased metabolite production was focused on the citric acid cycle, simple sugars, lipid metabolism, and vitamin and cofactor metabolism subsystems (). The differences in metabolic profile between the two cohorts were also characterized using PCoA (PERMANOVA, R2 = 0.035, p = 0.009, Supplementary Fig. S2e) and the Receiver Operating Characteristic curves (AUC >0.95, Supplementary Fig. S2h). Thus, differences in the microbial communities of samples with UC and non-IBD controls directly cause differences in metabolite production.
Figure 1. Predicted metabolic characterization of 136 microbiomes. (a-g) total metabolite secretion fluxes (mmol/person/day) predicted for the microbiomes of 67 UC and 69 non-IBD control samples for selected metabolites of interest.
3.2. Strain-to-metabolite contributions and metabolic functions altered in UC microbiomes
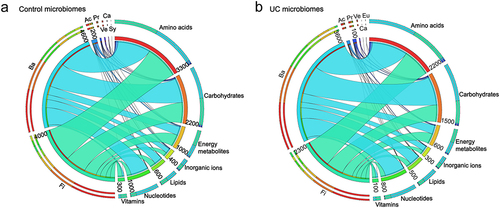
We further explored the association between altered microbial community composition and the overall metabolic profile (Methods). This corresponded to the characterization of all 419 microbes represented in at least one microbiome community model, contributing to at least one of the 248 secreted metabolites. Of the 18,350 predicted strain-to-metabolite contributions, with an average of 43.38 contributions per bacterial strain, 4932 (26.88%) contributions were significantly differentiated (Wilcoxon rank-sum test, FDR < 0.05) in the microbiome of samples with UC versus controls (Supplementary Table S5). This characterized the metabolic differences between the UC and control groups as a whole by traversing all exchange reactions in 136 community models. Furthermore, we summarized the significantly different strain-to-metabolite contributions based on the bacterial phyla and metabolite subsystems of the two clusters (). Notable decreases in the contributory strain-to-metabolite assignments were observed for Bacteroidetes, Firmicutes, and Actinobacteria, whereas increased contributions by Proteobacteria were evident (). These results are consistent with reports on gut microbial composition in patients ,Citation47 , .Citation48,Citation49 Again, the UC samples clustered separately from the non-IBD controls as presented by the PCoA (PERMANOVA, R2 = 0.114, p = 0.001) for all 18,350 strain-to-metabolite contributions (Supplementary Fig. S2f). These features can also be used as inputs for classifiers to predict UC phenotypes (Supplementary Fig. S2i). To interpret the observed metabolic changes, the absolute presence and quantitative abundances of metabolic reactions across the entire community were computed and examined. Analysis of the absolute presence of metabolic reactions revealed differences in 135 reactions between UC and control clusters (Supplementary Table S5 and Supplementary Fig. S4). Furthermore, significant differences in the abundance of 1528 reactions at the whole-community level were observed between UC and control microbiomes (Supplementary Table S5). For instance, pathways associated with amino sugar and bile acid metabolism were more abundant in the UC microbiomes (Supplementary Fig. S5).
Figure 2. Strain-to-metabolite contributions computed for the 136 microbiomes. (a, b) circos plots on 4932 significantly different strain-to-metabolite contributions (mmol/person/day) summarized separately for the 69 non-IBD and 67 UC microbiomes, shown are the seven most prominent phylum-level contributions to all metabolites summarized by metabolite subsystem. Fi = Firmicutes, Ba = Bacteroidetes, Ac = Actinobacteria, Pr = Proteobacteria, Ve = Verrucomicrobia, Ca = candidatus melainabacteria, sy = synergistetes, Eu = Euryarchaeota.
3.3. Potential alleviators identified for ulcerative colitis using machine learning classifiers
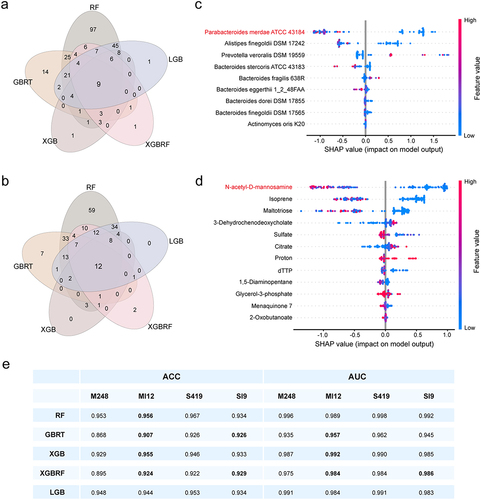
The highly complex nature of compartmentalized community models generated based on the Microbiome Modelling ToolboxCitation39 is due to the large number of variables contained in the simulation process, making it difficult to identify explanatory pathways.Citation50 To generate a reliable hypothesis that could be tested experimentally from the results of the COBRA simulations, important features of the strains and metabolites were screened using base classifiers in supervised machine learning. Specifically, tree-based models were used to identify important features (Methods). We used the cross-sections chosen by the above model-based feature selection methods as additional UC regulatory targets (). In addition, we evaluated the predictive performance of the pre-screening and post-screening features using 10 times 5-fold cross-validation (Methods). Intriguingly, the important features of the screened strains and metabolites, which accounted for 2.13% and 4.84% of all features, respectively, were comparable to the predictive performance of almost all features (). The prediction performance of the XGBRF model based on significant features consistently outperformed that of all features. We assessed the contribution of each important feature to the prediction of each sample using SHAP (). We found that P. merdae ATCC 43,184 and the metabolite N-acetyl-D-mannosamine were the most prominent contributors to the XGBRF model ().
Figure 3. Feature selection and predictive performance evaluation. (a) Strains with feature importance greater than 0 based on RF, GBRT, XGB, XGBRF and LGB classifiers. (b) Metabolites with feature importance greater than 0 based on RF, GBRT, XGB, XGBRF and LGB classifiers. The effect on total prediction (based on SHAP values) is depicted for the 9 most predictive strains (c) and 12 most predictive metabolites (d) in XGBRF classifier, ranked in order of descending importance. Each data point denotes one sample, with coloration corresponding to the relative abundance of the specific strain or metabolite in that sample compared to all other samples. (e) Evaluating the impact on model prediction performance before and after feature selection based on accuracy (ACC) and Area Under Curve (AUC) indicators. M248, a total of 248 secreted metabolites; MI12, metabolite intersections with feature importance greater than 0 screened by 5 classifiers; S419, a total of 419 mapped strains; SI9, setabolite intersections with feature importance greater than 0 screened by 5 classifiers.
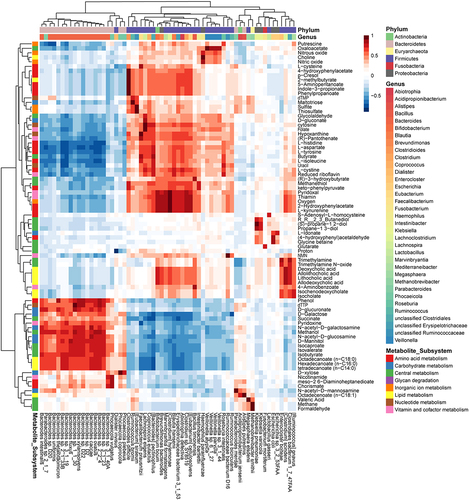
Additionally, we calculated the Spearman correlation between the predicted metabolic profiles and species-specific abundances. Analysis of secreted metabolites and the corresponding bacterial species revealed robust correlations (correlation coefficient > 0.75) among the 82 metabolite-species pairs (). For example, carbohydrate catabolism and fermentation products are strongly correlated with multiple Bacteroides spp. in relation to the richness of carbohydrate-active enzymes encoded by Bacteroides species.Citation51 Overall, the correlations between Bacteroidetes and Firmicutes and their metabolites were clearly stratified and clustered (). It was noteworthy that we found a positive correlation between Parabacteroides merdae and ManNAc (correlation coefficient = 0.935) (). To elucidate the biological significance underlying this correlation, we calculated the contribution of 136 microbiome community models to the total production of ManNAc. Our analysis revealed that P. merdae was its main contributing strain, with a noticeable decrease in its contribution to ManNAc in UC samples (Supplementary Fig. S6). This finding aligned with the observed decrease in both the abundance of P. merdae and ManNAc in UC samples. From these observations, we inferred a close biological interaction between P. merdae and ManNAc.
Figure 4. Spearman correlation analysis between metabolite secretion fluxes (mmol/person/day) and species relative abundances across all 136 microbiome models revealed 82 metabolites with correlation coefficients > 0.75 or < −0.75 with at least one bacterial species. These 82 metabolites, categorized by subsystem annotation, are displayed against the corresponding bacterial species, classified by genus and phylum.
3.4. P. merdae and ManNAc ameliorated UC mice through alleviating physiological indices
To further validate the reliability of mechanistic modeling combined with machine learning for screening candidate biomarkers, we tested the mitigating effects of the candidate biomarkers on DSS-induced ulcerative colitis mice using biological experiments. Based on previous predictions, both P. merdae and ManNAc were significantly reduced in abundance within either the microbiome or metabolome of UC samples (Supplementary Table S5), and both were important features for stratifying UC and control samples (). Therefore, we aimed to preliminarily investigate whether supplementation with P. merdae and ManNAc, respectively, had a mitigating effect on UC.
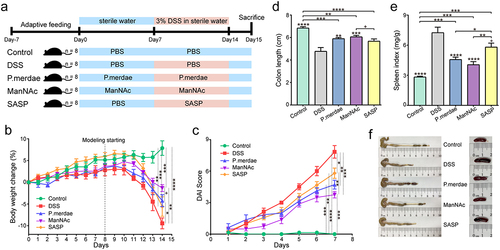
We administered P. merdae and ManNAc by gavage one week before and during the DSS modeling period, and the physiological indices of all mice were recorded in detail on a daily basis (). As shown in , on the last day of modeling, all DSS-treated mice had significantly reduced body weights and increased DAI indices compared with the control group (). When compared with the DSS group, supplementation with P. merdae and ManNAc markedly alleviated the weight loss of UC mice to some extent. The SASP group showed the same trend, but the difference was not significant (). In addition, the increases in DAI indices for the P. merdae, ManNAc, and SASP groups were less pronounced than those in the DSS group. In particular, the ManNAc group exhibited the greatest divergence from the DSS group, indicating that ManNAc conferred improved amelioration of the DAI index compared to the other interventions (). Shortened colon length and increased spleen index are important parameters that characterize increased inflammation.Citation52 Our results showed a significant reduction in colon length and a significant increase in spleen index in the DSS group compared to those in the control group (). Compared to the DSS group, supplementation with P. merdae and ManNAc significantly alleviated these physiological indices, including the colon length () and spleen index (). Overall, the P. merdae and ManNAc groups demonstrated superior physiological indices compared with the SASP group, suggesting that P. merdae and ManNAc conferred an enhanced remission effect on UC.
Figure 5. Effects of P.Merdae and ManNAc on DSS-induced UC mice. (a) Experimental design and grouping, color blue refers to sterile water, color pink refers to 3% DSS water. (b) Body weight (“modelling starting designated as the UC modeling start date on day 8”). (c) Disease activity index (DAI) score. (d) Colon length (cm). (e) The immune organ index of mouse spleen (mg/g). (f) Representative images of the colon and spleen.
3.5. P. merdae and ManNAc ameliorated UC mice through modulating the concentrations of cell cytokines
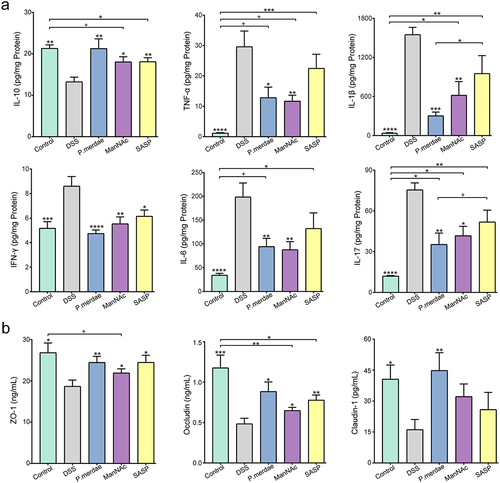
The anti-inflammatory cytokine IL-10 and pro-inflammatory cytokines including TNF-α, IL-1β, IFN-γ, IL-6, and IL-17 were quantified in colonic tissue supernatants from six mice per group, as depicted in . A noteworthy reduction was observed in the concentration of the anti-inflammatory cytokine IL-10 in the DSS group compared with that in the control group. Conversely, the concentrations of the five pro-inflammatory cytokines mentioned above significantly increased. Opposite results were observed in the P. merdae, ManNAc, and SASP groups. The concentrations of these six inflammatory cytokines in the P. merdae and ManNAc groups were significantly different from those in the DSS group and were superior to those in the SASP group. We also examined the concentration of tight junctions (TJ) proteins, including ZO-1, Occludin, and Claudin-1, in the colon. The results showed that the P. merdae, ManNAc, and SASP groups effectively reduced the DSS-induced loss of TJ proteins in the colon compared with the DSS group, with P. merdae being the most efficacious (). This indicates that P. merdae and ManNAc could reduce inflammation to some extent by reducing the increase in intestinal permeability.
Figure 6. Effects of P.Merdae and ManNAc on cytokines and tight junctions (TJs). (a) The impact of P.Merdae and ManNAc on a panel of cytokines, encompassing IL-10, TNF-α, IL-1β, IFN-γ, IL-6, and IL-17, was assessed. (b) Expression of colonic tight junction, including ZO-1, occludin, and claudin-1.
3.6. P. merdae and ManNAc ameliorated UC mice through alleviating pathological lesions
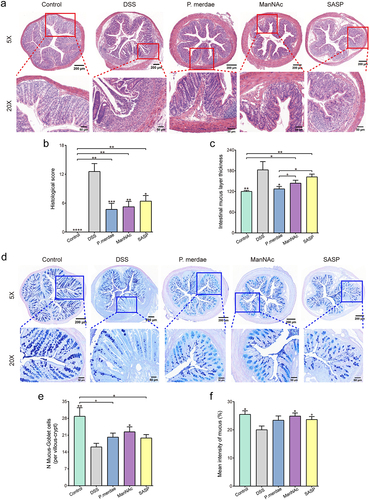
To visualize the histological structure and mucus-related features of the colon more intuitively, we performed H&E and AB-PAS staining of the colonic intestinal segments. As shown in , compared to the control group, the DSS group presented significantly greater histopathological scoring, a significantly thicker intestinal mucosal wall, and a significant reduction in the number of mucus-goblet cells per villous crypt and mean mucin production, suggesting that DSS treatment disrupted the integrity of the colonic tissues and the mucosal barrier to a large extent. Specifically, H&E-stained paraffin sections showed that some crypts in the colonic tissues of the DSS group disappeared and inflammatory cells spread throughout the intestinal lumen (). AB-PAS staining clearly showed a major loss of goblet cells in some areas of the colonic tissues in the DSS group, with a corresponding decrease in mucin production (). However, based on the indicators of pathological tissue and mucus layer assessment, supplementation with P. merdae, ManNAc, and SASP during UC modeling clearly alleviated the severity of colonic tissue damage compared to the DSS group. Moreover, the superior resistance observed in the P. merdae and ManNAc treatment groups compared to the SASP group aligns with the reduced histological scores, thinner mucosal layers, increased goblet cells, and mucus production ().
Figure 7. Effects of P. merdae and ManNAc on histological parameters. (a) Exemplary histological examination of the mouse colon, stained with H&E, at magnifications of × 5 and × 20. (b) Scoring of histopathological features in colon tissue. (c) Intestinal mucus layer thickness of colon tissue. (d) Exemplary mucus layer observation of the mouse colon, stained with AB-PAS, at magnifications of × 5 and × 20. (e) The number of mucus-goblet cells per villous-crypt of colon tissue. (f) The mean intensity of mucus of colon tissue.
3.7. P. merdae and ManNAc ameliorated UC mice through regulating the level of SCFAs
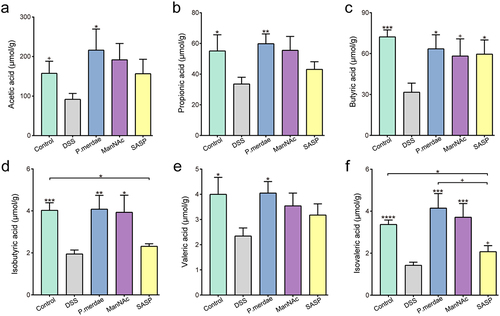
We further quantified SCFAs in cecal contents to determine whether the ameliorative effects of P. merdae and ManNAc on UC were associated with the production of SCFAs. As depicted in , the DSS group exhibited a substantial reduction in the concentrations of all six SCFAs compared with the control group (p < 0.01). In contrast, P. merdae significantly increased the levels of these SCFAs compared to those in the DSS group (p < 0.05), whereas supplementation with P. merdae increased the levels of acetic, propionic, and isovaleric acids compared to those in the control group. ManNAc significantly increased the levels of butyric, isobutyric, and isovaleric acids (p < 0.01). In addition, it is worth noting that while SASP did not match the effectiveness of P. merdae and ManNAc in stimulating elevated SCFA production, it demonstrated a significant increase in butyric acid production compared to that in the DSS group (p < 0.05). Collectively, the alleviation of UC by P. merdae and ManNAc may be related to the promotion of SCFAs production in the gut.
Figure 8. Levels of different SCFAs including (a) acetic acid, (b) propionic acid, (c) butyric acid, (d) isobutyric acid, (e) valeric acid, and (f) isovaleric acid in cecal contents.
4. Discussion
IBD comprises two major subtypes, UC and Crohn’s Disease (CD), which are primarily distinguished by the location and extent of inflammation. Constraint-based modeling of microbiome communities has been extensively employed to investigate dysregulated microbiota and associated metabolites in patients with CD, leading to the proposal of suitable dietary interventions.Citation18,Citation37,Citation53 However, the application of personalized microbial community models to understand the mechanisms underlying UC and the interactions between individual microbiota and metabolites has been relatively limited. Recognizing these personalized associations is crucial given the pivotal role of intestinal microbial metabolism in UC pathogenesis.Citation54 The synergistic integration of the COBRA methodology and ML techniques has found widespread utility across diverse scientific domains.Citation29,Citation30 One notable application involves identifying genetic determinants related to cell wall modifications, contributing to antimicrobial resistance and aiding in addressing antimicrobial resistance challenges associated with opportunistic pathogens, such as E. coli, in public health contexts.Citation55 Moreover, this amalgamation approach has demonstrated clinical significance ranging from identifying metabolic biomarkers associated with radiation-resistant tumors to predicting individual patient sensitivity to radiation therapy.Citation31 By leveraging the comprehensive biological context provided by microbial community modeling and the robust discriminative power of ML classifiers, we employed both methodologies to identify potential biomarkers of UC.
In numerous IBD cohorts, a recurring distinction has been made between two subsets: those in remission and those experiencing an active disease state.Citation56,Citation57 Consequently, phenotypes and physiological functions of these subsets may vary. This study focused on discerning the most salient distinctions between the individual microbial communities of samples with UC and non-IBD controls (Methods). We systematically conducted an in-depth in silico characterization of the metabolic potential across 136 individual microbiomes. The variation in microbial composition reflected the greatly varied metabolic profiles across individual microbiomes. The relative abundance of all strains within each microbiome, net production, and uptake potential of each microbiome, qualitative and quantitative presence of reactions and pathways in each microbiome, correlations between metabolic profiles and species abundance, and quantitative contributions of all strains within each microbiome to all secreted metabolites were determined.
Specifically, in UC microbiomes, the abundance of beneficial butyrate-producing microbes such as Faecalibacterium prausnitzii was reduced, while that of potentially pro-inflammatory microbes such as Ruminococcus gnavus was increasedCitation58 (Supplementary Table S5 and Supplementary Fig. S3). Subsequently, multiple metabolic network properties and fluxes diverged between the UC and non-IBD microbiomes. For example, the qualitative and quantitative presence of reactions and pathways in each microbiome differed between the two groups (Supplementary Table S5 and Supplementary Fig. S4 and S5). The altered metabolic networks further result in different potentials for metabolite uptake and secretion by UC and non-IBD microbiomes. For example, we predicted a reduced potential for UC microbiomes to secrete metabolites such as N-acetyl-D-mannosamine, maltotriose, menaquinone 7, cysteine, indole-3-propionate, glycine, and inorganic ions (Supplementary Table S5 and ), where mucin and glycan degradation were more prevalent. Significantly decreased indole-3-propionate (FDR = 6.44 × 10⁻⁶) in UC samples was also observed in the experimental metabolomics of the same cohort.Citation34 And it has been shown that oral administration of indole-3-propionic acid helped to alleviate DSS-induced ulcerative colitis in mice.Citation59 Alternatively, increased secretion potential was predicted for trimethylamine N-oxide, serine, nicotinate, D-ribose, lactate, putrescine, and some bile acid metabolites (Supplementary Table S5 and ). Simultaneously, increased fecal putrescine was consistent with the results of experimental metabolomics (FDR = 5.63 × 10⁻³).Citation34 The predicted concentrations of many other metabolites across the UC and control microbiomes aligned with the findings of previous research, such as 2-methylbutyric acidCitation60 and lactateCitation61 (). We elucidated the disparities in metabolite secretion between UC and control microbiomes at the level of metabolic function and the corresponding contributing strains (, Supplementary Table S5, and Supplementary Fig. S4 and S5).
Importantly, we input all bacterial strains and metabolite features into machine learning classifiers for phenotypic prediction to identify the most discriminative biomarkers for distinguishing samples with UC from controls. Using feature selection methods, we identified distinct sets of biomarkers for the strains and metabolites (). These discerned biomarkers encompassed nine distinct strains and 12 metabolites (). Several studies have reported an association between the abundance of some of these strains and UC.Citation62,Citation63 Interestingly, the predictive performance of the two biomarker sets occasionally outperformed that of all features, especially in the case of the XGBRF classifier (). Among these, P. merdae ATCC 43,184 and N-acetyl-D-mannosamine were the strain and metabolite that exerted the most substantial influence on the overall predictive performance, respectively (). Moreover, we validated specific and consistent microbe-metabolite relationships, such as the observed positive correlation between Methanobrevibacter smithii and methane,Citation64 and established that Clostridioides difficile is a confirmed producer of p-cresolCitation65 (). We also demonstrated that the metabolic profiles predicted by the microbial community models, along with the contribution of each strain to the metabolites, could serve as informative features for machine learning classifiers to effectively stratify samples with UC from controls (Supplementary Fig. S2g-i).
The empirical verification of community simulation outcomes is pivotal for evaluating the predictive capacity of microbial community models.Citation50 Thus, the alignment of the partial simulation results from microbial community models with existing knowledge or directly measured experimental data is biologically significant. Given the complexity of the human gut microbes, obtaining appropriate data to validate the results of community simulations becomes difficult when designing new experimental protocols to verify these hypotheses. We designed animal experiments based on the predicted results to further investigate the alleviating effects of P. merdae and ManNAc supplementation in DSS-induced UC mice (). In DSS-induced UC mice, weight loss, shortened colon length, increased spleen index, and elevated DAI index were associated with the severity of inflammation. Our results indicated that supplementation with P. merdae and ManNAc significantly enhanced these physiological parameters in UC mice compared with those in the DSS group, suggesting that P. merdae and ManNAc partially ameliorated the phenotype of UC mice ().
We conducted a preliminary investigation of the mechanisms of action of P. merdae and ManNAc in relieving colitis. The dysfunction of TJs between intestinal epithelial cells can damage the intestinal barrier, allowing for increased intestinal permeability, which in turn increases the opportunity for harmful substances to enter the organism.Citation66 We used ELISA to examine the protein levels of several major TJs, including ZO-1, Claudin-1 and Occludin, in the colonic tissues of UC mice. The results indicated that DSS treatment significantly reduced the TJ content between intestinal epithelial cells, whereas the protein levels of ZO-1, Claudin-1, and Occludin were notably increased in the P. merdae and ManNAc groups; P. merdae exhibited a more pronounced trend in promoting TJ growth than ManNAc, although there was no significant difference between the two groups (). This suggests that both P. merdae and ManNAc exert anti-UC effects by enhancing the content between intestinal epithelial cells, thereby preserving the mechanical barrier of the intestine to a certain extent. Furthermore, H&E- and AB-PAS- stained colon tissue sections provided a more detailed illustration of the beneficial effects of P. merdae and ManNAc in ameliorating DSS-induced tissue damage. This was evident from a significant reduction in histopathological scores and an increase in the number of mucus-goblet cells per villous crypt ().
Importantly, we demonstrated that P. merdae and ManNAc alleviated UC by increasing the expression of anti-inflammatory cytokine IL-10 while simultaneously reducing levels of pro-inflammatory cytokines such as TNF-α, IL-6, IL-17, IFN-γ, and IL-1β (). Among these, IL-10 played a pivotal role in maintaining intestinal mucosal homeostasis and could suppress the synthesis of pro-inflammatory cytokines, such as IL-6, TNF-α, IL-1, and IFN-γ.Citation67,Citation68 Besides, TNF-α could act as a pro-inflammatory mediator, regulating the generation and maintenance of inflammation.Citation69 IL-6 increased TJ permeability by activating the c-jun N-terminal kinase pathway.Citation70 IL-1β down-regulated the mRNA expression of Occludin, resulting in increased intestinal TJ permeability.Citation71 Some members of the IL-17 family promote the synthesis of inflammatory cytokines in various cell types, thereby amplifying the extent of tissue damage.Citation72 IFN-γ has been reported to associate with increased epithelial cell apoptosis.Citation73 This suggests that P. merdae and ManNAc maintain immune homeostasis by maintaining the equilibrium between anti-inflammatory and pro-inflammatory cytokine levels. SCFAs are crucial metabolites of the gut microbiota and serve as energy sources for intestinal epithelial cells. Notably, SCFAs can reduce the expression of pro-inflammatory factors, increase mucus production in goblet cells, and thus play an indispensable role in the treatment of UC.Citation74 Our results showed that P. merdae and ManNAc may alleviate DSS-induced UC by modulating SCFA levels ().
Collectively, our study demonstrates the potential of an integrative approach combining microbiome community modeling with machine learning to uncover potential biomarkers for UC. Furthermore, through preliminary animal experiments, we provide evidence for the anti-inflammatory efficacy of P. merdae and ManNAc in mitigating UC to a certain extent. Notably, ManNAc serves as a critical precursor in the synthesis of N-acetylneuraminic acid (Neu5Ac), the anti-inflammatory effect of which in ameliorating UC has been previously established.Citation75 Furthermore, ManNAc treatment effectively modulated Angiopoietin-like-4 (Angptl4) sialylation and inhibits NLRP3, caspase-1, and IL-1β activation, thereby mitigating podocyte pyroptosis and alleviating inflammation in the therapy of Diabetic nephropathy, an inflammatory condition characterized by hyposialylated Angptl4 secretion by podocytes in glomeruli.Citation76 Based on this, we speculated that ManNAc may exert its anti-inflammatory effects in UC by modulating the sialic acid metabolic pathway. Moreover, P. merdae, the primary contributor of ManNAc (Supplementary Fig. S6), is likely to exert its anti-inflammatory effects by promoting ManNAc production.
Although our results successfully uncovered potential alleviators of UC, this study offers room for further refinement. Recently, the expansion of AGORA resources has provided the opportunity to construct more personalized microbiome metabolic models, thereby enhancing the resolution of strain-specific metabolism.Citation77 In contrast, our classifiers individually identified the strains and metabolites most adept at distinguishing samples with UC from controls. In subsequent investigations, the incorporation of all sample-related data including clinical information into multi-omics classifiers may provide additional benefits. Finally, we provided an initial confirmation of the therapeutic effects of P. merdae and ManNAc in mitigating UC. Further research is needed to design appropriate experimental protocols to elucidate the underlying intrinsic mechanisms and interactions between P. merdae and ManNAc.
In conclusion, we comprehensively dissected the metabolic mechanisms of microbiomes in samples with UC using a combined analytical approach involving GSMMs and ML. This approach enabled us to capture the contribution of each strain to each metabolite in individual samples and identify the most effective biomarkers for distinguishing samples with UC from non-IBD controls. Subsequently, we substantiated the anti-inflammatory effects of P. merdae and ManNAc on UC progression using appropriate animal experiments, including physiological and pathological indicators and changes in SCFAs concentrations. Our future studies will further delve into the mechanisms by which P. merdae and ManNAc exert their anti-inflammatory effects, including their effects on the gut microbiome and metabolome of UC samples. In general, the iterative pipeline of computational predictions and experimental validation paves the way for the identification of potential UC biomarkers.
Availability of data
The data presented in this study are available in the NCBI BioProject under accession number PRJNA398089.
Author contributions
Conceptualization: J.Z., W.L. and H.W.; Formal Analysis: J.Z. and H.Z.; Funding acquisition: J.Z. and W.C.; Investigation: J.Z., H.Z., W.L. and H.W.; Methodology: J.Z., J.Y., W.L. and H.W.; Project administration: H.Z.; Resources: W.L.; Supervision: H.Z. and W.L.; Validation: J.Z. and J.Y.; Visualization: J.Y.; Writing-original draft: J.Z. and J.Y.; Other assistance: M.H. and J.C.; Writing-review and editing: W.C. All authors have read and agreed to the published version of the manuscript.
Supplemental Material
Download Zip (12.7 MB)Disclosure statement
No potential conflict of interest was reported by the authors.
Supplementary Material
Supplemental data for this article can be accessed online at https://doi.org/10.1080/19490976.2024.2336877.
Additional information
Funding
References
- Zhao M, Gonczi L, Lakatos PL, Burisch J. The burden of inflammatory bowel disease in Europe in 2020. J Crohns Colitis. 2021;15(9):1573–22. doi:10.1093/ecco-jcc/jjab029.
- de Souza HSP, Fiocchi C, Iliopoulos D, de Souza HSP. The IBD interactome: an integrated view of aetiology, pathogenesis and therapy. Nat Rev Gastroenterol Hepatol. 2017;14(12):739–749. doi:10.1038/nrgastro.2017.110.
- Kobayashi T, Siegmund B, Le Berre C, Wei SC, Ferrante M, Shen B, Bernstein CN, Danese S, Peyrin-Biroulet L, Hibi T. et al. Ulcerative colitis. Nat Rev Dis Primers. 2020;6(1):74. doi:10.1038/s41572-020-0205-x.
- Shan Y, Lee M, Chang EB. The gut microbiome and inflammatory bowel diseases. Annu Rev Med. 2022;73(1):455–468. doi:10.1146/annurev-med-042320-021020.
- Galipeau HJ, Caminero A, Turpin W, Bermudez-Brito M, Santiago A, Libertucci J, Constante M, Raygoza Garay JA, Rueda G, Armstrong S. et al. Novel fecal biomarkers that precede clinical diagnosis of ulcerative colitis. Gastroenterology. 2021;160(5):1532–1545. doi:10.1053/j.gastro.2020.12.004.
- Guo X, Huang C, Xu J, Xu H, Liu L, Zhao H, Wang J, Huang W, Peng W, Chen Y. et al. Gut microbiota is a Potential Biomarker in Inflammatory Bowel disease. Front Nutr. 2022;8:818902. doi:10.3389/fnut.2021.818902.
- Santoru ML, Piras C, Murgia A, Palmas V, Camboni T, Liggi S, Ibba I, Lai MA, Orrù S, Blois S. et al. Cross sectional evaluation of the gut-microbiome metabolome axis in an Italian cohort of IBD patients. Sci Rep. 2017;7(1):9523. doi:10.1038/s41598-017-10034-5.
- Nakamura Y, Suzuki S, Murakami S, Nishimoto Y, Higashi K, Watarai N, Umetsu J, Ishii C, Ito Y, Mori Y. et al. Integrated gut microbiome and metabolome analyses identified fecal biomarkers for bowel movement regulation by Bifidobacterium longum BB536 supplementation: a RCT. Comput Struct Biotechnol J. 2022;20:5847–5858. doi:10.1016/j.csbj.2022.10.026.
- Zhang A, Sun H, Wang P, Han Y, Wang X. Modern analytical techniques in metabolomics analysis. Analyst (Lond). 2012;137(2):293–300. doi:10.1039/C1AN15605E.
- Chaleckis R, Meister I, Zhang P, Wheelock CE. Challenges, progress and promises of metabolite annotation for LC-MS-based metabolomics. Curr Opin Biotechnol. 2019;55:44–50. doi:10.1016/j.copbio.2018.07.010.
- Aretz I, Meierhofer D. Advantages and pitfalls of mass spectrometry based metabolome profiling in systems biology. Int J Mol Sci. 2016;17(5):632. doi:10.3390/ijms17050632.
- Kanehisa M, Goto S, Hattori M, Aoki-Kinoshita KF, Itoh M, Kawashima S. et al. From genomics to chemical genomics: new developments in KEGG. Nucleic Acids Res. 2006;34:D354–7. doi:10.1093/nar/gkj102.
- Greenblum S, Turnbaugh PJ, Borenstein E. Metagenomic systems biology of the human gut microbiome reveals topological shifts associated with obesity and inflammatory bowel disease. Proc Natl Acad Sci USA. 2012;109(2):594–599. doi:10.1073/pnas.1116053109.
- Heirendt L, Arreckx S, Pfau T, Mendoza SN, Richelle A, Heinken A, Haraldsdóttir HS, Wachowiak J, Keating SM, Vlasov V. et al. Creation and analysis of biochemical constraint-based models using the COBRA Toolbox v.3.0. Nat Protoc. 2019;14(3):639–702. doi:10.1038/s41596-018-0098-2.
- Thiele I, Palsson BO. A protocol for generating a high-quality genome-scale metabolic reconstruction. Nat Protoc. 2010;5:93–121. doi:10.1038/nprot.2009.203.
- Magnusdottir S, Heinken A, Kutt L, Ravcheev DA, Bauer E, Noronha A, Greenhalgh K, Jäger C, Baginska J, Wilmes P. et al. Generation of genome-scale metabolic reconstructions for 773 members of the human gut microbiota. Nat Biotechnol. 2017;35(1):81–89. doi:10.1038/nbt.3703.
- Heinken A, Hertel J, Thiele I. Metabolic modelling reveals broad changes in gut microbial metabolism in inflammatory bowel disease patients with dysbiosis. NPJ Syst Biol Appl. 2021;7(1):19. doi:10.1038/s41540-021-00178-6.
- Heinken A, Ravcheev DA, Baldini F, Heirendt L, Fleming RMT, Thiele I. Systematic assessment of secondary bile acid metabolism in gut microbes reveals distinct metabolic capabilities in inflammatory bowel disease. Microbiome. 2019;7(1):75. doi:10.1186/s40168-019-0689-3.
- Aden K, Rehman A, Waschina S, Pan WH, Walker A, Lucio M, Nunez AM, Bharti R, Zimmerman J, Bethge J. et al. Metabolic functions of gut microbes associate with efficacy of tumor necrosis factor antagonists in patients with inflammatory bowel diseases. Gastroenterology. 2019;157(5):1279–92 e11. doi:10.1053/j.gastro.2019.07.025.
- Baldini F, Heinken A, Heirendt L, Magnusdottir S, Fleming RMT, Thiele I, Wren J. The microbiome modeling Toolbox: from microbial interactions to personalized microbial communities. Bioinformatics. 2019;35(13):2332–2334. doi:10.1093/bioinformatics/bty941.
- Tian M, Reed JL, Wren J. Integrating proteomic or transcriptomic data into metabolic models using linear bound flux balance analysis. Bioinformatics. 2018;34(22):3882–3888. doi:10.1093/bioinformatics/bty445.
- O’Brien EJ, Palsson BO. Computing the functional proteome: recent progress and future prospects for genome-scale models. Curr Opin Biotechnol. 2015;34:125–134. doi:10.1016/j.copbio.2014.12.017.
- Noronha A, Modamio J, Jarosz Y, Guerard E, Sompairac N, Preciat G, Daníelsdóttir AD, Krecke M, Merten D, Haraldsdóttir HS. et al. The virtual metabolic human database: integrating human and gut microbiome metabolism with nutrition and disease. Nucleic Acids Res. 2019;47(D1):D614–D24. doi:10.1093/nar/gky992.
- Orth JD, Thiele I, Palsson BO. What is flux balance analysis? Nat Biotechnol. 2010;28:245–248. doi:10.1038/nbt.1614.
- Scott KP, Gratz SW, Sheridan PO, Flint HJ, Duncan SH. The influence of diet on the gut microbiota. Pharmacol Res. 2013;69(1):52–60. doi:10.1016/j.phrs.2012.10.020.
- Hertel J, Heinken A, Martinelli F, Thiele I. Integration of constraint-based modeling with fecal metabolomics reveals large deleterious effects of Fusobacterium spp. On community butyrate production. Gut Microbes. 2021;13(1):1915673. doi:10.1080/19490976.2021.1915673.
- Mossotto E, Ashton JJ, Coelho T, Beattie RM, MacArthur BD, Ennis S. Classification of paediatric inflammatory bowel disease using machine learning. Sci Rep. 2017;7:2427. doi:10.1038/s41598-017-02606-2.
- Khorasani HM, Usefi H, Pena-Castillo L. Detecting ulcerative colitis from colon samples using efficient feature selection and machine learning. Sci Rep. 2020;10(1):13744. doi:10.1038/s41598-020-70583-0.
- Zampieri G, Vijayakumar S, Yaneske E, Angione C, Nielsen J. Machine and deep learning meet genome-scale metabolic modeling. PLoS Comput Biol. 2019;15(7):e1007084. doi:10.1371/journal.pcbi.1007084.
- Kim Y, Kim GB, Lee SY. Machine learning applications in genome-scale metabolic modeling. Curr Opin Syst Biol. 2021;25:42–49. doi:10.1016/j.coisb.2021.03.001.
- Lewis JE, Kemp ML. Integration of machine learning and genome-scale metabolic modeling identifies multi-omics biomarkers for radiation resistance. Nat Commun. 2021;12(1):2700. doi:10.1038/s41467-021-22989-1.
- Turanli B, Zhang C, Kim W, Benfeitas R, Uhlen M, Arga KY, Mardinoglu A. Discovery of therapeutic agents for prostate cancer using genome-scale metabolic modeling and drug repositioning. EBioMedicine. 2019;42:386–396. doi:10.1016/j.ebiom.2019.03.009.
- Magazzu G, Zampieri G, Angione C. Clinical stratification improves the diagnostic accuracy of small omics datasets within machine learning and genome-scale metabolic modelling methods. Comput Biol Med. 2022;151:106244. doi:10.1016/j.compbiomed.2022.106244.
- Lloyd-Price J, Arze C, Ananthakrishnan AN, Schirmer M, Avila-Pacheco J, Poon TW, Andrews E, Ajami NJ, Bonham KS, Brislawn CJ. et al. Multi-omics of the gut microbial ecosystem in inflammatory bowel diseases. Nature. 2019;569(7758):655–662. doi:10.1038/s41586-019-1237-9.
- Bolger AM, Lohse M, Usadel B. Trimmomatic: a flexible trimmer for Illumina sequence data. Bioinformatics. 2014;30(15):2114–2120. doi:10.1093/bioinformatics/btu170.
- Li H, Durbin R. Fast and accurate short read alignment with Burrows–Wheeler transform. Bioinformatics. 2009;25(14):1754–1760. doi:10.1093/bioinformatics/btp324.
- Bauer E, Thiele I. From metagenomic data to personalized in silico microbiotas: predicting dietary supplements for Crohn’s disease. NPJ Syst Biol Appl. 2018;4(1):27. doi:10.1038/s41540-018-0063-2.
- Li H, Handsaker B, Wysoker A, Fennell T, Ruan J, Homer N, Marth G, Abecasis G, Durbin R. The sequence Alignment/Map format and SAMtools. Bioinformatics. 2009;25(16):2078–2079. doi:10.1093/bioinformatics/btp352.
- Heinken A, Thiele I, Wren J. Microbiome modelling toolbox 2.0: efficient, tractable modelling of microbiome communities. Bioinformatics. 2022;38(8):2367–2368. doi:10.1093/bioinformatics/btac082.
- Gudmundsson S, Thiele I. Computationally efficient flux variability analysis. BMC Bioinf. 2010;11(1):489. doi:10.1186/1471-2105-11-489.
- Wu Y, Jha R, Li A, Liu H, Zhang Z, Zhang C, Zhai Q, Zhang J. Probiotics (lactobacillus plantarum HNU082) supplementation relieves ulcerative colitis by affecting intestinal barrier functions, immunity-related gene expression, gut microbiota, and metabolic pathways in mice. Microbiol Spectr. 2022;10(6):e0165122. doi:10.1128/spectrum.01651-22.
- Wang X, Gao Y, Wang L, Yang D, Bu W, Gou L, Huang J, Duan X, Pan Y, Cao S. et al. Troxerutin Improves Dextran Sulfate Sodium-Induced Ulcerative Colitis in Mice. J Agric Food Chem. 2021;69(9):2729–2744. doi:10.1021/acs.jafc.0c06755.
- Alipour M, Zaidi D, Valcheva R, Jovel J, Martinez I, Sergi C, Walter J, Mason AL, Wong GKS, Dieleman LA. et al. Mucosal barrier depletion and loss of bacterial diversity are primary abnormalities in paediatric ulcerative colitis. J Crohns Colitis. 2016;10(4):462–471. doi:10.1093/ecco-jcc/jjv223.
- Krzywinski M, Schein J, Birol İ, Connors J, Gascoyne R, Horsman D, Jones SJ, Marra MA. Circos: an information aesthetic for comparative genomics. Genome Res. 2009;19(9):1639–1645. doi:10.1101/gr.092759.109.
- Kedia S, Ghosh TS, Jain S, Desigamani A, Kumar A, Gupta V, Bopanna S, Yadav DP, Goyal S, Makharia G. et al. Gut microbiome diversity in acute severe colitis is distinct from mild to moderate ulcerative colitis. J Gastroenterol Hepatol. 2021;36(3):731–739. doi:10.1111/jgh.15232.
- Lavelle A, Lennon G, O’Sullivan O, Docherty N, Balfe A, Maguire A, Mulcahy HE, Doherty G, O’Donoghue D, Hyland J. et al. Spatial variation of the colonic microbiota in patients with ulcerative colitis and control volunteers. Gut. 2015;64(10):1553–1561. doi:10.1136/gutjnl-2014-307873.
- Xu J, Chen N, Wu Z, Song Y, Zhang Y, Wu N, Zhang F, Ren X, Liu Y. 5-aminosalicylic acid alters the gut bacterial microbiota in patients with ulcerative colitis. Front Microbiol. 2018;9:1274. doi:10.3389/fmicb.2018.01274.
- Fuentes S, Rossen NG, van der Spek MJ, Hartman JH, Huuskonen L, Korpela K, Salojärvi J, Aalvink S, de Vos WM, D’Haens GR. et al. Microbial shifts and signatures of long-term remission in ulcerative colitis after faecal microbiota transplantation. ISME J. 2017;11(8):1877–1889. doi:10.1038/ismej.2017.44.
- Sjoberg F, Barkman C, Nookaew I, Ostman S, Adlerberth I, Saalman R, Wold AE. Low-complexity microbiota in the duodenum of children with newly diagnosed ulcerative colitis. PloS One. 2017;12(10):e0186178. doi:10.1371/journal.pone.0186178.
- Bauer E, Thiele I, Sangwan N. From network analysis to functional metabolic modeling of the human gut microbiota. mSystems. 2018;3(3):3. doi:10.1128/mSystems.00209-17.
- Wang C, Li S, Hong K, Yu L, Tian F, Zhao J, Zhang H, Chen W, Zhai Q. The roles of different bacteroides fragilis strains in protecting against DSS-induced ulcerative colitis and related functional genes. Food Funct. 2021;12(18):8300–8313. doi:10.1039/D1FO00875G.
- Rodriguez-Nogales A, Algieri F, Garrido-Mesa J, Vezza T, Utrilla MP, Chueca N, Garcia F, Olivares M, Rodríguez‐Cabezas ME, Gálvez J. et al. Differential intestinal anti-inflammatory effects of lactobacillus fermentum and lactobacillus salivarius in DSS mouse colitis: impact on microRnas expression and microbiota composition. Mol Nutr Food Res. 2017;61(11):61. doi:10.1002/mnfr.201700144.
- Yilmaz B, Juillerat P, Oyas O, Ramon C, Bravo FD, Franc Y, Fournier N, Michetti P, Mueller C, Geuking M. et al. Microbial network disturbances in relapsing refractory Crohn’s disease. Nat Med. 2019;25(2):323–336. doi:10.1038/s41591-018-0308-z.
- Lavelle A, Sokol H. Gut microbiota-derived metabolites as key actors in inflammatory bowel disease. Nat Rev Gastroenterol Hepatol. 2020;17(4):223–237. doi:10.1038/s41575-019-0258-z.
- Pearcy N, Hu Y, Baker M, Maciel-Guerra A, Xue N, Wang W, Kaler J, Peng Z, Li F, Dottorini T. et al. Genome-scale metabolic models and machine learning reveal genetic determinants of antibiotic resistance in Escherichia coli and unravel the underlying metabolic adaptation mechanisms. mSystems. 2021;6(4):e0091320. doi:10.1128/mSystems.00913-20.
- Frank DN, St Amand AL, Feldman RA, Boedeker EC, Harpaz N, Pace NR. Molecular-phylogenetic characterization of microbial community imbalances in human inflammatory bowel diseases. Proc Natl Acad Sci USA. 2007;104(34):13780–13785. doi:10.1073/pnas.0706625104.
- Lewis JD, Chen EZ, Baldassano RN, Otley AR, Griffiths AM, Lee D, Bittinger K, Bailey A, Friedman E, Hoffmann C. et al. Inflammation, antibiotics, and diet as environmental stressors of the gut microbiome in pediatric Crohn’s disease. Cell Host Microbe. 2015;18(4):489–500. doi:10.1016/j.chom.2015.09.008.
- Schirmer M, Garner A, Vlamakis H, Xavier RJ. Microbial genes and pathways in inflammatory bowel disease. Nat Rev Microbiol. 2019;17(8):497–511. doi:10.1038/s41579-019-0213-6.
- Alexeev EE, Lanis JM, Kao DJ, Campbell EL, Kelly CJ, Battista KD, Gerich ME, Jenkins BR, Walk ST, Kominsky DJ. et al. Microbiota-derived indole metabolites promote human and murine intestinal homeostasis through regulation of interleukin-10 receptor. Am J Pathol. 2018;188(5):1183–1194. doi:10.1016/j.ajpath.2018.01.011.
- Le Gall G, Noor SO, Ridgway K, Scovell L, Jamieson C, Johnson IT, Colquhoun IJ, Kemsley EK, Narbad A. Metabolomics of fecal extracts detects altered metabolic activity of gut microbiota in ulcerative colitis and irritable bowel syndrome. J Proteome Res. 2011;10(9):4208–4218. doi:10.1021/pr2003598.
- Franzosa EA, Sirota-Madi A, Avila-Pacheco J, Fornelos N, Haiser HJ, Reinker S, Vatanen T, Hall AB, Mallick H, McIver LJ. et al. Gut microbiome structure and metabolic activity in inflammatory bowel disease. Nat Microbiol. 2018;4(2):293–305. doi:10.1038/s41564-018-0306-4.
- Nomura K, Ishikawa D, Okahara K, Ito S, Haga K, Takahashi M, Arakawa A, Shibuya T, Osada T, Kuwahara-Arai K. et al. Bacteroidetes species are correlated with disease activity in ulcerative colitis. J Clin Med. 2021;10(8):10. doi:10.3390/jcm10081749.
- Dziarski R, Park SY, Kashyap DR, Dowd SE, Gupta D, Mizoguchi E. Pglyrp-regulated gut microflora prevotella falsenii, parabacteroides distasonis and Bacteroides eggerthii enhance and alistipes finegoldii attenuates colitis in mice. PLoS One. 2016;11(1):e0146162. doi:10.1371/journal.pone.0146162.
- Samuel BS, Hansen EE, Manchester JK, Coutinho PM, Henrissat B, Fulton R, Latreille P, Kim K, Wilson RK, Gordon JI. et al. Genomic and metabolic adaptations of methanobrevibacter smithii to the human gut. Proc Natl Acad Sci USA. 2007;104(25):10643–10648. doi:10.1073/pnas.0704189104.
- Selmer T, Andrei PI. P-hydroxyphenylacetate decarboxylase from clostridium difficile. A novel glycyl radical enzyme catalysing the formation of p-cresol. Eur J Biochem. 2001;268:1363–1372. doi:10.1046/j.1432-1327.2001.02001.x.
- Horowitz A, Chanez-Paredes SD, Haest X, Turner JR. Paracellular permeability and tight junction regulation in gut health and disease. Nat Rev Gastroenterol Hepatol. 2023;20(7):417–432. doi:10.1038/s41575-023-00766-3.
- Zhang D, Wei C, Yao J, Cai X, Wang L. Interleukin-10 gene-carrying bifidobacteria ameliorate murine ulcerative colitis by regulating regulatory T cell/T helper 17 cell pathway. Exp Biol Med (Maywood). 2015;240(12):1622–1629. doi:10.1177/1535370215584901.
- Jung KJ, Lee GW, Park CH, Lee TJ, Kim JY, Sung EG, Kim SY, Jang BI, Song IH. Mesenchymal stem cells decrease oxidative stress in the bowels of interleukin-10 knockout mice. Gut Liver. 2020;14(1):100–107. doi:10.5009/gnl18438.
- Ghorbaninezhad F, Leone P, Alemohammad H, Najafzadeh B, Nourbakhsh NS, Prete M, Malerba E, Saeedi H, Tabrizi N, Racanelli V. et al. Tumor necrosis factor‑α in systemic lupus erythematosus: structure, function and therapeutic implications (review). Int J Mol Med. 2022;49(4):49. doi:10.3892/ijmm.2022.5098.
- Al-Sadi R, Ye D, Boivin M, Guo S, Hashimi M, Ereifej L, Ma TY. Interleukin-6 modulation of intestinal epithelial tight junction permeability is mediated by JNK pathway activation of claudin-2 gene. PLoS One. 2014;9(3):e85345. doi:10.1371/journal.pone.0085345.
- Rawat M, Nighot M, Al-Sadi R, Gupta Y, Viszwapriya D, Yochum G, Koltun W, Ma TY. IL1B increases intestinal tight junction permeability by up-regulation of MIR200C-3p, which Degrades Occludin mRNA. Gastroenterology. 2020;159(4):1375–1389. doi:10.1053/j.gastro.2020.06.038.
- Gaffen SL, Jain R, Garg AV, Cua DJ. The IL-23–IL-17 immune axis: from mechanisms to therapeutic testing. Nat Rev Immunol. 2014;14(9):585–600. doi:10.1038/nri3707.
- Seidelin JB. Regulation of antiapoptotic and cytoprotective pathways in colonic epithelial cells in ulcerative colitis. Scand J Gastroenterol. 2015;50(Suppl 1):1–29. doi:10.3109/00365521.2016.1101245.
- Wang S, Zhang S, Huang S, Wu Z, Pang J, Wu Y, Wang J, Han D. Resistant maltodextrin alleviates dextran sulfate sodium-induced intestinal inflammatory injury by increasing butyric acid to inhibit proinflammatory cytokine levels. Biomed Res Int. 2020;2020:1–9. doi:10.1155/2020/7694734.
- Li D, Xie T, Guo T, Hu Z, Li M, Tang Y, Wu Q, Luo F, Lin Q, Wang H. et al. Sialic acid exerts anti-inflammatory effect through inhibiting MAPK-NF-κB/AP-1 pathway and apoptosis in ulcerative colitis. J Funct Foods. 2023;101:105416. doi:10.1016/j.jff.2023.105416.
- Gao Y, Ma Y, Xie D, Jiang H. ManNAc protects against podocyte pyroptosis via inhibiting mitochondrial damage and ROS/NLRP3 signaling pathway in diabetic kidney injury model. Int Immunopharmacol. 2022;107:108711. doi:10.1016/j.intimp.2022.108711.
- Heinken A, Hertel J, Acharya G, Ravcheev DA, Nyga M, Okpala OE, Hogan M, Magnúsdóttir S, Martinelli F, Nap B. et al. Genome-scale metabolic reconstruction of 7,302 human microorganisms for personalized medicine. Nat Biotechnol. 2023;41(9):1320–1331. doi:10.1038/s41587-022-01628-0.