
ABSTRACT
The insights into interactions between host genetics and gut microbiome (GM) in colorectal tumor susceptibility (CTS) remains lacking. We used Collaborative Cross mouse population model to identify genetic and microbial determinants of Azoxymethane-induced CTS. We identified 4417 CTS-associated single nucleotide polymorphisms (SNPs) containing 334 genes that were transcriptionally altered in human colorectal cancers (CRCs) and consistently clustered independent human CRC cohorts into two subgroups with different prognosis. We discovered a set of genera in early-life associated with CTS and defined a 16-genus signature that accurately predicted CTS, the majority of which were correlated with human CRCs. We identified 547 SNPs associated with abundances of these genera. Mediation analysis revealed GM as mediators partially exerting the effect of SNP UNC3869242 within Duox2 on CTS. Intestine cell-specific depletion of Duox2 altered GM composition and contribution of Duox2 depletion to CTS was significantly influenced by GM. Our findings provide potential novel targets for personalized CRC prevention and treatment.
Introduction
Colorectal cancer (CRC) is the third most common cancer and the second most common cause of cancer death in the United States.Citation1 It is well-documented that the risk of developing CRC is influenced by both genetic and environmental factors. Approximately 25% of the CRC patients have a genetic predisposition with 5% of CRC being inherited;Citation2–5 about 70% CRCs are sporadic, which may be linked to an interaction between genetics and environmental factors such as dietary habits, cigarette smoking, and alcohol consumption,Citation6–8 Genome-wide association studies (GWAS) in both humans and mice suggest that nonfamilial CRC susceptibility results from the interaction among multiple small-effect alleles.Citation2,Citation3,Citation5,Citation9,Citation10 About 100 genetic susceptibility regions related to CRC risk have been identified with GWAS.Citation2,Citation3
Strong evidence indicates that the abundance and composition of gut microbiome (GM) vary among individuals and determine the development of many diseases including cancer,Citation11–13 Metagenome-wide association studies aim to identify the host microbes that are associated with diseases.Citation14 An increasing number of studies suggest that the GM is directly involved in colorectal carcinogenesis,Citation15–17 Enterococcus faecalis, Bacteroides fragilis, Escherichia coli, and Fusobacterium nucleatum were found to be enriched in the feces of CRC patients and to promote the occurrence of CRC.Citation17,Citation18 However, understanding the impact of host genetics, GM, and their interactions on the variability in CRC susceptibility remains limited.Citation19,Citation20 Direct human studies face a huge challenge due to the complex interplay among host genetics and GM in the context of uncontrollable environmental exposures and lifestyles.
Mouse models have contributed greatly to our understanding of cancer biology.Citation21 The azoxymethane (AOM)-induced CRC mouse model has been widely used since AOM induces tumors in the distal mouse colon that resemble sporadic CRC of the descending colon in humans both histologically and molecularly.Citation22,Citation23 Moreover, researchers have identified many genetic loci that are susceptible to AOM-induced CRC by crossing resistant and susceptible mice.Citation9,Citation10 However, genetic variants distinguishing these commonly used strains are limited, and additional variants that are relevant to human CRC are likely missing. The Collaborative Cross (CC) mouse resource was established by combining the genomes of eight genetically diverse founder strains, which contains a level of genetic diversity on par with the human population,Citation24–26 The genetic variants are randomly distributed across the genome and are roughly twice the number of common single nucleotide polymorphisms (SNPs) as present in the human population.Citation24 Many studies have also reported phenotypic diversity including spontaneous tumor development across CC mice.Citation27–35
In this study, using CC mice together with an AOM-induced CRC protocol, we aimed to identify genetic and microbial determinants of AOM-induced colorectal tumor susceptibility (CTS) and investigate host gene-microbiota interactions contributing to colorectal tumorigenesis and their implications in human CRC using publicly available datasets including The Cancer Genome Atlas (TCGA) dataset.
Results
Variation in AOM-induced CTS across 30 CC strains
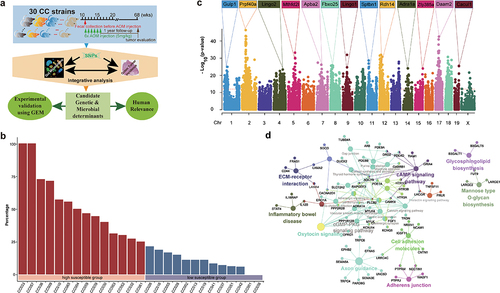
To investigate AOM-induced CTS, 426 mice across 30 CC strains were intraperitoneally injected with 5 mg/kg AOM weekly for six weeks (). All mice were monitored up to 1 year after the last injection. Finally, 355 mice were sacrificed to assess colon tumor development. CC008, CC021, CC038 strains were excluded from study since the number of mice in each strain was less than 6. Colorectal tumors were observed in 25 out of 27 CC strains (Supplemental Table S1). We didn’t observe significant differences in tumor incidence between male and female mice as previous studies on common laboratory strains.Citation26 Overall, the size of majority of tumors was small (about 1 mm of diameter), and number of tumors per mouse was few (<5). But we found that the incidence of AOM-induced colorectal tumorigeneses ranged from 100% of mice from CC033 and CC057 strains to none of mice from CC001 and CC040 strains, suggesting that host genetics control AOM-induced colorectal tumors. Therefore, the tumor incidence was the only phenotype to be focused on. 14 strains whose tumor incidence was higher than 25% were defined as high CTS group, while the remaining 13 strains were defined as low CTS group ().
Figure 1. Identification of genetic variations and candidate genes associated with colorectal tumor susceptibility in CC mice.
Genetic factors associated with AOM-induced CTS and their implication in human CRC
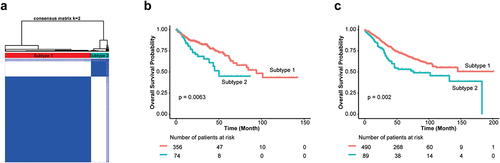
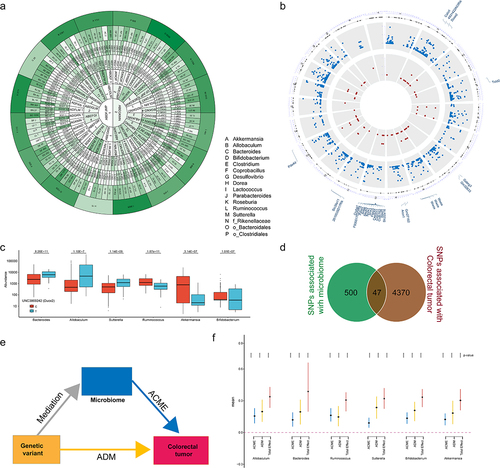
We performed GWAS across 27 CC strains and identified 4417 of 94,909 SNPs significantly associated with CTS (p < 10−12) (, Supplemental Table S2), containing 936 know human genes, 334 of which transcriptionally altered in human CRCs using TNMplotCitation36 (Supplemental Figure S1, Supplemental Table S3). Additionally, we used a cross-validation (leaving one strain out) approach to confirm these identified SNPs and candidate genes (Supplemental Figure S2). Kyoto Encyclopedia of Genes and Genomes (KEGG) revealed that 936 genes were significantly enriched in cGMP-PKG and calcium signaling pathway among others (, Supplemental Table S4). These pathways have been reported to play important roles in CRC development. To further assess clinical values of 334 candidate CTS genes, we clustered CRC patients based on their transcriptional expression in cancer and found that CRC patients were clustered into two groups that was determined by the optimal perceptual separation of consensus matrix in TCGA Colon Adenocarcinoma (TCGA-COAD) dataset (, Supplemental Figure S3), which are significantly associated with overall survival (OS) (). Importantly, applying this pre-built classifier model to the validation cohort (GSE39582) subtyped patients into two groups that had significant differences in OS with the same directionality (). These findings suggest that the candidate genes identified in CC mice have clinical implications in human CRC.
Figure 2. Subtyping human CRCs based on 334 CTS candidate genes.
Gut microbiota community structures correlated to CTS
Strong evidence showed that the GM plays a vital role in CRC development.Citation17,Citation18,Citation37 Therefore, we next determined whether any specific members of the early life GM could serve as biomarkers for predicting AOM-induced CTS. The reads from 16S rRNA sequencing analysis of fecal samples collected before AOM treatment from all 27 CC strains were mapped to 4364 OTUs corresponding to 157 bacterial genera (Supplemental Table S5). Compared to low CTS group, high CTS group had significantly higher richness and diversity of microbiota assessed by Shannon, Simpson and Inverse Simpson indices (p < .001, ). Principle coordinates analysis (PCoA) based on Bray–Curtis dissimilarity index (beta diversity) revealed a significant difference in GM composition and abundance between low and high CTS groups (PERMANOVA: p = .001, ).
Figure 3. Differences in gut microbiome between high and low CTS group.
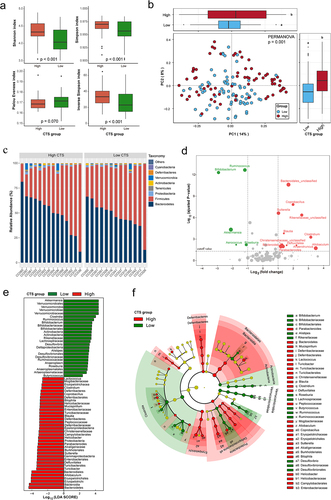
At the order level, we observed similar community structures between low and high CTS groups (). At the genus level, the abundances of 29 genera were significantly different between high and low CTS group (adjusted p < .05, , Supplemental Table S6). To validate these findings, we conducted high dimensional class comparisons using linear discriminant analysis (LDA) effect size (LEfSe) that detected many more differences in the predominance of bacterial communities between high and low CTS groups. The LDA showed a clear alteration of the microbiota characterized by significantly higher Allobaculum, Sutterella, and Turicibacter levels and lower Roseburia level in high CTS group (LDA score > 2, ). We consistently found that Akkermansia, Ruminococcus, Desulfovibrio, and Bifidobacterium genera were enriched in low CTS group, while Blautia, Coprobacillus, and Parabacteroides genera were enriched in high CTS group (). According to the bacterial community profiles, a hierarchical heatmap indicated that the most significantly different genera showed different patterns between high and low CTS groups (). Collectively, these findings suggest that early life gut microbiota community structures are significantly correlated with AOM-induced CTS in CC mice.
Identification of a gut microbial signature for predicting CTS
To explore the predictive value of the early life GM in CTS, we built a random forest classifier to distinguish the high and low CTS groups at the genus levels. We carried out 10-fold cross-validation with five repeats to evaluate the importance of genera. The optimal model was created utilizing 16 genera (Desulfovibrio, Akkermansia, Bacteroides, Sutterella, Roseburia, Ruminococcus, Lactococcus, Clostridiales_unclassified, Parabacteroides, Bifidobacterium, Allobaculum, Rikenellaceae_unclassified, Coprobacillus, Bacteroidales_unclassified, Clostridium, Dorea), which produced the best discriminatory power (). Random forest classification based on the relative abundance levels of 16 genera resulted in an area under the Receiver Operating Characteristic curve (AUC) of 0.933 (). These results suggest that specific gut microbes in early life may serve as biomarkers for predicting risk susceptibility to AOM-induced colon tumors.
Figure 4. The core genera for predicting CTS and their related function analysis.
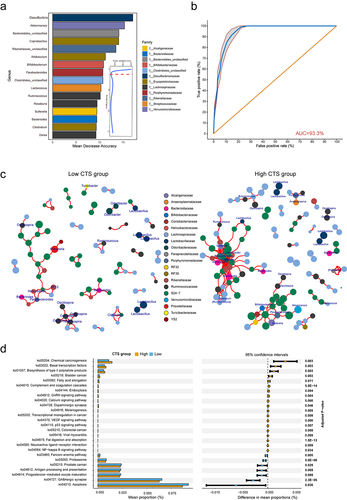
To further understand the microbial contributions to CTS, we examined the microbiota network and bacterial function prediction. We constructed a cross-niche microbial network for each CTS group and found large differences in the microbial networks (). In low CTS group, the interactions among genera occurred mostly within same family with small cluster size, whereas in high CTS group, the gut microbiota formed two densely connected modules composed of diverse genera (). One module was centered on “beneficial microbiota”, including Ruminococcus, Akkermansia, and Bifidobacterium. The other module was centered on Bacteroides, Sutterella, and Parabacteroides. This result suggests that there are less microbial connections in low CTS mice than in high CTS mice, indicating that host genetics associated with CTS impact microbial networks.
We further performed Tax4Fun2 analysis to predict and test the difference in metagenome functions of KEGG pathways between high and low CTS groups. The low CTS group was enriched with pathways associated with antigen processing and presentation, progesterone-mediated oocyte maturation, GABAergic synapse, and apoptosis. In contrast, the pathways related to chemical carcinogenesis, transcriptional misregulation in cancer, p53 signaling pathway, colorectal cancer, and NF-kappa B signaling pathway increased in high CTS group (adjusted p < 0.05, ). Taking all findings together, we conclude that host GM plays a critical role in the susceptibility to AOM-induced colorectal tumor in CC mice.
GM as a mediator between genetic variants and CTS
To investigate whether genetic variations control CTS through GM, we first identified the genetic variants associated with the 16 genera that predicted CTS (Supplemental Table S7). GWAS analysis discovered 547 SNPs significantly associated with the abundance of 5 or more of 16 genera (p < 10−6, , Supplemental Table S8). Among them, 47 SNPs overlapped with CTS SNPs (). 5 (DUOX2, PDE4D, WASF1, SOBP and SLC39A11) of corresponding genes for these 47 SNPs were among 334 CRC transcriptionally altered genes. To further investigate the potential causal links between GM and CTS, we then performed mediation analysis () to determine whether genetic variants indirectly contribute to CTS by controlling the abundance of the 16 genera. Mediation analysis revealed that Ruminococcus, Akkermansia, Allobaculum, Bacteroides, Sutterella, and Bifidobacterium function as mediators for the effect of SNP UNC3869242 within Duox2 on CTS (). Similar findings were observed for other 4 gene SNPs (Supplemental Figure S4). These results indicate that the effect of genetic variants on CTS is at least partially mediated by the GM, suggesting that the host genetics and GM interact to play an important role in CTS.
Figure 5. Gut microbiome partially mediates the effects of genetics on CTS.
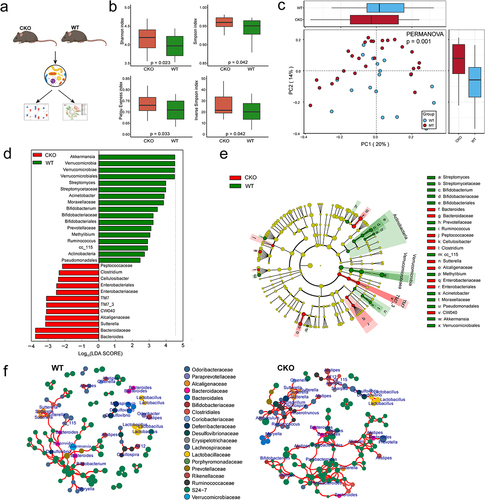
GM composition alteration in Duox2 deficient mice
Duox2 is one of five candidate genes that may control both CTS and the abundance of many genera and are transcriptionally altered in human CRCs. Therefore, we next investigated the role of Duox2 in CRC development and GM composition.
DUOX2 is a critical modulator in mutualistic host-microbiota interactions that are fundamental in maintaining gut immune homeostasis, which has been reported to be involved in colitis-associated colorectal tumorigenesis.Citation38,Citation39 Our findings in CC mice suggest contribution of Duox2 to colorectal tumor development is possible via modulation of the GM composition. Experimental models of colitis-associated tumorigenesis are indispensable to improve our understanding of intestinal pathophysiology and host-microbiota interactions. Inflammation-dependent tumor growth can be investigated by combining the administration of AOM with the inflammatory agent dextran sodium sulfate (DSS) in drinking water. AOM/DSS Chemically induced model that replicates the aspect of colitis associated tumorigenesis is widely used.Citation40,Citation41 The knockout of Duox2 gene in mice causes both hypotension and bradycardia basally.Citation39 To exclude the possibility that these deficiencies confound our findings, we generated intestine-specific Duox2-deficient mice by crossing Duox2fl/fl mice with Villin-Cre transgenic mice, which specifically deleted Duox2 from intestinal epithelia (denoted as Duox2 CKO mice) to investigate the effect of Duox2 deficiency on composition of GM (genotype by PCR shown in Supplemental Figure S5). 16S rRNA sequencing analysis of the feces from Duox2 wildtype (WT) and CKO mice () revealed that depletion of Duox2 in intestinal cells significantly altered both alpha and beta diversity in the GM (). Additionally, we observed significant taxonomic differences in the feces microbiome between Duox2 WT and CKO mice (, Supplemental Table S9). The relative abundance of Bifidobacterium and Akkermansia genera were significantly reduced, while the abundance levels of Bacteroides and Sutterella genera were significantly increased in CKO mice compared to WT mice (). Moreover, we found a large difference in the microbial networks between Duox2 WT and CKO mice. Contrary to weaker gut microbiota interactions in Duox2 WT mice, the gut microbiota in Duox2 CKO formed two densely connected modules composed of diverse genera (). One module was centered on “beneficial microbiota”, including Lactobacillus and Bifidobacterium. The other module was centered on Bacteroides, Sutterella, and Parabacteroides, which are reported to be related to CTS. Thus, we considered this module to consist of “pathogenic microbiota” (). Collectively, we conclude that Duox2 may regulate the composition of GM.
Figure 6. Depletion of Duox2 alters gut microbiome structure in mice.
Interplay between DUOX2 and GM contributes to CTS
We next investigated whether interplay between DUOX2 and GM contributed to CTS. Duox2 WT and CKO mice were administered with AOM and DSS to establish a colitis-associated tumorigenesis (). There was similar CTS between CKO and WT mice evidenced by the number, size, and tumor load of macroscopic polyps between CKO and WT mice (p > .05, , Supplemental Figure S6). Since significant alteration of the GM composition was found in Duox2 deficient mice, we investigated the influence of GM on contribution of Duox2 loss to CTS. Therefore, before treatment of AOM and DSS, mice were treated with antibiotic (ABX), 2 weeks prior to induction with AOM and DSS. The efficacy of ABX was verified (). After AOM and DSS administration, there was less CTS in Duox2 CKO mice than WT littermates evidenced by significant lower number, size, and tumor load of macroscopic polyps (p < .05, , Supplemental Figure S6). These data demonstrated that the contribution of DUOX2 depletion to colon tumorigenesis is influenced by GM.
Figure 7. Interplay of Duox2 with gut microbiota and contributed to colorectal tumorigenesis susceptibility.
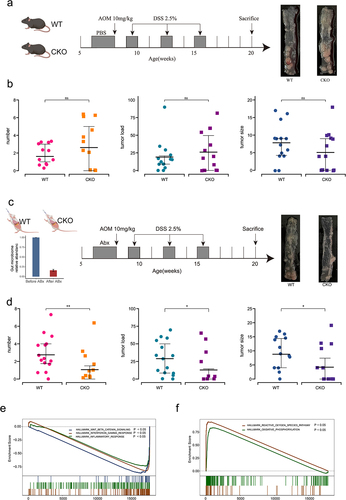
To discover underlying mechanisms by which Duox2 contributes to colorectal tumor development, we conducted RNA-Seq analysis of colon-derived RNA from Duox2 WT and CKO mice. Depletion of Duox2 led to the differentiated expression of 48 genes (adjusted p values < .05 and |log2(FC)| > 1.0; Supplemental Figure S7, Supplemental Table S10). Gene set enrichment analysis (GSEA) revealed that the knockout of Duox2 resulted in downregulation of the Wnt/β-Catenin, inflammatory response and interferon-g response pathways and increased activation in reactive oxygen species and oxidative phosphorylation pathways (), all of which play an important role in both tumor development and gut microbiome composition.
Evaluation of DUOX2 and its associated gut microbiota in human CRC
To evaluate DUOX2 and its associated gut microbiota in human CRC, we conducted a series of bioinformatics analysis. In the GMrepo database, we found that compared with healthy donors, patients with CRC had significantly lower levels of Bifidobacterium, Ruminococcus, and Akkermansia (p < 0.001), and higher levels of Allobaculum, Bacteroides, and Sutterella (p < .001, ), consistent with our findings in CC mice.
Figure 8. Validation of core different abundant taxa and the function of DUOX2 according to public data.
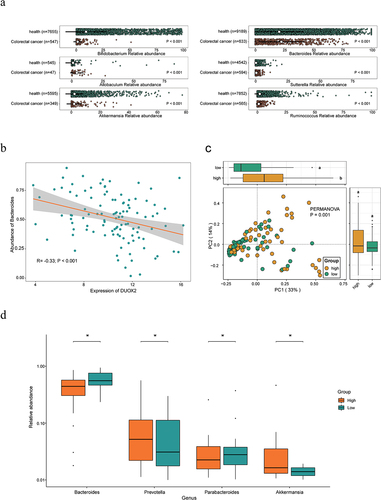
In The Cancer Microbiome Atlas (TCMA),Citation42 we found that DUOX2 expression is significantly negatively correlated with Bacteroides abundance (, Supplemental Table S11). To explore the association of DUOX2 expression with the GM community, 106 cases of CRC patients were divided into two groups based on the median of DUOX2 expression in CRC tissues, defined as DUOX2 high and low expression groups (Supplemental Table S11). PCoA analysis revealed a significant difference in GM community between the two groups (p = .001, PERMANOVA, ). The boxplot showed that the abundance of Akkermansia and Prevotella genera was significantly higher, while the abundance of Bacteroides and Parabacteroides genera was significantly lower in high group than that in low group (p < .05, , Supplemental Table S11), consistent with our findings in Duox2 CKO mice.
Discussion
Using the CC mouse population-based model together with the AOM-induced colorectal tumor model, we deciphered the contribution of host genetics, microbiome, and their interactions to colorectal cancer risk. Many genetic and microbial factors were identified to control AOM-induced CTS. We provide evidence for interactions between host genetics and GM, and meditation effects of microbes on the genetic contribution to CTS in both population-based and gene knockout mouse models. We further demonstrated the genes and microbes identified in this CC mouse population study have an impact on human CRC.
This study showed that the CC mouse population, equivalent to a genetically diverse human population, provides a useful resource for revealing a genetic architecture of AOM-induce CTS. 4,417 SNPs corresponding to 936 known human genes, have been identified to be significantly associated with AOM-induced CTS, including the majority of the loci identified in previous studies.Citation9,Citation10 Especially our findings are comparable to a recent study in 40 mouse inbred strains,Citation10 consistent with the report that CC mice captures 90% of genetic variations in laboratory inbred mice.Citation24 The results from the CC mice extend the catalog of CTS genes that can be used to evaluate human CRC susceptibility. Additionally, 75 of 936 genes have been found to be associated with human CRCs by GWAS (Supplemental Table S3). Moreover, 334 of 936 genes have transcriptionally altered in human CRCs. Genetic variants in Duox2 were found to be associated with human CRC through GWAS. Moreover, the transcriptional expression of human 334 genes classified CRC patients into two different prognostic groups. These suggest that the findings in this CC mouse population study can be translated into humans.
Overwhelming evidence suggests that the GM plays a critical role in CRC development.Citation16,Citation18,Citation43 In this study, we found that the abundance levels of 16 genera were significantly associated with AOM-induced CTS. The relative abundance levels of 16 genera predict high or low CTS with AUC of 0.933. 13 of 16 genera have been reported to be altered in human CRC.Citation37,Citation44 Specifically, abundance of Bacteroides was elevated in colorectal cancer patients,Citation37 consistent with our finding that Bacteroides was more abundant in high CTS group. Increased tumorigenesis has been reported in mice colonized with Bacteroides through an IL-23-dependent and STAT3-dependent manner associated with TH17 activation.Citation45 Bacteroides are not all the same – a specific strain of B. fragilis produces a toxin that induces IL17. Also, we cannot exclude the possibility that there are other non-toxigenic strains that may promote tumorigenesis via other mechanisms. Bifidobacterium is more abundant in the low CTS group, consistent with previous reports that Bifidobacterium species have anti-cancer effects in CRC.Citation46 Interestingly, Bifidobacterium is one of the most used probiotics and has also been reported to enhance the efficacy of cancer immunotherapies.Citation47 Further characterization of these putative probiotic species identified in this study can offer promising potentials for preventative and therapeutic treatment of human CRC.
DUOX2 is a critical modulator in mutualistic host-microbiota interactions, which has been reported to be involved in colitis-associated colorectal tumorigenesis. Many reported studies have showed that the gut microbiota engages different signaling pathways including MyD88, p38 MAPK pathways to induce Dual Oxidase 2 (DUOX2) expression in the ileum and colon epithelium.Citation48 Epithelium is a first line of defense against microorganisms in the gut. Reactive oxygen species (ROS) play an important role in controlling the normal gut microbiota and pathogenic bacteria. DUOX2 is an important source of hydrogen peroxide in the small and large intestine, and the gut microbiota can induce DUOX2 expression.Citation48 The microbiota activates TLR4 which in turn stimulates epithelial ROS through DUOX2. Increased epithelial ROS production is associated with pro-tumorigenic microbiota. Both an altered microbiota and epithelial ROS are essential for colonic tumorigenesis.Citation39 In this study, we discovered dual functions of DUOX2 on CRC development, which provides a new insight into mechanisms of DUOX2 for tumor development. Depletion of DUOX2 significantly altered intestinal homeostasis through a decrease in “beneficial” gut microbes and an increase in “harmful” gut microbes. Moreover, we showed that GM influences the contribution of DUOX2 depletion to colon tumorigenesis in an inflammatory model of colon cancer. The interrelationship between DUOX2 and tumor-promoting microbiota requires a two-pronged strategy to reduce the risk of dysplasia in colitis-associated colorectal tumorigenesis.Citation49 Although the causal effects of other genetic variants on GM and CTS still require further investigation, our findings suggest that host genetics and GM interactions play an important role in CRC development.
While this study successfully identified novel targets for CRC prevention and treatment, there were some limitations. First, we used 16S rRNA gene sequencing to study the metagenomic composition. A key limitation of 16S rRNA gene sequencing is the difficulty in determining the exact microbial species. Therefore, we limited our analysis to genera level analysis. One specific limitation of amplification-based 16S rRNA sequencing is the introduction of PCR and/or sequencing errors, that may result in sequence classification errors, and ultimately the detection of similar, but incorrectly identified microorganisms, or the mistaken belief that new microorganisms have been found. To address this problem, we used OTU clustering for this study since we explored the large-scale biodiversity across CC strains to link the microbiome to colon tumor susceptibility. Future studies should incorporate metagenomic sequencing to detect less abundant genera that may play an important role in CTS. Second, our study focused on the role of Duox2 in mediating the effects of GM on CTS. In this study, we identified additional candidate genes that are likely to contribute to CTS which should be further investigated.
In conclusion, we used the population-based CC mouse model together with AOM-induced CRC protocol to identify many existing and new genetic and microbial determinants of AOM-induced CTS and used a conditional mouse knockout model to validate the importance of host gene-microbiota in colorectal tumorigenesis. DUOX2 plays dual functional roles in CRC development, so clinically targeting DUOX2 for the treatment of gut associated diseases must consider both the autonomous and non-autonomous functions. Overall, the findings in this study shed light on directions for future applications in personalized CRC prevention and treatment.
Materials and Methods
CC mice and AOM treatment
All CC mice were purchased from the Systems Genetics Core Facility at the University of North Carolina. Mice were acclimated at the Lawrence Berkeley National Laboratory (LBNL) for 8 weeks prior to the initiation of breeding. Offspring were weaned at 21 days of age. Mice were raised in groups of 2–5 mice per cage in individually ventilated cages in a light-controlled room with 12:12 h light/dark cycle. All mice were maintained on standard chow (PicoLab Rodent diet 5053). Since 10 mg/kg of AOM is lethal to some CC strains,Citation50 426 11-week-old mice were injected intraperitoneally once weekly with 5 mg/kg of AOM (Sigma, St. Louis, MO) for six weeks for tumor induction and were monitored for one year (). Finally, a total of 355 surviving mice from 30 CC strains were used in this study (Supplemental Table S1). Three strains with less than 6 mice were excluded from analysis. This study was carried out in strict accordance with the Guide to the Care and Use of Laboratory Animals of the National Institutes of Health. The Animal Welfare and Research Committee at Lawrence Berkeley National Laboratory approved the animal use protocol.
GWAS on CTS
GWAS analysis has been described as previously.Citation30,Citation50,Citation51 Briefly, CC strains were divided into high and low CTS groups based on tumor incidence. At each SNP, the Chi-Square test was used to assess the significance of associations between tumor susceptibility and allele types. p < 10−12 was criteria for significance based on permutation analysis. Putative candidate genes were defined as those genes containing a significant SNP within the boundaries of the gene sequence (http://www.informatics.jax.org/).
16S rRNA sequencing analysis of fecal samples
Fecal samples were collected from individual cages 16 h following cage change prior to the first AOM injection and were stored at −80°C until microbial analysis. At least four independent cages were sampled for each CC strain. We extracted genomic DNA from the homogenized fecal samples, amplified 16S rRNA by PCR using primers targeting the V4 region, performed 16S rRNA sequencing by Illumina MiSeq and analyzed the data as previously described.Citation30,Citation50,Citation51 Briefly, the sequence reads were quality-filtered using QIIME2 (version 2019.7).Citation52 Filtered reads were clustered into operational taxonomic units (OTUs), using an open reference picking process with a threshold of 97% similarity to the reference database (Greengenes OTUs (16S) v13_8). Mouse 16S rRNA sequence data from the CC mouse cohort, which was used in our previous study,Citation30 is available on OSF (https://osf.io/jbt5g/).
Association analysis of metataxonomics with CTS
The PERMANOVA method was used to test for differences in bacterial community composition, as quantified by weighted UniFrac distance between samples. Relative abundance was assessed using the most specific taxonomic assignment available for each OTU. Taxa were selected for testing if the mean abundance exceeded 1% among the samples to be analyzed. Differences in the alpha diversity and microbiome features between high and low CTS groups were assessed by Mann–Whitney test and/or linear discriminant analysis of effect size (LEfSe). The random forest classification model with 10 cross-validation iterations was used to evaluate the effectiveness of the microbial signature for predicting CTS. The microbial co-occurrence networks were established using Spearman’s rank correlations and visualized in ggplot2 package (version 3.2.1). Tax4Fun2 (version 1.1.5) was used to predict metagenome functional content and test the difference of Kyoto Encyclopedia of Genes and Genomes (KEGG) pathways between high and low CTS groups.
Mediation analysis of GM between genetic variants and CTS
Mediation analysis is a statistical model to determine whether the relationship between two variables (e.g., genetic variant and CTS) is mediated through a third variable (e.g., GM), which was performed using mediation package (version 4.4.7) and visualized using ggplot2 package (version 3.2.1) in R (version 3.5.0).
Conditional knockout mice and AOM/DSS-induced colorectal tumorigeneses
We generated intestine-specific Duox2-deficient mice by crossing Duox2 floxed (Duox2fl/fl) mice with Villin-Cre transgenic mice, resulting in deletion of Duox2 exon 4–6 in the intestine cell. The feces were collected from Duox2fl/fl, Villin-Cre (CKO) and Duox2fl/fl (WT) mice for 16S rRNA analysis. The GM composition was compared between CKO and WT mice. To minimize the effect of recolonization of the GI tract on tumor development after antibiotic (ABX) clearance of the microbiome, we used the AOM/DSS protocol to accelerate colorectal tumor development. For AOM/DSS-induced colorectal tumorigeneses, CKO and WT mice at 8-weeks of age were given an initial intraperitoneal injection of 10 mg/kg AOM. After 1 week, mice were given 3% DSS (MP Biomedicals) in drinking water for 1 week, followed by normal drinking water for 2 weeks. This cycle was repeated 3 times. In an additional study, before AOM/DSS induction, mice were treated with an antibiotic cocktail containing 1.86 mg/kg ampicillin, 1.86 mg/kg neomycin sulfate, 1.2 mg/kg metronidazole, and 0.96 mg/kg vancomycin in 300 μL double distilled water to deplete the gut microbiota.Citation53 All mice were euthanized at 20-weeks of age for assessing tumor development. This study was approved by the Institutional Animal Care and Bioethical Committee of Zhejiang University.
RNA-seq, differentiated gene, and gene enrichment analysis
Colon samples from WT and CKO mice were dissected and stored at −80°C. Total RNA was extracted using the mirVana miRNA Isolation Kit (Ambion) following the manufacturer’s protocol. RNA integrity was evaluated using the Agilent 2100 Bioanalyzer (Agilent Technologies). The libraries were constructed using TruSeq Stranded mRNA LTSample Prep Kit (Illumina) according to the manufacturer’s instructions. Then these libraries were sequenced on the Illumina sequencing platform (HiSeqTM 2500) and 125bp/150bp paired-end reads were generated. Raw reads were processed using Trimmomatic. Then, the clean reads were mapped to reference genome using hisat2. DESeq2 package (version 1.22.2) was used to identify differentially expressed genes (DEGs) between WT and CKO groups. The adjusted p values < .05 and |log2(fold change (FC))| > 1.0 were considered as significance. GSEA was used to analyze the functions of DEGs using ClusterProfiler package (version 3.8.1). The annotated gene collections downloaded from the Molecular Signatures Database (MSigDB v7.0) for H (hallmark gene sets).
Data analysis of human colorectal cancer patients using public database
The difference in gene expression between normal and colon adenocarcinoma tissues was assessed using TNMplot (https://tnmplot.com/analysis/).Citation36 TCGA-COAD transcriptome and clinical data were downloaded from the cBioPortal (https://www.cbioportal.org/).Citation54,Citation55 The GSE39582 cohort was downloaded from Gene Expression Omnibus (GEO) database. There was no additional modification in the downloaded data during our analyses. Human gut metagenomic data was obtained from GMrepo (https://gmrepo.humangut.info/home). GMrepo organizes the collected human gut metagenomes according to their associated phenotypes and includes all possible related data. Using this database, we identified differential genus abundance distribution between two phenotypes (health versus colorectal cancer) on a per-project basis for selected projects. TCGA intestinal microbiome data was obtained from The Cancer Microbiome Atlas (TCMA) (https://tcma.pratt.duke.edu/). TCMA was a statistical model to analyze the prevalence of microbial compositions for TCGA sequencing data across sample types. TCMA enables paired microbial-host transcriptome analyses that identify associations between microbial and host gene expression patterns and pathways. The level-3 RNA-sequencing data in the TCGA Colon Adenocarcinoma (TCGA-COAD) project were retrieved from UCSC xena (https://xenabrowser.net/).
Statistical analysis
CRC patients were stratified using consensus clustering (ConsensusClusterPlus package in R, version 1.50.0) with k-means clustering, Pearson’s correlation and 500 bootstrapping iterations; and the optimal number of subtypes was determined by the consistency of cluster assignment (i.e., the consensus matrix). The difference in overall survival (OS) was assessed by Kaplan-Meier analysis (survminer package in R, version 0.4.8) and log-rank test (survival package in R, version 3.2–3). The t-test or Mann-Whitney test were employed to analyze differences in the abundance between two groups for normally or not normally distributed data, respectively. The p values were adjusted using the method of Benjamini and Hochberg with the function p.adjust in R. The correlation matrix between the gut microbiota and gene expression was generated using Pearson’s correlation coefficient. The p or adjusted p value < .05 was taken as statistically significant. All data analyses were performed, and plots were generated using R software (version 3.5.0).
Author contribution
JHM, AMS and YY conceptualized and designed the study. DL, CZ, MY, LH, NZ, AMS and JHM performed animal experiments, quantified colon tumor development in mice, and collected fecal and tissues. SEC performed 16 sRNA sequencing. DL, CZ and HC performed formal analysis including bioinformatics and statistical analyses. HC, DWT, AMS, JHM and YY were involved in critical review of the data and interpretation of results. DL, CZ, HC and JHM created the manuscript figures and Supplemental materials. DL and CZ drafted the manuscript. All authors edited, reviewed, revised, and approved the manuscript text. JHM, CZ and YY acquired funding for the study.
Consent for publication
The authors consent to publish this work.
Ethics approval and consent to participate
All animal experiments were approved by the Institutional Animal Welfare and Research Committee at Lawrence Berkeley National Laboratory or the Institutional Animal Care and Bioethical Committee of Zhejiang University.
AOM_ColonTumor_GM_SupplementaryFigsTables.docx
Download MS Word (895.4 KB)Acknowledgments
We thank staff at the LBNL Animal Facility for maintenance of Collaborative Cross mice.
Disclosure statement
No potential conflict of interest was reported by the author(s).
Data availability statement
Mouse gut microbiome 16S rRNA gene sequencing data and RNA-Seq data from Doux2 knockout mice are are available in the National Center for Biotechnology Information (NCBI) BioProject Repository (https://www.ncbi.nlm.nih.gov/bioproject) under the BioProject “PRJNA802804”. Mouse gut microbiome 16S rRNA gene sequencing data from CC mouse cohort is available on OSF (https://osf.io/jbt5g/).Citation30 The mouse data has been included in Supplemental Table S1. The numeric counts table at genus level and corresponding taxonomic classifications have all been included as Supplemental Table S5.
Supplementary material
Supplemental data for this article can be accessed online at https://doi.org/10.1080/19490976.2024.2341647
Correction Statement
This article has been corrected with minor changes. These changes do not impact the academic content of the article.
Additional information
Funding
References
- Siegel RL, Miller KD, Goding Sauer A, Fedewa SA, Butterly LF, Anderson JC, Cercek A, Smith RA, Jemal A. Colorectal cancer statistics, 2020. CA A Cancer J Clinicians. 2020;70(3):145–20. doi:10.3322/caac.21601.
- Huyghe JR, Bien SA, Harrison TA, Kang HM, Chen S, Schmit SL, Conti DV, Qu C, Jeon J, Edlund CK. et al. Discovery of common and rare genetic risk variants for colorectal cancer. Nat Genet. 2019;51(1):76–87. doi:10.1038/s41588-018-0286-6.
- Law PJ, Timofeeva M, Fernandez-Rozadilla C, Broderick P, Studd J, Fernandez-Tajes J, Farrington S, Svinti V, Palles C, Orlando G. et al. Association analyses identify 31 new risk loci for colorectal cancer susceptibility. Nat Commun. 2019;10(1):2154. doi:10.1038/s41467-019-09775-w.
- Peltomaki P, Olkinuora A, Nieminen TT. Updates in the field of hereditary nonpolyposis colorectal cancer. Expert Rev Gastroenterol Hepatol. 2020;14(8):707–720. doi:10.1080/17474124.2020.1782187.
- Valle L, de Voer RM, Goldberg Y, Sjursen W, Forsti A, Ruiz-Ponte C, Caldés T, Garré P, Olsen MF, Nordling M. et al. Update on genetic predisposition to colorectal cancer and polyposis. Mol Aspects Med. 2019;69:10–26. doi:10.1016/j.mam.2019.03.001.
- Murphy N, Moreno V, Hughes DJ, Vodicka L, Vodicka P, Aglago EK, Gunter MJ, Jenab M. Lifestyle and dietary environmental factors in colorectal cancer susceptibility. Mol Aspects Med. 2019;69:2–9. doi:10.1016/j.mam.2019.06.005.
- Toma M, Belusica L, Stavarachi M, Apostol P, Spandole S, Radu I, Cimponeriu D. Rating the environmental and genetic risk factors for colorectal cancer. J Med Life. 2012;5:152–159.
- Vernia F, Longo S, Stefanelli G, Viscido A, Latella G. Dietary factors modulating colorectal carcinogenesis. Nutrients. 2021;13(1):143. doi:10.3390/nu13010143.
- Mao JH, Balmain A. Genomic approaches to identification of tumour-susceptibility genes using mouse models. Curr Opin Genet Dev. 2003;13(1):14–19. doi:10.1016/S0959-437X(03)00005-4.
- Bissahoyo AC, Xie Y, Yang L, Pearsall RS, Lee D, Elliott RW, Demant P, McMillan L, Pardo-Manuel de Villena F, Angel JM. et al. A new polygenic model for nonfamilial colorectal cancer inheritance based on the genetic architecture of the azoxymethane-induced mouse model. Genetics. 2020;214(3):691–702. doi:10.1534/genetics.119.302833.
- Bhatt AP, Redinbo MR, Bultman SJ. The role of the microbiome in cancer development and therapy. CA Cancer J Clin. 2017;67(4):326–344. doi:10.3322/caac.21398.
- Bubier JA, Chesler EJ, Weinstock GM. Host genetic control of gut microbiome composition. Mamm Genome. 2021;32(4):263–281. doi:10.1007/s00335-021-09884-2.
- Zhou Y, Gao H, Mihindukulasuriya KA, La Rosa PS, Wylie KM, Vishnivetskaya T, Podar M, Warner B, Tarr PI, Nelson DE. et al. Biogeography of the ecosystems of the healthy human body. Genome Biol. 2013;14(1):R1. doi:10.1186/gb-2013-14-1-r1.
- Wang J, Jia H. Metagenome-wide association studies: fine-mining the microbiome. Nat Rev Microbiol. 2016;14(8):508–522. doi:10.1038/nrmicro.2016.83.
- Feng Q, Liang S, Jia H, Stadlmayr A, Tang L, Lan Z, Zhang D, Xia H, Xu X, Jie Z. et al. Gut microbiome development along the colorectal adenoma–carcinoma sequence. Nat Commun. 2015;6(1):6528. doi:10.1038/ncomms7528.
- Song M, Chan AT, Sun J. Influence of the gut microbiome, diet, and environment on risk of colorectal cancer. Gastroenterology. 2020;158(2):322–340. doi:10.1053/j.gastro.2019.06.048.
- Clay SL, Fonseca-Pereira D, Garrett WS. Colorectal cancer: the facts in the case of the microbiota. J Clin Invest. 2022;132(4):132. doi:10.1172/JCI155101.
- Rebersek M. Gut microbiome and its role in colorectal cancer. BMC Cancer. 2021;21(1):1325. doi:10.1186/s12885-021-09054-2.
- Weissbrod O, Rothschild D, Barkan E, Segal E. Host genetics and microbiome associations through the lens of genome wide association studies. Curr Opin Microbiol. 2018;44:9–19. doi:10.1016/j.mib.2018.05.003.
- Fyhrquist N, Muirhead G, Prast-Nielsen S, Jeanmougin M, Olah P, Skoog T, Jules-Clement G, Feld M, Barrientos-Somarribas M, Sinkko H. et al. Microbe-host interplay in atopic dermatitis and psoriasis. Nat Commun. 2019;10(1):4703. doi:10.1038/s41467-019-12253-y.
- Onaciu A, Munteanu R, Munteanu VC, Gulei D, Raduly L, Feder RI, Pirlog R, Atanasov AG, Korban SS, Irimie A. et al. Spontaneous and induced animal models for cancer research. Diagnostics (Basel). 2020;10(9):10. doi:10.3390/diagnostics10090660.
- Kaiser S, Park YK, Franklin JL, Halberg RB, Yu M, Jessen WJ, Freudenberg J, Chen X, Haigis K, Jegga AG. et al. Transcriptional recapitulation and subversion of embryonic colon development by mouse colon tumor models and human colon cancer. Genome Biol. 2007;8(7):R131. doi:10.1186/gb-2007-8-7-r131.
- Uronis JM, Herfarth HH, Rubinas TC, Bissahoyo AC, Hanlon K, Threadgill DW. Flat colorectal cancers are genetically determined and progress to invasion without going through a polypoid stage. Cancer Res. 2007;67(24):11594–11600. doi:10.1158/0008-5472.CAN-07-3242.
- Churchill GA, Airey DC, Allayee H, Angel JM, Attie AD, Beatty J, Beavis WD, Belknap JK, Bennett B, Berrettini W. et al. The collaborative cross, a community resource for the genetic analysis of complex traits. Nat Genet. 2004;36:1133–1137.
- Threadgill DW, Hunter KW, Williams RW. Genetic dissection of complex and quantitative traits: from fantasy to reality via a community effort. Mamm Genome. 2002;13(4):175–178. doi:10.1007/s00335-001-4001-y.
- Zou F, Gelfond JA, Airey DC, Lu L, Manly KF, Williams RW, Threadgill DW. Quantitative trait locus analysis using recombinant inbred intercrosses: theoretical and empirical considerations. Genetics. 2005;170(3):1299–1311. doi:10.1534/genetics.104.035709.
- Dorman A, Binenbaum I, Abu-Toamih Atamni HJ, Chatziioannou A, Tomlinson I, Mott R, Iraqi FA. Genetic mapping of novel modifiers for ApcMin induced intestinal polyps’ development using the genetic architecture power of the collaborative cross mice. BMC Genomics. 2021;22(1):566. doi:10.1186/s12864-021-07890-x.
- Lawley KS, Rech RR, Elenwa F, Han G, Perez Gomez AA, Amstalden K, Welsh CJ, Young CR, Threadgill DW, Brinkmeyer-Langford CL. et al. Host genetic diversity drives variable central nervous system lesion distribution in chronic phase of Theiler’s Murine Encephalomyelitis Virus (TMEV) infection. PLOS ONE. 2021;16(8):e0256370. doi:10.1371/journal.pone.0256370.
- Luo YS, Cichocki JA, Hsieh NH, Lewis L, Wright FA, Threadgill DW, Chiu WA, Rusyn I. Using collaborative cross mouse population to fill data gaps in risk assessment: a case study of population-based analysis of toxicokinetics and kidney toxicodynamics of tetrachloroethylene. Environ Health Perspect. 2019;127(6):67011. doi:10.1289/EHP5105.
- Mao JH, Kim YM, Zhou YX, Hu D, Zhong C, Chang H, Brislawn CJ, Fansler S, Langley S, Wang Y. et al. Genetic and metabolic links between the murine microbiome and memory. Microbiome. 2020;8(1):53. doi:10.1186/s40168-020-00817-w.
- Milhem A, Abu Toamih-Atamni HJ, Karkar L, Houri-Haddad Y, Iraqi FA. Studying host genetic background effects on multimorbidity of intestinal cancer development, type 2 diabetes and obesity in response to oral bacterial infection and high-fat diet using the collaborative cross (CC) lines. Anim Models and Exp Med. 2021;4(1):27–39. doi:10.1002/ame2.12151.
- Mosedale M, Cai Y, Eaddy JS, Kirby PJ, Wolenski FS, Dragan Y, Valdar W. Human-relevant mechanisms and risk factors for TAK-875-Induced liver injury identified via a gene pathway-based approach in collaborative cross mice. Toxicology. 2021;461:152902. doi:10.1016/j.tox.2021.152902.
- Noll KE, Ferris MT, Heise MT. The collaborative cross: a systems genetics resource for studying host-pathogen interactions. Cell Host Microbe. 2019;25(4):484–498. doi:10.1016/j.chom.2019.03.009.
- Wang P, Wang Y, Langley SA, Zhou YX, Jen KY, Sun Q, Brislawn C, Rojas CM, Wahl KL, Wang T. et al. Diverse tumour susceptibility in collaborative cross mice: identification of a new mouse model for human gastric tumourigenesis. Gut. 2019;68(11):1942–1952. doi:10.1136/gutjnl-2018-316691.
- Zeiss CJ, Gatti DM, Toro-Salazar O, Davis C, Lutz CM, Spinale F, Stearns T, Furtado MB, Churchill GA. Doxorubicin-induced cardiotoxicity in Collaborative Cross (CC) mice recapitulates individual cardiotoxicity in humans. G3 (Bethesda). 2019;9(8):2637–2646. doi:10.1534/g3.119.400232.
- Bartha A, Gyorffy B. Tnmplot.com: a web tool for the comparison of gene expression in normal, tumor and metastatic tissues. Int J Mol Sci. 2021;22(5):22. doi:10.3390/ijms22052622.
- Flemer B, Lynch DB, Brown JM, Jeffery IB, Ryan FJ, Claesson MJ, O’Riordain M, Shanahan F, O’Toole PW. Tumour-associated and non-tumour-associated microbiota in colorectal cancer. Gut. 2017;66(4):633–643. doi:10.1136/gutjnl-2015-309595.
- Zhang X, Han J, Feng L, Zhi L, Jiang D, Yu B, Zhang Z, Gao B, Zhang C, Li M. et al. DUOX2 promotes the progression of colorectal cancer cells by regulating the AKT pathway and interacting with RPL3. Carcinogenesis. 2021;42(1):105–117. doi:10.1093/carcin/bgaa056.
- Burgueno JF, Fritsch J, Gonzalez EE, Landau KS, Santander AM, Fernandez I, Conner GE, Abreu MT. Epithelial TLR4 signaling activates DUOX2 to induce microbiota-driven tumorigenesis. Gastroenterology. 2020;158(6):S–174. doi:10.1016/S0016-5085(20)31122-7.
- Grasberger H, Gao J, Nagao-Kitamoto H, Kitamoto S, Zhang M, Kamada N, Eaton KA, El-Zaatari M, Shreiner AB, Merchant JL. et al. Increased expression of DUOX2 is an epithelial response to mucosal dysbiosis required for immune homeostasis in mouse intestine. Gastroenterology. 2015;149(7):1849–1859. doi:10.1053/j.gastro.2015.07.062.
- Aviello G, Knaus UG. NADPH oxidases and ROS signaling in the gastrointestinal tract. Mucosal Immunol. 2018;11(4):1011–1023. doi:10.1038/s41385-018-0021-8.
- Dohlman AB, Arguijo Mendoza D, Ding S, Gao M, Dressman H, Iliev ID, Lipkin SM, Shen X. The cancer microbiome atlas: a pan-cancer comparative analysis to distinguish tissue-resident microbiota from contaminants. Cell Host Microbe. 2021;29(2):281–98 e5. doi:10.1016/j.chom.2020.12.001.
- Wong SH, Yu J. Gut microbiota in colorectal cancer: mechanisms of action and clinical applications. Nat Rev Gastroenterol Hepatol. 2019;16(11):690–704. doi:10.1038/s41575-019-0209-8.
- Kwong TNY, Wang X, Nakatsu G, Chow TC, Tipoe T, Dai RZW, Tsoi KKK, Wong MCS, Tse G, Chan MTV. et al. Association between bacteremia from specific microbes and subsequent diagnosis of colorectal cancer. Gastroenterology. 2018;155(2):383–90 e8. doi:10.1053/j.gastro.2018.04.028.
- Wu S, Rhee KJ, Albesiano E, Rabizadeh S, Wu X, Yen HR, Huso DL, Brancati FL, Wick E, McAllister F. et al. A human colonic commensal promotes colon tumorigenesis via activation of T helper type 17 T cell responses. Nat Med. 2009;15(9):1016–1022. doi:10.1038/nm.2015.
- Asadollahi P, Ghanavati R, Rohani M, Razavi S, Esghaei M, Talebi M, Pizzo SV. Anti-cancer effects of Bifidobacterium species in colon cancer cells and a mouse model of carcinogenesis. PLOS ONE. 2020;15(5):e0232930. doi:10.1371/journal.pone.0232930.
- Sun S, Luo L, Liang W, Yin Q, Guo J, Rush AM, Lv Z, Liang Q, Fischbach MA, Sonnenburg JL. et al. Bifidobacterium alters the gut microbiota and modulates the functional metabolism of T regulatory cells in the context of immune checkpoint blockade. Proc Natl Acad Sci U S A. 2020;117(44):27509–27515. doi:10.1073/pnas.1921223117.
- Sommer F, Backhed F. The gut microbiota engages different signaling pathways to induce Duox2 expression in the ileum and colon epithelium. Mucosal Immunol. 2015;8(2):372–379. doi:10.1038/mi.2014.74.
- Kordahi MC, Stanaway IB, Avril M, Chac D, Blanc MP, Ross B, Diener C, Jain S, McCleary P, Parker A. et al. Genomic and functional characterization of a mucosal symbiont involved in early-stage colorectal cancer. Cell Host Microbe. 2021;29(10):1589–98 e6. doi:10.1016/j.chom.2021.08.013.
- Zhong C, He L, Lee SY, Chang H, Zhang Y, Threadgill DW, Yuan Y, Zhou F, Celniker SE, Xia Y. et al. Host genetics and gut microbiota cooperatively contribute to azoxymethane-induced acute toxicity in collaborative cross mice. Arch Toxicol. 2021;95(3):949–958. doi:10.1007/s00204-021-02972-x.
- Snijders AM, Langley SA, Kim YM, Brislawn CJ, Noecker C, Zink EM, Fansler SJ, Casey CP, Miller DR, Huang Y. et al. Influence of early life exposure, host genetics and diet on the mouse gut microbiome and metabolome. Nat Microbiol. 2016;2(2):16221. doi:10.1038/nmicrobiol.2016.221.
- Bolyen E, Rideout JR, Dillon MR, Bokulich NA, Abnet CC, Al-Ghalith GA, Alexander H, Alm EJ, Arumugam M, Asnicar F. et al. Reproducible, interactive, scalable and extensible microbiome data science using QIIME 2. Nat Biotechnol. 2019;37(8):852–857. doi:10.1038/s41587-019-0209-9.
- Wu L, Han Y, Zheng Z, Zhu S, Chen J, Yao Y, Yue S, Teufel A, Weng H, Li L. et al. Obeticholic acid inhibits anxiety via alleviating gut microbiota-mediated microglia accumulation in the brain of high-fat high-sugar diet mice. Nutrients. 2021;13(3):940. doi:10.3390/nu13030940.
- Cerami E, Gao J, Dogrusoz U, Gross BE, Sumer SO, Aksoy BA, Jacobsen A, Byrne CJ, Heuer ML, Larsson E. et al. The cBio cancer genomics portal: an open platform for exploring multidimensional cancer genomics data. Cancer Discov. 2012;2(5):401–404. doi:10.1158/2159-8290.CD-12-0095.
- Gao J, Aksoy BA, Dogrusoz U, Dresdner G, Gross B, Sumer SO, Sun Y, Jacobsen A, Sinha R, Larsson E. et al. Integrative analysis of complex cancer genomics and clinical profiles using the cBioportal. Sci Signal. 2013;6(269):l1. doi:10.1126/scisignal.2004088.