
ABSTRACT
The gut commensal bacteria Christensenellaceae species are negatively associated with many metabolic diseases, and have been seen as promising next-generation probiotics. However, the cultured Christensenellaceae strain resources were limited, and their beneficial mechanisms for improving metabolic diseases have yet to be explored. In this study, we developed a method that enabled the enrichment and cultivation of Christensenellaceae strains from fecal samples. Using this method, a collection of Christensenellaceae Gut Microbial Biobank (ChrisGMB) was established, composed of 87 strains and genomes that represent 14 species of 8 genera. Seven species were first described and the cultured Christensenellaceae resources have been significantly expanded at species and strain levels. Christensenella strains exerted different abilities in utilization of various complex polysaccharides and other carbon sources, exhibited host-adaptation capabilities such as acid tolerance and bile tolerance, produced a wide range of volatile probiotic metabolites and secondary bile acids. Cohort analyses demonstrated that Christensenellaceae and Christensenella were prevalent in various cohorts and the abundances were significantly reduced in T2D and OB cohorts. At species level, Christensenellaceae showed different changes among healthy and disease cohorts. C. faecalis, F. tenuis, L. tenuis, and Guo. tenuis significantly reduced in all the metabolic disease cohorts. The relative abundances of C. minuta, C. hongkongensis and C. massiliensis showed no significant change in NAFLD and ACVD. and C. tenuis and C. acetigenes showed no significant change in ACVD, and Q. tenuis and Geh. tenuis showed no significant change in NAFLD, when compared with the HC cohort. So far as we know, this is the largest collection of cultured resource and first exploration of Christensenellaceae prevalences and abundances at species level.
Introduction
Culture-independent studies showed that the members of the Christensenellaceae are associated with host health and diseases,Citation1 and that they are negatively correlated with body mass index (BMI).Citation2–5 The first described species of Christensenellaceae, Christensenella minuta,Citation6 was able to reduce diet-induced weight gain, glycemic lipids and hepatic fat accumulation, and normalize several metabolic markers of obesity in mice.Citation2,Citation7 We have recently demonstrated that C. minuta is capable of modulating host metabolism through the production of a novel class of secondary and acylated bile acids.Citation8 Luoshenia tenuis, a recently described species of the family Christensenellaceae, reduced weight increase by regulating the levels of the gastric hunger hormone PYY and GLP-1.Citation9 The Christensenellaceae are generally considered to be potentially beneficial bacteria,Citation10 however, members such as Christensenella hongkongensis have been reported as causative pathogens.Citation11–13 Christensenellaceae genomic sequences were frequently detected in cohort studies,Citation2–16 but there are only 4 genera and 7 species that are so far successfully cultured and nominated (https://lpsn.dsmz.de/family/christensenellaceae). Thus, there is a knowledge gap between the frequently detected and the rarely cultivated Christensenellaceae species diversities.
Cultured bacterial resources are crucial for causative and mechanistic studies to discover the roles of Christensenellaceae in host health and diseases, as well as for probiotic applications. In this study, we developed a new method that improves the growth and cultivation of Christensenellaceae, and doubled the number of cultured Christensenellaceae representatives. We sequenced the genomes of 30 Christensenella strains, and determined the physiological, biochemical, and genomic properties, and profiled the metabolites of the newly cultivated Christensenella strains. We correlated the observed phenotypes with genome annotation, and explored the frequency of occurrence and relatively abundance of Christensenella at species level in healthy and disease cohorts. Our study significantly expanded the Christensenellaceae resources and uncovered previously unknown information about Christensenella distribution at the species level.
Results
Establishment of new cultivation method for the collection of Christensenellaceae strains from human faeces
We collected on five Christensenellaceae genomes available at the beginning of this study and performed genome annotation for spore-formation and carbon source assimilation to guide and optimize the cultivation of Christensenellaceae. Results suggested that Christensenellaceae species might be spore-forming (Supplementary Table S1), and may be able to grow on xylo-oligosaccharide and related carbon resources (Supplementary Table S2). Thus, we applied alcohol pre-treatment of fecal samples and modified PYG medium with xylo-oligosaccharide [(hereafter called modified PYG, mPYG), Supplementary Table S3]. We first tested the effectiveness of the mPYG medium for enriching Christensenella. Five fecal samples were inoculated into mPYG broth, and 16S rRNA gene copy numbers of Christensenella were monitored for 16 days with qPCR (). As indicated with the abundance of 16S rRNA genes, Christensenella substantially increased after 8 days incubation. Then, we further applied this mPYG to 21 fecal samples, and results showed that Christensenella were successfully enriched from 13 samples (). To demonstrate the efficiency for recruiting Christensenellaceae strains, we plated the enriched fecal samples and alcohol-pre-treated samples on Petri dishes and obtained 2,684 bacterial colonies from mPYG and mmGAM (Supplementary Table S3) agar plates, respectively. In parallel, we also picked up 2,486 colonies from untreated samples on mmGAM agar plates. Colonies were sequenced for 16S rRNA genes. Results showed that there were 473 (17.6% of total colonies) and 13 (0.5% of total colonies) colonies, respectively, for which 16S rRNA genes were phylogenetically related to Christensenellaceae (sequence identities range, 88.2–100%). These results demonstrated that the new method (alcohol pre-treatment + enrichment) successfully selects for the cultivation of Christensenellaceae.
Figure 1. The enrichment of Christensenlla with modified PYG media (a, b) and the Christensenllaceae strain resources (c). For panel b, letter “F” represents fecal samples and the blue bars represent copy numbers of 16S rRNA genes before enrichment, letter “E” represents after enrichment. For panel c, the strains represent novel taxa are shown in red.
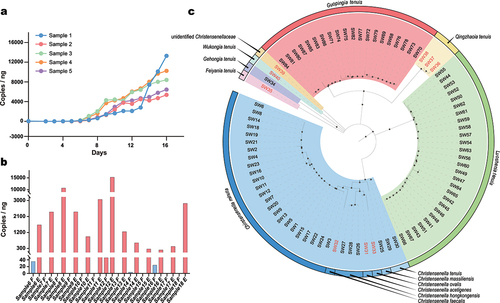
By applying this new method, we obtained 486 Christensenellaceae isolates from the fecal samples of 57 volunteers (donors’ information are presented in supplementary Table S4), and 79 strains were selected for further study based upon strain origin and 16S rRNA identity (the selection criteria are detailed in Methods). In addition, we also cultivated 8 Christensenellaceae strains from samples of monkey and mouse samples. The 87 strains (strain IDs and full-length 16S rRNA gene sequences are presented in Supplementary Table S5) were classified into 14 taxa at the species level (), including 7 potentially novel species (description of the novel species is provided in the following paragraphs). With those strains, we expanded the cultivated Christensenellaceae resources and established a collection of Christensenellaceae strains (hereafter called Christensenellaceae gut microbial biobank, ChrisGMB; https://hgmb.nmdc.cn/subject/christensenellaceae). Noticeably, three species C. minuta (24 strains), L. tenuis (27 strains), and Guopingia tenuis (20 strains) encompass the majority of ChrisGMB strains, suggesting that they were highly diversified in the cohorts that we sampled.
We conducted polyphasic taxonomy identification of the newly cultivated and potential novel taxa, including analysis of their phylogenetic, genomic, physiological, and morphological characteristics. Based on our results, six novel taxa were identified, including three novel species of Christensenella and three novel species that represented novel genera of Christensenellaceae (detailed description of each new taxon is available in the Supplementary Data 2). All the new taxa were denominated following the rules of ICNP, and their protologs are provided in .
Table 1. Description and etymology of novel taxa (more detailed properties of the new taxa are available in supplementary data 2).
The Christensenella pan- and core-genomes and general features of Christensenella at species and strain levels
In this study, we sequenced 30 genomes of Christensenella strains from human fecal samples, and downloaded 12 genomes affiliated with the genus Christensenella from the genome portal in NCBI (https://www.ncbi.nlm.nih.gov/genome/) for phylogenomic analysis. The phylogenomic tree constructed using GTDB-tk supported the species classification results of the phylogenetic tree based on the 16S rRNA genes. We noticed that C. hongkongensis, a causative pathogen distinct from other members of Christensenella,Citation11–13 was distantly related to other members within the genus Christensenella and formed a separate clade (). The genome sizes of Christensenella species ranged from ca. 2.5 to 3.2 Mb. Uniquely, the strain SW18 (C. minuta) contained a plasmid of 5,021 bp. The plasmid was carried 6 annotated genes, namely RepA, bacterial mobilization protein (MobC), relaxase/mobilization nuclease domain, and 3 hypothetical proteins. Thus, we considered that this plasmid was conjugative and a member of the IncP compatibility group (Supplementary Figure S1). The averages of molar GC content of the Christensenella species varied from 48.5 mol% (C. hongkongensis strain SW27) to 54.3 mol% (C. faecalis strain SW32) (Supplementary Figure S2). The 30 Christensenella genomes belong to 6 species (), and average nucleotide identity (ANI) values among the Christensenella genomes were 77.8–99.9%. The ANI values of different species were lower than 95% and of strains from each species of C. minuta, C. hongkongensis or C. tenuis were ranged 98.9–99.9%, indicating that Christensenella were evolutionarily distinctive at species level and had relatively stable genomes at strain level (Supplementary Figure S3).
Figure 2. Phylogenomic tree and general genome features (a), pan- and core-genome analysis (b–d) of Christensenella strains. For panel a, the GTDB tree was constructed based on a concatenated alignment of 120 ubiquitous single-copy proteins. The genomes from NCBI were tagged by their genome accession numbers. Panel b shows the COG distribution of pan-, core- and unique genome of genus Christensenella. Panels c and d show the distribution of COGs at species (c) and at strain levels (d). Panel c shows the average numbers of the proteins detected in each category, and those categories of C, E, G, H, I, P, and Q are showed in red text. For panel d, the violin plot of protein categories related to metabolic proteins in different strains, including C, E, G, H, I, P, and Q. The three lines on the violin plot represent the upper quartile, median, and lower quartile.
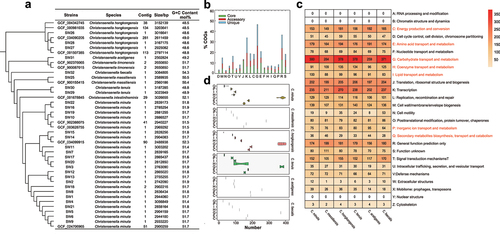
With those strains and genome resources, we explored the pan- and core-genome of Christensenella, and the featuring genes of Christensenella species and strains. The genus Christensenella had 8,682 orthologous genes for its pan-genome, of which 1,260 were core genes (defined as occurring in ≥95% genomes). Those 1,260 core genes were involved in cellular processes such as cell division, ribosome biogenesis, DNA replication, energy metabolism, and gene transcription and translation. High ratios were accessory genes of cell motility, carbohydrate transport and metabolism, and secondary metabolites synthesis, transport and catabolism genes (). The genes associated with cell motility primarily consisted of those encoding flagella, involved in bacterial chemotaxis and specific secretion systems (Supplementary Table S6). Nevertheless, no movement was observed of these strains during our experiments. Noticeably, there were 6.32% and 12.92% of the core genes remained functionally unknown and only general prediction, respectively (), a reflection of poor understanding of Christensenella genetics and physiology.
To better comprehend the functional, genetic variations and probiotic potentials of the Christensenella strains, we explored their shared and featuring genes. The results of the COG analysis () showed that the Christensenella genomes harbored similar proportion of proteins belonging to the class of cell cycle control, cell division, chromosome partitioning (D), nucleotide transport and metabolism (F), translation, ribosomal structure, and biogenesis (J), and posttranslational modification/protein turnover/chaperones (O). However, there were differences in the proteins related to metabolism. C. minuta, C. hongkongensis, C. tenuis, and C. faecalis had a higher number of carbohydrate transport and metabolism (G) proteins (). Further, C. hongkongensis strain SW28 had the highest number (403) of carbohydrate transport and metabolism proteins. In addition, C. hongkongensis, C. tenuis, and C. faecalis had more coenzyme transport and metabolism (H) proteins, while C. acetigenes had more inorganic ion transport and metabolism (P) proteins. The metabolism of coenzymes and inorganic ions not only contributes to the stability of the intestinal community, but also allows these strains to play a more active role in host metabolism and immune regulation.Citation17–19
Genome-data mining reveals that Christensenella strains encode diverse and multiple genes for glycoside hydrolases and carbon resource assimilation
Carbohydrate metabolism is crucial for both gut microbes and host, as it contributes to microbial colonization, competition, and interaction with host.Citation20 To analyze the metabolic capacity of the Christensenella species for different polysaccharides, the Cazy database was used to annotate the genomes of the strains.Citation21 As shown in , Christensenella strains encoded a total of 27 glycoside hydrolases (GHs). Notably, 5 GHs (GH13, GH23, GH73, GH77, and GH109) shared by almost all species. These GHs are responsible for the degradation of specific polysaccharides, such as glucan, bacterial peptidoglycan, chitin, mannan and animal polysaccharides. At the species level, C. massiliensis was featured by encoding of GH5, GH32, GH38, and GH105, which are involved in the degradation of plant cell wall or plant-origin polysaccharides such as glucan, fructan, mannan and galacturonorhamnan. The C. faecalis genome encoded GH2 (β-galactosidase), GH36 (α-galactosidase), and GH106 (α-L-rhamnosidase) and was different from other Christensenella species. C. faecalis also encoded four types of fucosidases (GH29, GH95, GH139, GH141) and a carbohydrate-binding module CBM40 (specific for binding sialic acid), which might be involved in host mucopolysaccharide degradationCitation22 and regulation of the mucus layer.Citation23 Two strains of C. minuta, SW11 and SW22, encoded also fucosidase (GH151). In addition, strains of C. minuta encoded GH18, GH26, GH105, and GH114, suggesting that C. minuta strains would be able to assimilate animal- and plant-originated polysaccharides.
Figure 3. Genome annotation for glycosidases (a), biolog test results for carbon sources assimilation (b), and evaluation of acidity and bile acid tolerance and antibiotic resistance (c) of Christensenella strains. For a, the color change from blue to red and the sizes of circles represent the quantity of GHs. Absence of a circle indicates that the strain did not possess the corresponding GH. For b, the color orange represents the ability to utilize this carbon source, while light yellow represents the inability to utilize it. For panel c, the left part shows the survival rate of Christensenella strains after a 4-hour treatment at different pH values (2.0, 2.5, 3.0, 3.5). The color gray represents that the survival rate is 0. The number of bacterial colonies growing on agar plates at pH = 7 served as control. The middle part shows the effect of 0.3% bile acid on bacterial growth. Using bile -free medium as control, the time required to reach OD600 = 0.3 was determined (maximum 120 h). The time shown in the graph represents the lag period of strain growth, which is the time difference for strains to reach OD600 = 0.3 in the test and control media. The right part shows the bacterial resistance to 20 antibiotics at species and strain levels, with the number of strains in parentheses.
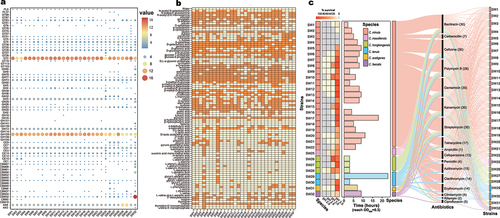
Genome annotations indicated that Christensenella possessed multiple and diverse genetic elements for carbon source assimilation and energy production. For examples, we identified core genes encoding galactose mutarotase, fucose isomerase and glycerol kinase GlpK, suggesting that assimilation of those carbon sources might be well-spread features for Christensenella. Indeed, most Christensenella strains (>90%) showed evidence of using multiple carbon sources, including glucose, N-acetyl-D-galactosamine, adonitol, galactose, galacturonic acid, maltotriose, mannose, melibiose, turanose and glyoxylic acid (). In addition, the core genes 1,4-α-glucan branching protein GlgB and 4-α-glucanotransferase could convert rapidly digestible starch to slowly digestible starch and resistant starch,Citation24 a probiotic property of gut microbes such as Bifidobacterium species in food processing. The assimilation and conversion of multiple carbon sources by Christensenella species are possibly contributed to their probiotic features for modulation of host glycolipid metabolism.Citation7,Citation8
Metabolomic profiling of Christensenella strains
The productions of SCFAs and volatile metabolites by Christensenella were examined (). A total of 129 non-redundant volatile metabolites were identified, with the abundant substances being esters (26), acids (18), and alcohols (16) (Supplementary Table S7). Most of the Christensenella strains produced 2-decanol and trans-farnesol, which have been reported to possess properties for antimicrobial, anti-inflammatory and biofilm-inhibiting characteristics.Citation25–27 All Christensenella strains produced short-chain fatty acids SCFAs (acetic and butyric acids) that was reported to play a role in regulating host metabolism.Citation28–30 Strain SW6 (C. minuta) produced the highest acetic acid (60.6 µg/mL), and strain SW29 (C. tenuis) produced the highest amounts of butyric acid (47.3 µg/mL). Genome annotation revealed that all Christensenella strains possess pathways for acetate and butyrate production and that the synthesis pathway for acetate is highly conserved. However, there were obvious differences in the pathway for butyrate production among the Christensenella strains, as illustrated in Supplementary Figure S4. We did not identify any butyryl coenzyme A transferase (EC 2.8.3.8) from the genomes of strains SW15, SW26, and SW27 but they still produced butyric acid. This suggests that other unknown genes/enzymes/pathways might occur in Christensenella strains.
Figure 4. Metabolic profiling of Christensenella strains. a, volatile metabolite heatmap. The blue region (top) represents the production of short-chain fatty acids (SCFAs, μg/mL). All strains do not produce propionic, isobutyric, valeric and isovaleric acids. The yellow region (bottom) represents the metabolites detected through SPME-GC/MS and the color describes the relative amounts of metabolites represented with the peak area. According to the classification of metabolites, groups with less than 5 uniformly classified as others. b, the total number of metabolites of different Christensenella species. The species with only one strain is denoted by a horizontal line. center line: median. c, the number of different types of metabolites from different Christensenella species. The three lines in the violin plot represent the upper quartile, median, and lower quartile, respectively. The species with only one strain is denoted by a vertical line.
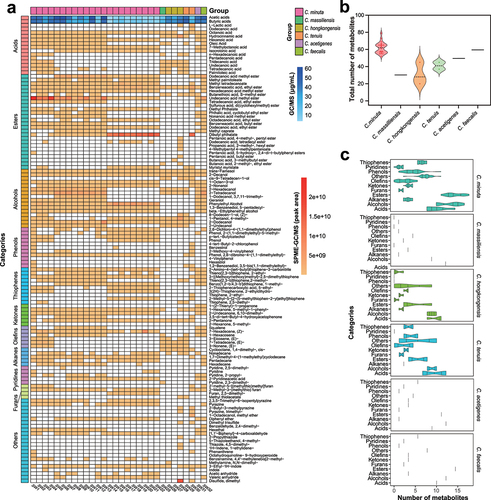
The metabolic profiles at the species level ()) showed that C. minuta produced a greater variety of metabolites in terms of both diversity and quantity, although this observation might be biased with the larger number of C. minuta strains compared to other Christensenella species. Among the strains, SW1 (C. minuta) produced the highest number 78 different types of metabolites. SW26 (C. hongkongensis) produced the fewest number of metabolites, with only 19 detected. There were obvious differences in metabolite diversity at both species and strain levels (). All the Christensenella species were capable of producing a wide range of alcohols and acids. Many alcohols (e.g., 1-pentanol) and acids (e.g., hydrocinnamic acid, oleic acid) have been reported to possess antibacterial properties.Citation31,Citation32 Octanoic acidCitation33 had been reported to regulate host metabolism and to improve host physiological and biochemical indicators. C. minuta, C. faecalis, and C. acetigenes produced a greater variety of esters. C. minuta strain SW7 produced the highest number (16) of esters. Among them, hexadecanoic acid methyl ester had been reported to have antimicrobial effects.Citation34
Christensenella strains produce secondary bile acids and their resistances to bile, acidity, and antibiotics
Gut microorganisms modify primary bile acids (BAs) and produce secondary bile acids. These secondary bile acids have a wide range of effects on host and selectively impact the composition of the intestinal microbiota.Citation35,Citation36 They function as signaling molecules, interact with various receptors such as farnesoid X receptor (FXR),Citation37 vitamin D receptor (VDR),Citation38 and regulate host metabolism, physiology and immunity. We assessed the production of secondary bile acids with Christensenella strains (, and Supplementary Table S8). Our results showed that Christensenella strains were able to modify primary bile acids by dehydrogenation, acylation, amidation, and hydrolysis (). It was worth noting that C. massiliensis was not, but all the other Christensenella species were able to catalyze acylation (), a recently identified bile acid modification with gut microbes.Citation8 Most Christensenella strains were capable of undergoing the above four types of catalytic reactions on bile acids, but strains showed differences in dehydrogenation, acylation and hydrolysis. C. hongkongensis strains hardly catalyzed dehydrogenation reactions, with exception for strain SW28 that weakly converted CA to 3-oxoCA. The C. minuta strain SW21 and the newly discovered species C. acetigenes strain SW31 did not catalyze amidation and hydrolysis ().
Figure 5. Bile acid modification with Christensenella strains. (a) detected bile acid modifications associated with Christensenella strains in this study. (b) quantitively detection of bile acid modifications to cholic acid (CA), chenodeoxycholic acid (CDCA), and taurocholic acid (TCA) with Christensenella strains. (c) comparison of bile salt hydrolase (BSH) gene information among different strains of Christensenella minuta. The purple color represents strains that were unable to hydrolyze bile acids, while the red color represented strains capable of bile acid hydrolysis. From inner to outer circles, the represented strains were as follows: 1) red portion: SW30, SW10, SW7, SW18, SW20, SW14, SW19, SW16, SW17, SW22, SW11, SW8, SW13, SW2, SW3. 2) purple portion: SW1, SW9, SW5, SW6, SW21, SW4, SW12. d, the variable genetic regions harboring BSH gene cluster. Strain SW15 was used as the reference genome.
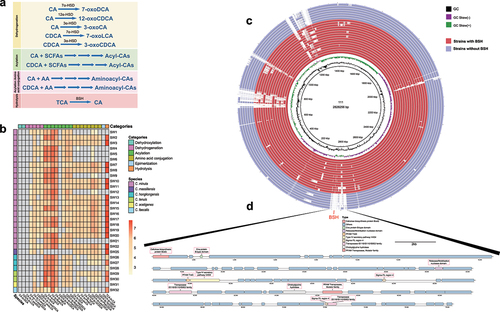
We explored the Christensenella genomes of genetic homologs for conjugated bile acid hydrolysis. Result showed that the BSH gene was located at a highly variable region of the C. minuta genome (), which might have contributed to the differences in bile acid modification abilities among C. minuta strains. In this region (), we have annotated numbers of genes related to gene transfer and expression regulation, such as PFAM transposase, mutator family, transposase IS116/IS110/IS902 family, and relaxase/mobilization nuclease domain. Additionally, there was a combination of an IV type secretion system TraG-VirD4, which may be involved in DNA transfer.Citation39
Given the probiotic potential of Christensenella strains, we subsequently evaluated the biological phenotypes including acidity and bile tolerance, and antibiotic resistance () to profile their host and environmental adaptions.Citation40 Christensenella species and strains exhibit obvious differences. The results indicate that C. acetigenes and strains of C. minuta, C. hongkongensis could tolerate acidity at pH 2.0. The majority of Christensenella strains showed a substantially increase in survival rate at pH 3.5 (, left part). Moreover, most strains reached OD600 of 0.3 in the bile-containing medium within a time range of 0–11 hours compared to the control without added bile, except for SW17 (18 h, C. minuta) and SW29 (23 h, C. tenuis). Strains SW15 (C. minuta) and SW25 (C. massiliensis) were not affected by bile (, middle part). The tolerance to bile might ascribe to the existence of bile acid modifying enzymes,Citation41 which are involved in bile detoxification and bacterial colonization in the human gut.Citation42
Next, the resistance of Christensenella to 20 antibiotics was tested (, right part). All members of the Christensenella exhibited tolerate toward kanamycin, gentamicin, streptomycin (protein synthesis inhibitors), as well as cefixime and bacitracin (cell wall synthesis inhibitors). However, they showed sensitivity toward chloramphenicol, an inhibitor of protein synthesis, as well as amoxicillin and vancomycin, both inhibitors of cell wall synthesis. Only a few strains displayed resistance to ampicillin (1, SW2, cell wall synthesis inhibitor) and rifampicin (2, SW7, SW15, DNA inhibitor). At strain level, C. minuta displayed the greatest variability, with differences observed in resistance to 12 antibiotics. The variation in resistance expression to the same antibiotics may be attributed to inconsistent resistance genotypes associated with phenotypes.Citation43 Using the CARD database,Citation44 we annotated 10 antibiotic resistance genes (see Supplementary Table S9 for details). Most of the genome annotation results are consistent with the experimental findings. However, certain strains such as SW5, SW11, SW15, SW21, SW22, and SW26 were annotated with tetracycline resistance genes in the genome, but experimental validation showed that they were sensitive to tetracycline. According to the annotation results from the VFDB database, all strains of ChrisGMB did not possess any virulence genes (Supplementary Table S10).
Distribution of Christensenellaceae at family, genus, and species levels in healthy and disease cohorts
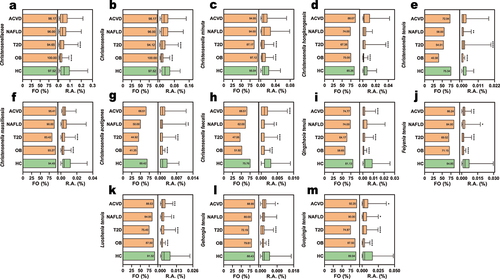
It has been reported that, in general, Christensenella(ceae) was negatively associated with metabolic disorders at family and genus levels,Citation2,Citation45 but there was few information on their abundances and prevalences at species level. In addition to family and genus levels, we examined the frequency of occurrence (FO) and relative abundance (RA) of the human-derived Christensenellaceae species from this study with published gut metagenomic datasets of cohorts,Citation8 including atherosclerotic cardiovascular disease (ACVD), obesity (OB), nonalcoholic fatty liver disease (NAFLD), type 2 diabetes mellitus (T2D), and healthy cohorts (HC). Results showed that Christensenellaceae occurred widely in cohorts. Except C. acetigenes, C. faecalis, and C. tenuis, all other Christensenellaceae species had high prevalences (with a mean prevalence ≥50% in all cohorts) (). Consistent with previous studies,Citation2,Citation45 the RA values of Christensenellaceae and Christensenella were much reduced at family and genus levels in the OB and T2D compared with HC. We found that the RA values of Christensenellaceae and Christensenella had not significantly changed in NAFLD and ACVD cohorts (). At species level, we found that the abundances differed among cohorts. C. faecalis, Feiyania tenuis, L. tenuis, and Guo. tenuis significantly reduced in all the metabolic disease cohorts. C. minuta, C. hongkongensis and C. massiliensis showed no significant change in NAFLD and ACVD, and C. tenuis and C. acetigenes showed no significant change in ACVD, and Qingzhaoia tenuis and Gehongia tenuis showed no significant change in NAFLD, when compared with the HC cohort.
Figure 6. Distributions of christensenellaceae in health and disease cohorts. The frequency of occurrence (FO, left bar chart of each panel) and relative abundances (RA, right bar chart of each panel) of at family, genus and species levels. The box plot displays the average relative abundance (%), center line: median, bounds of box: quartile, bar: 5–95%ile. Abbreviations: atherosclerotic cardiovascular disease (ACVD, n = 218), obesity (OB, n = 104), nonalcoholic fatty liver disease (NAFLD, n = 50), type 2 diabetes mellitus (T2D, n = 187), and healthy cohorts (HC, n = 726). A non-parametric Kruskal–Wallis test followed by Dunn’s multiple comparisons test was conducted for statistical analysis. *p < .05; **p < .01; ***p < .001, ****p < .0001.
Discussion
Christensenellaceae members have been frequently detected in human fecal samples and intensively associated host health and diseases.Citation45 However, their prevalences and abundances at species level had not been reported. In this study, we found that the cultivated Christensenellaceae species occurred in various cohorts at high prevalence and showed varied abundances among different disease cohorts. Christensenella species such as C. faecalis, Feiyania tenuis, L. tenuis, and Guo. tenuis significantly reduced in OB, T2D, NAFLD and ACVD. But C. minuta, C. hongkongensis and C. massiliensis showed no significant change in NAFLD and ACVD. The cultured bacterial and genomic resources and the primary information on prevalence and abundance of Christensenellaceae species will benefit for mechanistic studies on host–microbe interaction and testing the probiotic potentials of Christensenella strains.
Many gut microbes are considered being culture-resistant and extensive works had been done on cultivation of gut microbes.Citation46 Although there was no report describing the difficulty for Christensenellaceae cultivation, still, only 11 species of this family Christensenellaceae have cultivated (https://lpsn.dsmz.de/family/christensenellaceae), suggesting that cultivation of Christensenellaceae strains might be a challenging task. In this study, we made efforts on recovering Christensenellaceae strains from human fecal samples by 1) applying effective pretreatment with 25 ethanol % on fecal samples and 2) modifying PYG medium with addition of xylo-oligosaccharides and 3) enriching Christensenella with the modified PYG medium. Pre-treatment of fecal samples with 70% ethanol had been applied in previous studies for isolating spore-producing microbes,Citation47 but our research showed that 25% ethanol was more suitable for recovering Christensenellaceae strains. This might relate to cell wall structures, as it was reported that C. minuta had a unique lipopolysaccharide component.Citation48 Although the modification of PYG medium was based on annotation of previously known Christensenella genomes, we observed that xylo-oligosaccharide significantly reduced the growth of highly prevalent gut microbes such as Bacteroides uniformis, Phocacicola vulgatus, Prevotella copri and Fusobacterium varium (Supplementary Table S11 and Figure S5). With this newly established method, we obtained 87 strains representing 14 species of Christensenellaceae. The collection of more Christensenellaceae strains represents the first gut microbial biobank for Christensenellaceae (ChrisGMB, https://hgmb.nmdc.cn/subject/christensenellaceae), and provides new cultured bacterial resources for future studies on host–microbe interactions.
In addition to cultured bacterial resources, the ChrisGMB databank provides genomes and metabolite profiles at species and strain levels, which are valuable for screening probiotic Christensenella and understanding their diverse genetics and versatile metabolisms. Being potential and important next-generation probiotics, the Christensenella strain diversity, their phenotype and adaptation to environments are critical, e.g., the low pH and high concentration of bile acids in the gastrointestinal are very challenging to many probiotic bacterial strains.Citation49–51 In this study, we found that Christensenella strains such as SW9, SW11, SW20, and SW30 showed resistance to low pH, tolerance to higher bile acid concentrations, and the clearance of virulence factors in their genomes, which are all desired features for probiotics. Metabolite profiling revealed Christensenella produced a range of bioactive compounds such as farnesol and oleic acid, suggesting they might have multiple pathways to interact with host. Remarkably, Christensenella strains produced large amounts of acetate and butyrate, suggesting they might play a role in modulating gut environments and contribute to gut SCFAs levels. The novel species C. faecalis possessed fucosidases, suggesting that this novel species might be involvement in host immune regulation through mucin utilization.Citation22
Gut microbes could influence the host metabolism and immune regulation via bile acid (BA) modification. The BA modification reduces BA toxicity to the bacteria and also exerts on host physiology and immunity. Study showed that gut bacteria produced 3-oxolithocholic acid (3-oxoLCA) and isoLCA, and affected host immunity and metabolism by inhibiting the differentiation of TH17 cells.Citation52 In addition, 3-oxoLCA and isoLCA have been identified as TGR2 agonists that promote M5 polarization of macrophages, and they have the potential to improve experimental rheumatoid arthritis in mice.Citation53 Our study showed that Christensenella species were able to modify BAs and its derivatives via hydrolysis, dehydrogenation, amidation, and acylation, implying that Christensenella species might be widely involved in regulation of host physiology and immunity. We observed that there were differences in the BA modification among Christensenella species or strains, and explored the genetic foundations for BA modification. Genetic analysis reveals that the BSH enzyme exists in a highly variable and dynamic region of the genome. This region contains a large number of transposases, partly explaining the differences in the BA modification among C. minuta strains.
Conclusion
In this study, we have established an oriented strategy for the low-abundance gut microbiota Christensenellaceae, resulting in a 35-fold increase in isolation rate. Through this strategy, we have constructed a CGMB consisting of 87 strains from 14 species in 8 genera. We have identified and proposed three new genera of Christensenellaceae and three new species of Christensenella. We found that the abundance of these human-derived species is significantly reduced in various metabolic diseases, indicating the beneficial role of Christensenellaceae in metabolic improvement. Through genomic, metabolomic, and physiological analyses, we have revealed the diverse probiotic characteristics of this family, including the ability to utilize a wide range of coenzymes and complex polysaccharides, generate multiple volatile probiotic metabolites, have a strong bile acid conversion spectrum, and demonstrate good host adaptability. Our findings highlight the tremendous potential of Christensenella strains as probiotics.
Materials and methods
Sample collection and treatment
Fecal samples were collected from 86 volunteers from Shandong, China, and obtained their informed consent for fecal sample donation. The selection criteria for volunteers were as follows: 1) Volunteers should have a BMI within the normal range (18.5–25.0 kg/m2). 2) Volunteers should not have used antibiotics within the 2 months prior to stool donation. 3) Volunteers should not have experienced diarrhea within the 3 days before the sample. Fresh samples were transferred to an anaerobic workstation within 2 hours, or samples were immediately frozen using liquid nitrogen and transported with dry ice for long-distance transportation before being sent to the laboratory for processing. The gas flow composition in the anaerobic workstation was 85% N2, 5% CO2, and 10% H2.
Bacterial isolation and cultivation
Fecal samples were first suspended in PBS buffer or 25% alcohol and then filtered through a 40 μm cell strainer to remove large insoluble particles in the suspension. The alcohol-pretreated bacterial suspension was centrifuged to remove the alcohol, and subsequently resuspended in PBS. This PBS suspension was referred as the original suspension. Afterward, the original suspension was serially diluted in PBS from 10−1 to 10−8, and 100 μl was spread onto different agar plates (see Table S3 for specific culture medium formulations) for anaerobic incubation at 37°C. The selection, isolation, and identification of bacterial colonies were conducted according to our previous study with certain modifications:Citation54 Single colonies appearing on the agar plates after 3–30 days of incubation were picked and streaked onto 12-well agar plates for further cultivation. Depending on the growth rate of the isolates, they were incubated at 37°C for 3–10 days. Subsequently, the cultivated bacterial culture was picked, added to a 96-well plate containing 4 μl of lysis buffer (NaOH/SDS), and diluted with 100 μl of sterile deionized water.
Use 2 μl of the dilution as the template, add 2×Es Taq MasterMix (CWBIO, CHN), primers (27 F: 5′-GCTCTTTGTGAATCCCTCGG-3′; 1492 R: 5′-TCAGTTCGGCTACCCATCGT-3′), and water for PCR amplification of the 16S rRNA gene sequence. The PCR reaction volume was 30 μl. The PCR products were sequenced using Sanger sequencing (Tsingke Biotech Co., Ltd., CHN). Afterward, the 16S rRNA gene sequences were BLAST using EZBioCloud and the NCBI 16S ribosomal RNA sequence database (Update date: 2023/08/18, number of sequences: 26876) to determine the taxonomic status of all isolates. We selected different Christensenellaceae strains that were correctly sequenced and further expanded in liquid Hungate anaerobic tubes. Then sequenced them to further purify and preserve. We classified and preserved these isolates according to the following criteria: 1) If the16S rRNA gene of an isolate showed a similarity >98.65%Citation55 to a species with valid names in the EZBioCloud database, it was considered a known species. If the16S rRNA gene of an isolate showed a similarity ≤98.65% to a species with valid names in the EZBioCloud database, it was considered a candidate for new taxa. 2) If the16S rRNA gene of the isolates from the same donor had a similarity >99.00%, they were considered as the same strain of the same species. In addition, isolates with a similarity between 98.65% and 99.00% were considered different strains. 3) Different strains of the same species (with a similarity greater than 98.65%) from different donors were considered different strains. All subsequent experiments with these strains were conducted in mmGAM liquid medium or on mmGAM agar plates (see Table S3 for medium formulations), unless otherwise stated.
The design of Christensenella’ s specific primers, enrichment, and qPCR detection
Based on the 16S rRNA gene of validly published species of Christensenella on LPSN, specific primers were designed using Primer Premier 5.0 (F: 5‘GCTCTTTGTGAATCCCTCGG 3’; R: 5‘TCAGTTCGGCTACCCATCGT 3’). Primer-BLAST was used to align and check the specificity of the primers. The designed primers were synthesized by Tsingke (Tsingke Biotechnology Co., Ltd.,CHN). Both conventional PCR and qPCR were performed using the same reaction system and program. The recommended program by 2 × ChamQ Universal SYBR qPCR Master Mix (Vazyme, CHN) was used with the following modifications, preincubation 95°C 30 s; denaturation 95°C 10 s; annealing 55°C 20 s; extension 72°C 10 s; 40 cycles. The recommended 20 μL qPCR reaction system by 2 × ChamQ Universal SYBR qPCR Master Mix was used with the following modification, 10 μL of 2× ChamQ Universal SYBR qPCR Master Mix, 0.4 μL of each primer, and 9.2 μL of DNA template. The target fragment was amplified using the LightCycler 96 (Roche, CH) instrument, with the C. minuta genome DNA as a template.
The specific bands generated by amplifying the total DNA of C. minuta with specific primers were recovered and purified using the Universal DNA Purification Kit (TIANGEN, CHN). The target fragments were then ligated with the T-vector at room temperature to construct recombinant plasmids. The recombinant plasmids containing the target fragments were then transferred into Escherichia coli DH5α competent cells and positive clones were selected. The positive clones were sent to Tsingke (Tsingke Biotechnology Co., Ltd.,CHN) for sequencing to verify the match between the transferred target fragment and the gene loci of the design primers, thus confirming the correctness of the transferred target fragment and the specificity of the primers. The plasmids were extracted using the TIANprep Mini Plasmid Kit (TIANGEN, CHN), and the concentration of the recombinant plasmids was determined using the Q6000 (Quawell, USA). Recombinant plasmid with known concentration was used as the standard for qPCR. The copy number was calculated using the following formula: Copies = (plasmid concentration × Avogadro’s constant)/(average molecular weight of one base pair × total length of the recombinant plasmid).Citation56 The concentration of the recombinant plasmid standard, determined as mentioned above, was used to calculate the Copies. The recombinant plasmid standard was then diluted using a 10-fold gradient dilution method, with the diluted recombinant plasmid as the template and ddH2O as the negative control. qPCR was performed using the above reaction system and conditions to establish a standard curve of lg (dilution factor) and Ct values. The concentration of Christensenella in the sample was calculated using the fitted formula.
The original suspension was incubated in mPYG broth for 8 days, which served as the first-generation enrichment liquid. Subsequently, passaging was carried out, and the second-generation enrichment liquid was cultured for an additional 8 days. The enriched liquid was then sampled to determine the enrichment effect and isolate bacterial strains. For the quantitative analysis of Christensenella, the DNeasy PowerSoil Pro Kit (Qiagen, GER) was used to extract the whole genome from feces or enrichment fluid. The quantification of each sample’s copies was performed by conducting three repeated experiments, and the average copies/ng of fecal (enrichment fluid) genomic DNA was reported.
The preservation strategy of bacterial strains
These strains were also preserved in our laboratory in three ways: 1) for tentatively preservation, inoculated 0.2 mL liquid pure culture onto agar slant medium and anaerobically incubating at 37°C until visible colonies or biofilms appeared, then stored at room temperature. For long-term preservation, 2) Mixing 0.2 mL liquid pure culture with 40% glycerol protective solution in equal volume and storing at −80°C; or 3) Suspending 0.2 g pure cultre in 200 μl lyophilized protectant (5% skim milk, 3% lactose, 2% glycerol) and freezing at −80°C for ≥24 h, followed by lyophilization in an anaerobic environment (high-purity nitrogen). The lyophilized cells were stored at 4°C for long-term storage. All the strains in this study were preserved in CGMCC and accession numbers are provided in Supplementary Table S5.
Polyphasic characterization and nomenclature of novel taxa
Strains representing potential novel taxa were subjected to polyphasic taxonomy, including the analysis of phylogeny, physiological and biochemical, morphological and genomic characteristics of the strains.Citation46,Citation54 We downloaded the 16S rRNA gene sequences of validly published strains associated with each potential new taxa from GenBank (www.ncbi.nlm.nih.gov/genbank/). After aligning their 16S rRNA gene sequences using MEGA-X,Citation57 we constructed phylogenetic trees using neighbor-joining methodCitation58 to depict the phylogenetic distribution and taxonomic relation of each novel taxa and its closely related taxa. The phylogenetic trees were generated using Kimura’s two-parameter method.Citation59 The branch patterns of the NJ tree were evaluated using 1,000 bootstrap replicates. The phylogenomic trees were constructed using the CVTree method.Citation60 The closely related taxa on phylogenetic and phylogenomic trees were used for further genome-based analysis. The genome-based analysis of novel taxa included the calculation of the average nucleotide identity (ANI), digital DNA: DNA hybridization (dDDH) and the percentage of conserved proteins (POCP). The ANI values and heatmaps were generated using the OrthoANI OTA software.Citation61 The dDDH values were calculated using the Genome-to-Genome Distance Calculator 3.0 (GGDC).Citation62 The POCP values were calculated using ComputePOCP_v1.1 and used for taxonomic description at the genus level.Citation63,Citation64 The production of short-chain fatty acids by strains was analyzed using GC-MS, following the same method as before.Citation65 Cell morphology was observed using transmission electron microscopes FEI Tecnai G2 F20 (Thermo Scientific, USA).
Genome sequencing and analysis
For determination of complete genome sequences, cells grew to a stable phase in mmGAM medium, the cells were collected and the supernatant was discarded. Genomic DNA was extracted using TIANamp Bacteria DNA Kit DP302 (TIANGEN, CHN) and DNeasy Blood & Tissue Kit (Qiagen, GER) as instructed by the manufacturers. DNA concentration was determined using the QubitTM 4 Fluorometer (Thermo Fisher Scientific, USA) and DNA degradation was checked by electrophoresis. Bacterial genome sequencing was carried out by Magigene (Guangdong Magigene Biotechnology Co., Ltd., CHN). The raw reads-data were filtered according to the following criteria: 1) removal of low-quality bases at the ends of the sequences; 2) removal of sequences containing adapters; 3) removal of sequences with low average base quality; 4) removal of sequences containing multiple N bases; 5) removal of sequences that are too short. The effective data was used for genome assembly. Pure third-generation data was assembled using SMRT Link v5.1.0 (https://www.pacb.com/support/software-downloads/), and both second-generation and third-generation data using Unicycle (https://github.com/rrwick/Unicycler). The assembly results were further optimized using the arrow software to correct errors.
Twelve genomes (four Christensenella hongkongensis, two Christensenella timonensis, one Christensenella massiliensis, one Christensenella intestinihominis, and four Christensenella minuta, including PMID:33692769Citation66 and PMID:28082495Citation67 of the genus Christensenella were downloaded from the genome portal in NCBI (https://www.ncbi.nlm.nih.gov/genome/). The GTDB-TK toolkit was applied to assign taxonomic classifications to all acquired genomes using the gtdbtk classify_wf command with the – bacteria – outgroup_taxon p__Patescibacteria options.Citation68 The IQ-TREE (v 2.0.3) was applied to construct a phylogenic tree using the iqtree command with the -m LG+F+R10 options.Citation69 The average nucleotide identity (ANI) values between different strains were calculated using FastANI v1.33.Citation70 The bacterial genome sequences were predicted for coding genes using Prodigal.Citation71 Functional annotation of the coding genes was performed using the eggNOG 5.0 database,Citation72 KEGG databases,Citation73 COG databases,Citation74 CARD databasesCitation44 and VFDB databases.Citation75 Pan-genomic analysis were used RoaryCitation76 and BPGA-1.3,Citation77 and a 50% sequence identity cutoff was used for gene clustering at the genus level. Comparative genomic analysis was conducted using the BRIG-0.95-dist software.Citation78
Human cohorts and gut metagenome data, collection, and analysis
Cohorts’ data were retrieved from public databases and was achieved directly from GMrepoCitation79 with the following project numbers PRJEB12123 (obesity, n = 104), PRJEB21528 (cardiovascular disease and health, n = 405 (218, 187)), PRJNA422434 (type 2 diabetes and health, n = 359 (187, 172)), PRJNA373901 (nonalcoholic fatty liver disease and health, n = 86 (50,36)), PRJNA278393 (health, n = 38), PRJNA388263 (health, n = 293), respectively.
One thousand two hundred and eighty-five valid runs of raw metadata were used for further analysis of ChrisGMB species (Supplementary Table S12). The cohorts and metagenomic data were analyzed using the same method as previously described.Citation8 For analysis of the frequency of occurrence (FO) and relative abundance (RA) of ChirGMB species, a self-built library was generated by including the newly sequenced genomes of C. minuta, C. massiliensis, C. hongkongensis, C. tenuis, C. acetigenes, C. faecalis, Geh. tenuis, F. tenuis, Q. tenuis, L. tenuis, and Guo. tenuis into the Kraken2 database. Kraken2Citation80 and BrackenCitation81 were used to generate the relative abundance in each sample. All calculations were performed using the default parameters.
Metabolite determination
The concentrations of SCFAs (including acetate, propionate, butyrate, isobutyrate, valerate, and isovalerate) were determined using GC-MS. The quantification of SCFAs was conducted based on methods used in previous studies.Citation82 In brief, fresh bacterial suspension (1 ml) was taken in an EP tube and 1 ml of ethyl acetate was added for the extraction of SCFAs. The organic phase was collected through centrifugation and used for analysis by GC-MS (GCMS-QP2010PLUS, JPN). Sterile mmGAM broth medium was used as a blank control. Standard curves of SCFAs were achieved by pure chemical agents of corresponding chemicals, purchased from Aladdin, diluted in ethyl acetate of chromatographic purity. According to Sumner et al., the SCFAs identified in this study were considered as level 1 identification compounds, and these compounds were referenced against standard substances and the NIST library.Citation83
Volatile metabolites were determined using Q Exactive GC Orbitrap GC-MS/MS (Thermo Fisher, USA), as previously reported,Citation82 and the metabolites identified in this study belonged to level 2-identified compounds, which were matched to the National Institute for Technology Standards (NIST2020; www.nist.gov) with a threshold matching score of >85.Citation83 Sterile mmGAM broth medium was used as control. The screening process for metabolite selection was as follows: 1) the ratio of peak area of the compound to the control was ≥2, otherwise considered as 0; 2) subtract the peak area of the compound with the control; 3) divide the value obtained in step 2 by the maximum OD600 of the culture.
Transformation of bile acids (CA, CDCA, and TCA) was determined as previously reported.Citation8 The raw data were processed with the Agilent MassHunter Qualitative Analysis v6.0 software based on m/z values and compound retention time. Table S7 listed the name, molecular formula, m/z, and Rt for each bile acid compound.
Test of the utilization of carbon sources by Christensenella strains
Using PYG broth (Hopebio, HB0398) as the basal medium, different carbon sources (Xylo-oligosaccharide, arabinose, fructose, 5 g/L) were added, respectively. PYG medium was used as the control to verify the utilization of these carbon sources by microorganisms. Fresh bacterial culture was injected into Hungate tubes at a 3% (v/v) inoculum size and incubated at 37°C. Cell growth was measured using a UV/visible spectrophotometer (Analytik Jena, GER), with readings taken every 6 hours until the growth reached a stable or decline phase, and the growth curve was plotted. Each experiment was carried out in triplicates. The carbon source utilization of strains was profiled using ANI MicroPlates (BIOLOG, USA) following the manufacturer’s instructions.
Test of pH tolerance of the Christensenella strains
O2-free PBS buffers were prepared at different pH values (2.0, 2.5, 3.0, 3.5, and 7.0) by adjusting with 1 M HCl. Bacterial cells were incubated with the aforementioned PBS buffers of different pH values for 4 hours at 37°C. Subsequently, they were diluted to the appropriate concentration using pH 7 PBS and then were plated on agar plates. After 5–6 days of growth, the cells on the agar plates were counted using an Automated Colony Counter (Shineso, CHN).
Test of bile tolerance of the Christensenella strains
A fresh bacterial suspension of 3% (v/v) was inoculated into the mmGAM broth supplemented with 0.3% bile (Shyuanye, CHN) and incubated at 37°C. And the bile-free broth was as a control. The OD600 was measured with a UV/visible spectrophotometer (Analytik Jena, GER) every 4 h until reaching OD600 = 0.3.
Antibiotic resistance determination of the Christensenella strains
50–100 µl of fresh cultures was spread onto mmGAM agar plates, then commercial antibiotics discs were placed on agar surface. After the anaerobic incubation at 37°C for 24–48 h, the diameter of the inhibition zone was measured. Three parallel experiments were conducted for each bacterial strain.
Statistical analysis and data visualization
For determination of proper statistical analysis method of the cohorts, the normality of probability distribution was tested with the Kolmogorov–Smirnov test, and the variance of probability distribution was tested with the Brown–Forsythe test. Then a non-parametric Kruskal–Wallis test followed by Dunn’s multiple comparison test was conducted for statistical analysis. All data analysis and visualization processes were performed using R and GraphPad Prism 9.0. Unless stated otherwise, experimental data are presented as mean ± SEM. Statistical significance is indicated by asterisks (*): *p < .05, **p < .01, ***p < .001, ****p < .0001.
Author contributions
XWS finished the experiment and the first draft of the manuscript. XWS, HJH and YLW worked on genome analysis. XMW, HJH, RQW, HYN, HYC, ML, and FLL participated in strains isolation, cultivation and characterization. RA worked on the nomination of new taxa.
XWS, XMW, and HJ worked the deposit of cultured strains. CL supervised on experimental methodology and data analysis, SJL concepted and supervised the research, and finalized the manuscript.
Consent for publication
All authors read and agree to the publication of this manuscript.
Ethics approval and consent to participate
This study was approved by the Ethics Committee of the School of Basic Medical Sciences, Shandong University (ECSBMSSDU2023-1-59).
Supplemental Material
Download Zip (48.5 MB)Acknowledgments
We thank NMDC (China National Microbiology Data Center) team for the data preservation, ChrisGMB homepage construction and maintenance. We would like to thank Zhifeng Li, Jing Zhu, Jingyao Qu and Guannan Lin from the Core Facilities for Life and Environmental Sciences, State Key laboratory of Microbial Technology of Shandong University for technical guidance. We would like to thank Xiaoju Li and Haiyan Sui from Shandong University Core Facilities for Life and Environmental Sciences for their help with the TEM.
Disclosure statement
No potential conflict of interest was reported by the author(s).
Data availability statement
The datasets generated and analyzed in this study are available as the following: Basically, all the descriptive information and data related to 87 ChrisGMB strains were available at the hGMB homepage (https://hgmb.nmdc.cn/subject/christensenellaceae). The16S rRNA gene sequences of the 87 strains were deposited in China National Microbiology Data Center (NMDC) and the accession numbers were listed in supplementary Table S5. All assembled genomes obtained in this study were available at NMDC under Project NMDC10018522 (https://nmdc.cn/resource/genomics/project/detail/).
Supplementary material
Supplemental data for this article can be accessed online at https://doi.org/10.1080/19490976.2024.2347725
Additional information
Funding
References
- Chen Z, Radjabzadeh D, Chen L, Kurilshikov A, Kavousi M, Ahmadizar F, Ikram MA, Uitterlinden AG, Zhernakova A, Fu J. et al. Association of insulin resistance and type 2 diabetes with gut microbial diversity: a microbiome-wide analysis from population studies. JAMA Netw Open. 2021;4(7):e2118811. doi:10.1001/jamanetworkopen.2021.18811.
- Goodrich JK, Waters JL, Poole AC, Sutter JL, Koren O, Blekhman R, Beaumont M, Van Treuren W, Knight R, Bell J. et al. Human genetics shape the gut microbiome. Cell. 2014;159(4):789–20. doi:10.1016/j.cell.2014.09.053.
- Roswall J, Olsson LM, Kovatcheva-Datchary P, Nilsson S, Tremaroli V, Simon MC, Kiilerich P, Akrami R, Krämer M, Uhlén M. et al. Developmental trajectory of the healthy human gut microbiota during the first 5 years of life. Cell Host Microbe. 2021;29(5):765–76.e3. doi:10.1016/j.chom.2021.02.021.
- Li X, Li Z, He Y, Li P, Zhou H, Zeng N. Regional distribution of Christensenellaceae and its associations with metabolic syndrome based on a population-level analysis. PeerJ. 2020;8:e9591. doi:10.7717/peerj.9591.
- Alcazar M, Escribano J, Ferré N, Closa-Monasterolo R, Selma-Royo M, Feliu A, Castillejo G, Luque V, Closa-Monasterolo R, Escribano J. et al. Gut microbiota is associated with metabolic health in children with obesity. Clin Nutr. 2022;41(8):1680–1688. doi:10.1016/j.clnu.2022.06.007.
- Morotomi M, Nagai F, Watanabe Y. Description of Christensenella minuta gen. nov. sp. nov. isolated from human faeces, which forms a distinct branch in the order Clostridiales, and proposal of Christensenellaceae fam. nov. Int J Syst Evol Microbiol. 2012;62(1):144–149. doi:10.1099/ijs.0.026989-0.
- Mazier W, Le Corf K, Martinez C, Tudela H, Kissi D, Kropp C, Coubard C, Soto M, Elustondo F, Rawadi G. et al. A new strain of Christensenella minuta as a potential biotherapy for obesity and associated metabolic diseases. Cells. 2021;10(4):10. doi:10.3390/cells10040823.
- Liu C, Du MX, Xie LS, Wang WZ, Chen BS, Yun CY, Sun X-W, Luo X, Jiang Y, Wang K. et al. Gut commensal Christensenella minuta modulates host metabolism via acylated secondary bile acids. Nat Microbiol. 2024;9(2):434–450. doi:10.1038/s41564-023-01570-0.
- Jiang Y, Du M-X, Xie L-S, Jiang M-Z, Zhang Y-K, Bi M-X, Liu C, Liu H, Liu S. The human-derived novel gut commensal Luoshenia tenuis regulates body weight and food intake in mice. Food Sci Hum Wellness. 2023;13(2):830–841. doi:10.26599/FSHW.2022.9250071.
- Ang WS, Law JW, Letchumanan V, Hong KW, Wong SH, Ab Mutalib NS, Chan K-G, Lee L-H, Tan LTH. A Keystone gut bacterium Christensenella minuta—A potential biotherapeutic agent for obesity and associated metabolic diseases. Foods (Basel, Switzerland). 2023;12(13):12. doi:10.3390/foods12132485.
- Lau SK, McNabb A, Woo GK, Hoang L, Fung AM, Chung LM, Woo PCY, Yuen K-Y. Catabacter hongkongensis gen. nov. sp. nov. isolated from blood cultures of patients from Hong Kong and Canada. J Clin Microbiol. 2007;45(2):395–401. doi:10.1128/JCM.01831-06.
- Lau SK, Fan RY, Lo HW, Ng RH, Wong SS, Li IW, Wu AKL, Ng KHL, Tseung S, Lee RA. et al. High mortality associated with catabacter hongkongensis bacteremia. J Clin Microbiol. 2012;50(7):2239–2243. doi:10.1128/JCM.00128-12.
- Elsendoorn A, Robert R, Culos A, Roblot F, Burucoa C. Catabacter hongkongensis bacteremia with fatal septic shock. Emerg Infect Dis. 2011;17(7):1330–1331. doi:10.3201/eid1707.101773.
- Atzeni A, Nishi SK, Babio N, Belzer C, Konstanti P, Vioque J, Corella D, Castañer O, Vidal J, Moreno-Indias I. et al. Carbohydrate quality, fecal microbiota and cardiometabolic health in older adults: a cohort study. Gut Microbes. 2023;15(2):2246185. doi:10.1080/19490976.2023.2246185.
- Tian H, Cui J, Ye C, Zhao J, Yang B, Xu Y, Ji S, Wang L, Lv X, Ma C. et al. Depletion of butyrate-producing microbes of the firmicutes predicts nonresponse to FMT therapy in patients with recurrent clostridium difficile infection. Gut Microbes. 2023;15(1):2236362. doi:10.1080/19490976.2023.2236362.
- Tavella T, Rampelli S, Guidarelli G, Bazzocchi A, Gasperini C, Pujos-Guillot E, Comte B, Barone M, Biagi E, Candela M. et al. Elevated gut microbiome abundance of Christensenellaceae, Porphyromonadaceae and Rikenellaceae is associated with reduced visceral adipose tissue and healthier metabolic profile in Italian elderly. Gut Microbes. 2021;13(1):1–19. doi:10.1080/19490976.2021.1880221.
- Belda E, Voland L, Tremaroli V, Falony G, Adriouch S, Assmann KE, Prifti E, Aron-Wisnewsky J, Debédat J, Le Roy T. et al. Impairment of gut microbial biotin metabolism and host biotin status in severe obesity: effect of biotin and prebiotic supplementation on improved metabolism. Gut. 2022;71(12):2463–2480. doi:10.1136/gutjnl-2021-325753.
- Brauer-Nikonow A, Zimmermann M. How the gut microbiota helps keep us vitaminized. Cell Host Microbe. 2022;30(8):1063–1066. doi:10.1016/j.chom.2022.07.010.
- Das P, Babaei P, Nielsen J. Metagenomic analysis of microbe-mediated vitamin metabolism in the human gut microbiome. BMC Genomics. 2019;20(1):208. doi:10.1186/s12864-019-5591-7.
- Wardman JF, Bains RK, Rahfeld P, Withers SG. Carbohydrate-active enzymes (CAZymes) in the gut microbiome. Nat Rev Microbiol. 2022;20(9):542–556. doi:10.1038/s41579-022-00712-1.
- Lombard V, Golaconda Ramulu H, Drula E, Coutinho PM, Henrissat B. The carbohydrate-active enzymes database (CAZy) in 2013. Nucleic Acids Res. 2014;42(D1):D490–5. doi:10.1093/nar/gkt1178.
- Wu H, Owen CD, Juge N, Czjzek M, Ficko-Blean E, Berrin J-G. Structure and function of microbial α-l-fucosidases: a mini review. Essays Biochem. 2023;67(3):399–414. doi:10.1042/EBC20220158.
- Owen CD, Tailford LE, Monaco S, Šuligoj T, Vaux L, Lallement R, Khedri Z, Yu H, Lecointe K, Walshaw J. et al. Unravelling the specificity and mechanism of sialic acid recognition by the gut symbiont Ruminococcus gnavus. Nat Commun. 2017;8(1):2196. doi:10.1038/s41467-017-02109-8.
- Li D, Fei T, Wang Y, Zhao Y, Dai L, Fu X, Li X. A cold-active 1,4-α-glucan branching enzyme from Bifidobacterium longum reduces the retrogradation and enhances the slow digestibility of wheat starch. Food Chem. 2020;324:126855. doi:10.1016/j.foodchem.2020.126855.
- Lopes AP, de Oliveira Castelo Branco RR, de Alcântara Oliveira FA, Campos MAS, de Carvalho Sousa B, Agostinho ÍR, Gonzalez AGM, Rocha JA, Pinheiro REE, Araújo AR. et al. Antimicrobial, modulatory, and antibiofilm activity of tt-farnesol on bacterial and fungal strains of importance to human health. Bioorg Med Chem Lett. 2021;47:128192. doi:10.1016/j.bmcl.2021.128192.
- Araújo Delmondes G, Pereira Lopes MJ, Araújo IM, de Sousa Borges A, Batista PR, Melo Coutinho HD, de Sousa Borges A, Alencar de Menezes IR, Barbosa-Filho JM, Bezerra Felipe CF. et al. Possible mechanisms involved in the neuroprotective effect of Trans,trans-farnesol on pilocarpine-induced seizures in mice. Chem Biol Interact. 2022;365:110059. doi:10.1016/j.cbi.2022.110059.
- Cheng W, Yang J, Nie Q, Huang D, Yu C, Zheng L, Cai M, Thomashow LS, Weller DM, Yu Z. et al. Volatile organic compounds from Paenibacillus polymyxa KM2501-1 control meloidogyne incognita by multiple strategies. Sci Rep. 2017;7(1):16213. doi:10.1038/s41598-017-16631-8.
- Kropp C, Le Corf K, Relizani K, Tambosco K, Martinez C, Chain F, Rawadi G, Langella P, Claus SP, Martin R. et al. The keystone commensal bacterium Christensenella minuta DSM 22607 displays anti-inflammatory properties both in vitro and in vivo. Sci Rep. 2021;11(1):11494. doi:10.1038/s41598-021-90885-1.
- Hong Y, Sheng L, Zhong J, Tao X, Zhu W, Ma J, Yan J, Zhao A, Zheng X, Wu G. et al. Desulfovibrio vulgaris, a potent acetic acid-producing bacterium, attenuates nonalcoholic fatty liver disease in mice. Gut Microbes. 2021;13(1):1–20. doi:10.1080/19490976.2021.1930874.
- Pu W, Zhang H, Zhang T, Guo X, Wang X, Tang S. Inhibitory effects of Clostridium butyricum culture and supernatant on inflammatory colorectal cancer in mice. Front Immunol. 2023;14:1004756. doi:10.3389/fimmu.2023.1004756.
- Concha E, Heipieper HJ, Wick LY, Ciudad GA, Navia R. Effects of limonene, n-decane and n-decanol on growth and membrane fatty acid composition of the microalga Botryococcus braunii. AMB Express. 2018;8(1):189. doi:10.1186/s13568-018-0718-9.
- Lim CS, Wong WF, Rosli R, Ng KP, Seow HF, Chong PP. 2-dodecanol (decyl methyl carbinol) inhibits hyphal formation and SIR2 expression in C. albicans. J Basic Microbiol. 2009;49(6):579–583. doi:10.1002/jobm.200900035.
- Zhang X, Zhang P, Liu Y, Liu Z, Xu Q, Zhang Y, Liu L, Yang X, Li L, Xue C. et al. Effects of caprylic acid and eicosapentaenoic acid on lipids, inflammatory levels, and the JAK2/STAT3 pathway in ABCA1-deficient mice and ABCA1 knock-down RAW264.7 cells. Nutrients. 2023;15(5):15. doi:10.3390/nu15051296.
- Shaaban MT, Ghaly MF, Fahmi SM. Antibacterial activities of hexadecanoic acid methyl ester and green-synthesized silver nanoparticles against multidrug-resistant bacteria. J Basic Microbiol. 2021;61(6):557–568. doi:10.1002/jobm.202100061.
- Gou H, Su H, Liu D, Wong CC, Shang H, Fang Y, Zeng X, Chen H, Li Y, Huang Z. et al. Traditional medicine Pien Tze Huang suppresses colorectal tumorigenesis through restoring gut microbiota and metabolites. Gastroenterology. 2023;165(6):1404–1419. doi:10.1053/j.gastro.2023.08.052.
- Wang M, Osborn LJ, Jain S, Meng X, Weakley A, Yan J, Massey WJ, Varadharajan V, Horak A, Banerjee R. et al. Strain dropouts reveal interactions that govern the metabolic output of the gut microbiome. Cell. 2023;186(13):2839–52.e21. doi:10.1016/j.cell.2023.05.037.
- Kuang J, Wang J, Li Y, Li M, Zhao M, Ge K, Zheng D, Cheung KCP, Liao B, Wang S. et al. Hyodeoxycholic acid alleviates non-alcoholic fatty liver disease through modulating the gut-liver axis. Cell Metab. 2023;35(10):1752–1766.e8. doi:10.1016/j.cmet.2023.07.011.
- Chaudhari SN, Luo JN, Harris DA, Aliakbarian H, Yao L, Paik D, Subramaniam R, Adhikari AA, Vernon AH, Kiliç A. et al. A microbial metabolite remodels the gut-liver axis following bariatric surgery. Cell Host Microbe. 2021;29(3):408–24.e7. doi:10.1016/j.chom.2020.12.004.
- Redzej A, Ukleja M, Connery S, Trokter M, Felisberto-Rodrigues C, Cryar A, Thalassinos K, Hayward RD, Orlova EV, Waksman G. et al. Structure of a VirD4 coupling protein bound to a VirB type IV secretion machinery. Embo J. 2017;36(20):3080–3095. doi:10.15252/embj.201796629.
- Gunn JS. Mechanisms of bacterial resistance and response to bile. Microbes Infect. 2000;2(8):907–913. doi:10.1016/S1286-4579(00)00392-0.
- Déjean G, Tudela H, Bruno L, Kissi D, Rawadi G, Claus SP. Identifying a Novel Bile Salt Hydrolase from the Keystone gut bacterium Christensenella minuta. Microorganisms. 2021;9(6):1252. doi:10.3390/microorganisms9061252.
- Sayin SI, Wahlström A, Felin J, Jäntti S, Marschall HU, Bamberg K, Angelin B, Hyötyläinen T, Orešič M, Bäckhed F. et al. Gut microbiota regulates bile acid metabolism by reducing the levels of tauro-beta-muricholic acid, a naturally occurring FXR antagonist. Cell Metab. 2013;17(2):225–235. doi:10.1016/j.cmet.2013.01.003.
- Owen JR, Noyes N, Young AE, Prince DJ, Blanchard PC, Lehenbauer TW, Aly SS, Davis JH, O’Rourke SM, Abdo Z. et al. Whole-genome sequencing and concordance between antimicrobial susceptibility genotypes and phenotypes of bacterial isolates associated with bovine respiratory disease. G3 (Bethesda, Md). 2017;7(9):3059–3071. doi:10.1534/g3.117.1137.
- Alcock BP, Raphenya AR, Lau TTY, Tsang KK, Bouchard M, Edalatmand A, Huynh W, Nguyen ALV, Cheng AA, Liu S. et al. CARD 2020: antibiotic resistome surveillance with the comprehensive antibiotic resistance database. Nucleic Acids Res. 2020;48:D517–d25. doi:10.1093/nar/gkz935.
- Waters JL, Ley RE. The human gut bacteria Christensenellaceae are widespread, heritable, and associated with health. BMC Biol. 2019;17(1):83. doi:10.1186/s12915-019-0699-4.
- Liu C, Du MX, Abuduaini R, Yu HY, Li DH, Wang YJ, Zhou N, Jiang M-Z, Niu P-X, Han S-S. et al. Enlightening the taxonomy darkness of human gut microbiomes with a cultured biobank. Microbiome. 2021;9(1):119. doi:10.1186/s40168-021-01064-3.
- Browne HP, Forster SC, Anonye BO, Kumar N, Neville BA, Stares MD, Goulding D, Lawley TD. Culturing of ‘unculturable’ human microbiota reveals novel taxa and extensive sporulation. Nature. 2016;533(7604):543–546. doi:10.1038/nature17645.
- Yang Y, Gu H, Sun Q, Wang J. Effects of Christensenella minuta lipopolysaccharide on RAW 264.7 macrophages activation. Microb Pathog. 2018;125:411–417. doi:10.1016/j.micpath.2018.10.005.
- Bubnov RV, Babenko LP, Lazarenko LM, Mokrozub VV, Spivak MY. Specific properties of probiotic strains: relevance and benefits for the host. Epma J. 2018;9(2):205–223. doi:10.1007/s13167-018-0132-z.
- Papadimitriou K, Zoumpopoulou G, Foligné B, Alexandraki V, Kazou M, Pot B, Tsakalidou E. Discovering probiotic microorganisms: in vitro, in vivo, genetic and omics approaches. Front Microbiol. 2015;6:58. doi:10.3389/fmicb.2015.00058.
- Kim WS, Cho CS, Hong L, Han GG, Kil BJ, Kang SK, Kim D-D, Choi Y-J, Huh C-S. Oral delivery of probiotics using pH-sensitive phthalyl inulin tablets. J Microbiol Biotechnol. 2019;29(2):200–208. doi:10.4014/jmb.1811.11021.
- Paik D, Yao L, Zhang Y, Bae S, D’Agostino GD, Zhang M, Kim E, Franzosa EA, Avila-Pacheco J, Bisanz JE. et al. Human gut bacteria produce ΤΗ17-modulating bile acid metabolites. Nature. 2022;603(7903):907–912. doi:10.1038/s41586-022-04480-z.
- Sun H, Guo Y, Wang H, Yin A, Hu J, Yuan T, Zhou S, Xu W, Wei P, Yin S. et al. Gut commensal Parabacteroides distasonis alleviates inflammatory arthritis. Gut. 2023;72(9):1664–1677. doi:10.1136/gutjnl-2022-327756.
- Liu C, Zhou N, Du MX, Sun YT, Wang K, Wang YJ, Li D-H, Yu H-Y, Song Y, Bai B-B. et al. The mouse gut microbial biobank expands the coverage of cultured bacteria. Nat Commun. 2020;11(1):79. doi:10.1038/s41467-019-13836-5.
- Kim M, Oh HS, Park SC, Chun J. Towards a taxonomic coherence between average nucleotide identity and 16S rRNA gene sequence similarity for species demarcation of prokaryotes. Int J Syst Evol Microbiol. 2014;64(Pt_2):346–351. doi:10.1099/ijs.0.059774-0.
- Macfarlane GT, Macfarlane S. Models for intestinal fermentation: association between food components, delivery systems, bioavailability and functional interactions in the gut. Curr Opin Biotechnol. 2007;18(2):156–162. doi:10.1016/j.copbio.2007.01.011.
- Kumar S, Stecher G, Li M, Knyaz C, Tamura KMX, Battistuzzi FU. MEGA X: molecular evolutionary genetics analysis across computing platforms. Mol Biol Evol. 2018;35(6):1547–1549. doi:10.1093/molbev/msy096.
- Saitou N, Nei M. The neighbor-joining method: a new method for reconstructing phylogenetic trees. Mol Biol Evol. 1987;4(4):406–425. doi:10.1093/oxfordjournals.molbev.a040454.
- Kimura M. A simple method for estimating evolutionary rates of base substitutions through comparative studies of nucleotide sequences. J Mol Evol. 1980;16(2):111–120. doi:10.1007/BF01731581.
- Zuo G. Cvtree: a parallel alignment-free phylogeny and taxonomy tool based on composition vectors of genomes. Genomics, Proteomics & Bioinf. 2021;19(4):662–667. doi:10.1016/j.gpb.2021.03.006.
- Lee I, Ouk Kim Y, Park SC, Chun J. OrthoANI: an improved algorithm and software for calculating average nucleotide identity. Int J Syst Evol Microbiol. 2016;66(2):1100–1103. doi:10.1099/ijsem.0.000760.
- Meier-Kolthoff JP, Carbasse JS, Peinado-Olarte RL, Göker M. TYGS and LPSN: a database tandem for fast and reliable genome-based classification and nomenclature of prokaryotes. Nucleic Acids Res. 2022;50(D1):D801–d7. doi:10.1093/nar/gkab902.
- Lagkouvardos I, Pukall R, Abt B, Foesel BU, Meier-Kolthoff JP, Kumar N, Bresciani A, Martínez I, Just S, Ziegler C. et al. The mouse intestinal Bacterial Collection (miBC) provides host-specific insight into cultured diversity and functional potential of the gut microbiota. Nat Microbiol. 2016;1(10):16131. doi:10.1038/nmicrobiol.2016.131.
- Qin QL, Xie BB, Zhang XY, Chen XL, Zhou BC, Zhou J, Oren A, Zhang Y-Z. A proposed genus boundary for the prokaryotes based on genomic insights. J Bacteriol. 2014;196(12):2210–2215. doi:10.1128/JB.01688-14.
- Sun XW, Abdugheni R, Huang HJ, Wang YJ, Jiang MZ, Liu C, Zhou N, Jiang H, Liu S-J. Bacteroides propionicigenes sp. nov. isolated from human faeces. Int J Syst Evol Microbiol. 2022;72(5). doi:10.1099/ijsem.0.005397.
- Zou Y, Xue W, Lin X, Hu T, Liu SW, Sun CH, Luo G, Lv M, Dai Y, Kristiansen K. et al. Taxonomic description and genome sequence of Christensenella intestinihominis sp. nov. a novel cholesterol-lowering bacterium isolated from human gut. Front Microbiol. 2021;12:632361. doi:10.3389/fmicb.2021.632361.
- Rosa BA, Hallsworth-Pepin K, Martin J, Wollam A, Mitreva M. Genome Sequence of Christensenella minuta DSM 22607T. Genome Announc. 2017;5(2). doi:10.1128/genomeA.01451-16.
- Chaumeil PA, Mussig AJ, Hugenholtz P, Parks DH, Hancock J. GTDB-Tk: a toolkit to classify genomes with the genome taxonomy database. Bioinformatics (Oxford, England). 2019;36(6):1925–1927. doi:10.1093/bioinformatics/btz848.
- Minh BQ, Schmidt HA, Chernomor O, Schrempf D, Woodhams MD, von Haeseler A, Lanfear R. IQ-TREE 2: new models and efficient methods for phylogenetic inference in the genomic era. Mol Biol Evol. 2020;37(5):1530–1534. doi:10.1093/molbev/msaa015.
- Jain C, Rodriguez LM, Phillippy AM, Konstantinidis KT, Aluru S. High throughput ANI analysis of 90K prokaryotic genomes reveals clear species boundaries. Nat Commun. 2018;9(1):5114. doi:10.1038/s41467-018-07641-9.
- Hyatt D, Chen GL, Locascio PF, Land ML, Larimer FW, Hauser LJ. Prodigal: prokaryotic gene recognition and translation initiation site identification. BMC Bioinf. 2010;11(1):119. doi:10.1186/1471-2105-11-119.
- Huerta-Cepas J, Szklarczyk D, Heller D, Hernández-Plaza A, Forslund SK, Cook H, Mende DR, Letunic I, Rattei T, Jensen L. et al. eggNOG 5.0: a hierarchical, functionally and phylogenetically annotated orthology resource based on 5090 organisms and 2502 viruses. Nucleic Acids Res. 2019;47(D1):D309–d14. doi:10.1093/nar/gky1085.
- Kanehisa M, Furumichi M, Sato Y, Kawashima M, Ishiguro-Watanabe M. KEGG for taxonomy-based analysis of pathways and genomes. Nucleic Acids Res. 2023;51(D1):D587–d92. doi:10.1093/nar/gkac963.
- Galperin MY, Wolf YI, Makarova KS, Vera Alvarez R, Landsman D, Koonin EV. COG database update: focus on microbial diversity, model organisms, and widespread pathogens. Nucleic Acids Res. 2021;49(D1):D274–d81. doi:10.1093/nar/gkaa1018.
- Liu B, Zheng D, Zhou S, Chen L, Yang J. VFDB 2022: a general classification scheme for bacterial virulence factors. Nucleic Acids Res. 2022;50(D1):D912–d7. doi:10.1093/nar/gkab1107.
- Page AJ, Cummins CA, Hunt M, Wong VK, Reuter S, Holden MT, Fookes M, Falush D, Keane JA, Parkhill J. Roary: rapid large-scale prokaryote pan genome analysis. Bioinformatics (Oxford, England). 2015;31(22):3691–3693. doi:10.1093/bioinformatics/btv421.
- Chaudhari NM, Gupta VK, Dutta C. BPGA- an ultra-fast pan-genome analysis pipeline. Sci Rep. 2016;6(1):24373. doi:10.1038/srep24373.
- Alikhan NF, Petty NK, Ben Zakour NL, Beatson SA. BLAST ring image generator (BRIG): simple prokaryote genome comparisons. BMC Genomics. 2011;12(1):402. doi:10.1186/1471-2164-12-402.
- Dai D, Zhu J, Sun C, Li M, Liu J, Wu S, Ning K, He L-J, Zhao X-M, Chen W-H. et al. Gmrepo v2: a curated human gut microbiome database with special focus on disease markers and cross-dataset comparison. Nucleic Acids Res. 2022;50(D1):D777–d84. doi:10.1093/nar/gkab1019.
- Wood DE, Lu J, Langmead B. Improved metagenomic analysis with Kraken 2. Genome Biol. 2019;20(1):257. doi:10.1186/s13059-019-1891-0.
- Lu J, Breitwieser FP, Thielen P, Salzberg SL. Bracken: estimating species abundance in metagenomics data. PeerJ Comput Sci. 2017;3:e104. doi:10.7717/peerj-cs.104.
- Abdugheni R, Wang W-Z, Wang Y-J, Du M-X, Liu F-L, Zhou N, Jiang C-Y, Wang C-Y, Wu L, Ma J. et al. Metabolite profiling of human-originated lachnospiraceae at the strain level. iMeta. 2022;1(4):e58. doi:10.1002/imt2.58.
- Sumner LW, Amberg A, Barrett D, Beale MH, Beger R, Daykin CA, Fan TWM, Fiehn O, Goodacre R, Griffin JL. et al. Proposed minimum reporting standards for chemical analysis Chemical Analysis Working Group (CAWG) Metabolomics Standards Initiative (MSI). Metabolomics: Off J Metabolomic Soc. 2007;3(3):211–221. doi:10.1007/s11306-007-0082-2.