
ABSTRACT
Colorectal cancer (CRC), a malignant tumor worldwide, is associated with gut microbiota. The influence of gut microbe-derived metabolites on CRC has attracted a lot of attention. However, the role of immunity mediated by commensal microbiota-derived metabolites in tumorigenesis of CRC is not intensively explored. Here we monitored the gut microbial dysbiosis in CRC mouse model (ApcMin/+ model) without dietary and pharmacological intervention, followed by characterized of metabolites enriched in CRC model mice. Profound changes of gut microbiome (bacteriome) were observed during intestinal disorders. Metabolomic profiling indicated that agmatine, derived from the gut bacteria i.e. Blautia, Odoribacter, Alistipes and Paraprevotella, could interact with Rnf128 to suppress the Rnf128-mediated ubiquitination of β-catenin to further upregulate the downstream targets of β-catenin including Cyclin D1, Lgr5, CD44 and C-myc, thus activating Wnt signaling. The activated Wnt signaling pathway promoted dysplasia of intestinal cells and inflammatory infiltration of lymphocytes via inducing the upregulation of pro-inflammatory cytokines (IL-6 and TNF-α) and downregulation of anti-inflammatory cytokine (IL-10), thereby contributing to colorectal carcinogenesis. Therefore, our study presented novel insights into the roles and mechanisms of gut microbiota in pathogenesis of CRC.
Introduction
Colorectal cancer, a high-risk tumor, ranks the third and fourth among all malignancies worldwide in terms of morbidity and mortality.Citation1 Due to the changes of dietary habits, the incidence and mortality of colorectal cancer have been on the rise over the years.Citation2 Especially the rate of colorectal cancer is increasing in younger individuals.Citation3 In recent years, it is found that the occurrence and development of colorectal cancer are associated with the gut microbiota.Citation4,Citation5 So far, two models have been proposed to reveal the relationship between the gut microbiota and the incidence of colorectal cancer, including alpha-bug model and driver-passenger model.Citation6,Citation7 The certain members of the gut bacteria possessing unique virulence properties, the bacteria called as alpha-bugs, not only are directly pro-oncogenic, but able to reshape the bacterial community of the colon to enhance and further promote alpha-bug-induced mucosal immune responses and changes in colonic epithelial cells leading to colorectal cancer.Citation6 The colorectal cancer can also be initiated by “driver” bacteria, which are eventually replaced by “passenger” bacteria that either accelerate or prevent tumorigenesis.Citation7 In sterile animals, the incidence of colorectal cancer is significantly reduced.Citation8 But once imbalanced intestinal flora is transplanted into sterile animals, the immune functions of these animals will be reduced with the evident increased incidence of colorectal cancer.Citation8 The microbiota located in tumor tissues does not differ significantly from that in the normal mucosa within the same individual, suggesting that a colorectal cancer distinctive microbiota is already present in early stages of carcinogenesis.Citation9,Citation10 The gut bacteria and their metabolites or/and genotoxins create an internal environment beneficial to carcinogenesis through DNA damages, continuous/chronic inflammatory processes and the changes of the immune system.Citation11,Citation12 At present, however, the underlying mechanism of gut microbiota in colorectal tumorigenesis has not been well explored.
It has been highlighted that some key factors, which bridge the gut microbiota and colorectal cancer, are microbiota-derived metabolites.Citation13 As signal molecules and/or substrates of metabolic processes, the microbe-derived metabolites exhibit their effects in the hosts.Citation14 What we do know for certain is that short-chain fatty acids (SCFAs), such as acetate, butyrate and propionate, are typical byproducts of microbial metabolism and correlate with the incidence of colorectal cancer.Citation15 Among acetate, butyrate and propionate, butyrate has been well characterized, which can directly modulate the proliferation and apoptosis of colorectal cancer cells.Citation16 Except for the roles of tumor inhibition, several microbial metabolites contribute to colorectal carcinogenesis, including trimethylamine n-oxide (TMAO), H2S and secondary bile acids.Citation17 Based on the carcinogen-induced rat tumor model, it is found that deoxycholic acid, one of the main secondary bile acids, can raise the rate of colorectal cancer.Citation18 H2S may be involved in colorectal tumorigenesis owing to its pro-inflammatory and genotoxic effects at physiological concentration.Citation19 TMAO is closely related to the development of a series of cancers, particularly colorectal cancer.Citation20 In colorectal cancers, the gut bacteria-derived polyamines, such as putrescine and cadaverine, are associated to gastrointestinal cancers via triggering inflammation and proliferation.Citation21,Citation22 However, the information about the underlying mechanism of polyamine-mediated tumorigenesis is very limited.
To explore the role of gut microbiota in colorectal tumorigenesis, the intestinal microbiome of ApcMin/+ mice, a murine model of intestinal adenomas, was characterized in this study. Further data revealed that agmatine, generated by gut bacteria including Blautia, Odoribacter, Alistipes and Paraprevotella, interacted with Rnf128 to activate the Wnt signaling pathway, thus contributing to colorectal tumorigenesis.
Materials and methods
Experimental mice and the collection of samples
The colorectal cancer model C57BL/6-ApcMinC/Nju mice (ApcMin/+ mice) and the corresponding C57BL/6JNju wild-type mice were obtained from Shanghai South Model Biotechnology Co. Ltd (Shanghai, China). The 2-month-old mice were housed at Zhejiang Experimental Animal Center of Zhejiang Academy of Medical Sciences under specific pathogen free (SPF) condition. The fecal samples of mice were collected everyday and subjected to the fecal occult blood test. When the mice were 4 months old, fecal occult blood appeared in ApcMin/+ mice but not in the healthy mice, showing the emergence of adenomas in the ApcMin/+ mice. The mice were raised for further 2 months. Then the mice were sacrificed. The feces and the intestines were collected for later use. All the procedures performed on mice were guided in accordance with the protocols approved by the China Institutional Animal Care and Use Committee (IACUC).
Histological analysis and pathologic scoring
The intestinal tissues were fixed in 10% neutral formalin, followed by dehydration in ascending series of ethanol, transparention using xylene and paraffin embedding. Subsequently the paraffin-embedded tissues were cut into 5 μm-thick sections, dewaxed in xylene, and rehydrated through decreasing concentrations of ethanol. The slides were successively incubated with hematoxylin solution (Sangon Biotech, Shanghai, China) for 10 min and eosin solution (Sangon Biotech, Shanghai, China) for 3 min, followed by dehydration with graded ethanol. After the addition of xylene, the sections were observed using a light microscope (Nikon, Tokyo, Japan).
Pathologic scoring was performed using hematoxylin and eosin (H & E) staining data in a blinded manner. Three independent parameters of each sample were examined, including severity of inflammation (0–3: none, slight, moderate and severe), depth of injury (0–3: none, mucosal, mucosal and submucosal, and transmural) and extent of crypt damage (0–4: none, basal 1/3 damaged, basal 2/3 damaged, only surface epithelium intact, and entire crypt and epithelium lost).Citation23 The sum of these parameter scores was multiplied by a factor which reflected the percentage of tissue involvement (1–4: 0%-25%, 26%-50%, 51%-75%, and 76%-100%).
Sequencing of microbial metagenomes and data analysis
The bacterial DNA was extracted from the fecal samples of mice using the Fast DNA Spin Kit for feces (MP, Santa Ana, California, USA). The extracted bacterial DNA was amplified with the GenomiPhi V2 DNA amplification kit according to the manufacturer’s instructions (GE Healthcare Life Science, Buckinghamshire, UK). Subsequently the amplified products were pyrosequenced using Illumina PE250 (Illumina Inc., San Diego, CA) by Mingke Biotechnology Co., Ltd (Hangzhou, China).
The raw data were trimmed to remove the reads of adapters and duplicate reads by SOAPnuke software (v.1.5.3) (http://soap.genomics.org.cn/). Then the reads with a minimum length of 50 bp were applied to de novo contig assembly using the SOAP assembly software with the criterion of a 90% minimum overlap identity.Citation24 The assembly data were aligned with the sequences in the NCBI nonredundant nucleic (NT) database and the nonredundant protein (NR) database using BLASTn and BLASTx, respectively. The taxonomies of the aligned reads with the best BLAST value (E value ≤ 10−3) were selected for further analysis.
KEGG (Kyoto encyclopaedia of genes and genomes) pathway annotation
The metagenomic data were aligned against the KEGG database (https://www. kegg.jp/). KEGG annotation was conducted via KOBAS 3.0 (http://kobas.cbi.pku.edu. cn/kobas3) with default parameters in single best hit mode. The predicted proteins with KEGG orthology group (KO) were further mapped at the KEGG pathway.
Principal component analysis (PCA)
PCA, a linear transform extracting the most key elements in the data, was performed with DeviumWeb (https://github.com/dgrapov/DeviumWeb). The output consisted of score plots to visualize the contrast between sample set and loading plot to interpret cluster separation.Citation25
Spearman’s correlation analysis
Spearman’s correlation analysis was conducted to evaluate the relationship between KEGG metabolic pathways and mouse gut bacteria at the genus level. Spearman’s correlation and the statistical significance were calculated using the cor and cor.test functions in R (R version 3.3.2, R Foundation for Statistical Computing, Vienna, Austria). Differences were considered to be significant when p < .05.
Sample preparation for GC-MS (gas chromatography-mass spectrometry)
A mouse fecal sample (2 mg) was added with 30 μL of L-2-chlorophenylalanine (0.3 mg/mL) (Sangon Biotech, Shanghai, China) dissolved in methanol as internal standard and 800 μL methanol/water at a ratio of 4/1 (vol/vol). The mixture was vortexed for 30s and sonicated for 10 min. After incubation on ice for 30 min, the mixture was centrifuged at 15,000×g (4 °C) for 20 min. The supernatant was freeze-dried with nitrogen. Subsequently the sample was supplemented with 50 μL methoxyamine for methoxyamination, followed by shaking at 1500×g for 2 h at 37°C. The mixture was incubated with 40 μL N,O-bis (trimethylsilyl) trifluoroacetamide (BSTFA) and 1% trimethylchlorosilane (TMCS) for 90 min at 37°C for trimethylsilyl derivatization. The pooled sample was prepared as quality control (QC) sample, which were blinded and randomized and were served as QC checks through injecting at scheduled intervals for monitoring shifts in retention indices (RI). Moreover, the deionized water was used as the control sample to account for the background noise produced during sample processing and data analysis.
GC-MS-based metabolomics data acquisition and analysis
Samples were analyzed on an Agilent 7890A/5975C GC-MS system (Agilent Technologies Inc., CA, USA) employing a HP-5 MS capillary column coated with 5% phenyl methyl silox (Agilent J & W Scientific, Folsom, CA, USA). The obtained GC/MS raw data in [D] format were converted to mzXML format using msConvert (ProteoWizard tool) and subsequently preprocessed, cleaned, deconvoluted and aligned using the Automated Mass Spectral Deconvolution and Identification System (AMDIS, National Institute of Standards and Technology, USA) interface to match against the freely available Mass Spectral (MS) and Retention Time Index (RI) (MSRI) library at the Golm Metabolome Database. Metabolites were then identified by comparison to the National Institute of Standards and Technology Mass Spectral Reference Library 2011 (NIST11/2011; National Institute of Standards and Technology, USA). Following log transformation and imputation with minimum observed values for each compound, the data were analyzed using one-way analysis of variance (ANOVA).
Identification of the proteins bound to agmatine
The N-hydroxylsuccinimide (NHS)-activated beads 4FF were incubated with agmatine overnight at 4°C with gentle rotation according to the manufacturer’s instructions (Smart-Life Sciences Inc., China). After rinses with deionized water, the agmatine-coupled beads were incubated with blocking buffer (0.1 M Tris-HCl, pH 8.5) at room temperature for 2 h. Subsequently the proteins extracted from mouse intestinal tissues were incubated with agmatine-coupled beads overnight at 4°C. After washes with PBS in the presence of 0.5% Triton X-100, the elutes were subjected to SDS-PAGE with Coomassie blue staining. The proteins specifically bound to agmatine were subjected to mass spectrometry analysis using Q-Exactive (Orbitrap) mass spectrometer (Thermo Fisher Scientific, San Jose, CA) in the reflection mode with an m/z range of 400 to 2000 and a 19 kV accelerating voltage. The mass spectrometry data obtained were processed using Progenesis QI Proteomics software (Nonlinear Dynamics, version 4.0), followed by the protein identification using Mascot search algorithm (Matrix Science, Boston, Massachusetts, USA).
Establishment of azoxymethane (AOM)/dextran sodium sulfate (DSS)-induced colorectal cancer model
The healthy mice (C57BL/6JNju mice) were applied to construct the AOM/DSS-induced colorectal cancer model. The male 8-week-old mice purchased from GemPharmatech Co., Ltd. (Nanjing, China) were divided into 2 groups (5 mice per group). One group was treated only with AOM/DSS and the other group was treated with AOM/DSS and agmatine. At Day 0, all the mice received AOM through intraperitoneal injection (10 mg/kg body weight) to mimic sporadic colorectal cancer. Drinking water containing 2.5% DSS was administered to mice for 7 days, followed by 7 days of drinking water alone. This DSS treatment was repeated twice. For the treatment of agmatine, the mice received agmatine via coloclysis once a week for 6 weeks (10 mM/week). The body weight and fecal occult blood of mice were monitored once every two weeks. After raising for 7 weeks, the mice were sacrificed and the intestinal adenomas were harvested. All procedures adhered to the guidelines approved by the China Institutional Animal Care and Use Committee (IACUC).
Isothermal titration calorimetry
Isothermal titration calorimetry (ITC) was conducted as described previously.Citation26 Briefly, agmatine (200 mM) was titrated into the protein solution of Hspa5 or Rnf128 (100 μM) with a volume of 10 μL per injection using the MicroCal 2000 microcalorimeter (GE Healthcare, USA). Data were analyzed with Origin software (San Clemente, CA, USA) to yield the enthalpy change, association constant and other thermodynamic parameters.
Fecal occult blood test
Fresh fecal samples of mice were subjected to fecal occult blood test using a commercial kit (Baso Diagnostics Inc., Zhuhai, China). The sample was applied to the test card, followed by the addition of developer A and B. The color reaction was observed in 2 minutes.
Analysis of bacterial 16S rRNA gene sequence
The variable region V4-V5 of bacterial 16S rRNA gene was amplified by PCR using sequence-specific primers (515F, 5’-GTGCCAGCMGCCGCGG-3’; 907 R, 5’-C CGTCAATTCMTTTRAGT-3’). The PCR products were subjected to library construction using NEB Next®Ultra™DNA Library Prep Kit for Illumina (New England BioLabs, USA), followed by sequencing with the MiSeq PE300 sequencing instrument (Illumina, Inc., CA, USA). The paired-end reads were generated and assigned to each sample based on their specific barcodes and then merged with FLASH (Fast Length Adjustment of Short reads) software. Sequence analysis was conducted by Usearch (Uparse v6.0.307) software package using the UPARSE-OTU and UPARSE-OTUref algorithms. Moreover, in-house Perl scripts were used to analyze α and β diversities. The sequences with more than 97% similarity thresholds were allocated to one operational taxonomic unit (OTU) using CD-HIT (v4.6.1), and classification of representative sequences for each OTU was applied, followed by the assignment of taxonomic data with Ribosomal Database Project (RDP) classifier 2.10.1 to each sequence. The lowest taxonomic annotation for an OTU was defined as having a consensus assignment score of ≥ 80.
Western blot analysis
Intestinal tissues were lysed in radio immunoprecipitation assay (RIPA) buffer added with protease inhibitor phenylmethylsulfonyl fluoride (PMSF) (Thermo Scientific Inc, USA) for 30 min and then centrifuged at 15,000×g for 15 min. The proteins were separated using 12% sodium dodecyl sulfate-polyacrylamide gel electrophoresis (SDS-PAGE) and transferred to a nitrocellulose membrane. After blocking with 5% bovine serum albumin (BSA) for 2 h, the membrane was incubated with a primary antibody at 4°C overnight. After rinses for several times, the membrane was incubated with the secondary antibody for 1.5 h at room temperature. The membrane was visualized using enhanced chemiluminescence system (ChampGel, China). All the antibodies used were purchased from Santa Cruz Biotechnology (USA).
Immunohistochemistry analysis
The formalin-fixed intestinal tissues were embedded in paraffin and then cut into 5-μm slides. These tissue slides were incubated with the primary antibody against β-catenin, Cyclin D1, Ki-67 or p21 (Santa Cruz Biotechnology, USA) at 4°C overnight. After washes with PBS, the slides were incubated with the second antibody (Santa Cruz Biotechnology, USA) for 30 min at 37°C. Subsequently, the slides were counterstained with hematoxylin sequentially.
Agmatine administration in mouse intestine
C57BL/6J mice (male, 6 weeks old) were administered with 100 μl saline containing agmatine (0, 0.1 or 100 mM) via coloclysis. Then the mice were maintained for more than 10 min to retain agmatine in the intestine. Twenty hours later, the mice were sacrificed. The intestinal samples were collected for later use.
Impacts of agmatine on the stability of β-catenin
The healthy mice were treated with of agmatine (100 mM, n = 5) via coloclysis and/or intraperitoneal injection of MG132 (10 μg/kg body weight, n = 5). MG132 (MedChemExpress, USA), a proteasome inhibitor, was dissolved in dimethylsulfoxide (DMSO) and then diluted with saline for intraperitoneal injection. After raising for 24 h, the large intestines of mice were collected for later use.
Cycloheximide (CHX) chase assay
The half-life of β-catenin protein was analyzed using the CHX chase assay. The healthy mice were administrated with CHX (30 mg/kg body weight) (MedChemExpress, USA) via intraperitoneal injection. At different time points, the large intestines of mice were collected. Subsequently Western blot analysis was conducted to detect the protein level of β-catenin.
Molecular docking
Molecular docking was carried out using the UCSF DOCK 6.9, which could help us identify the potential binding poses and scores between each prepared receptor and ligand structures in the corresponding datasets. The PDB (protein data bank) file of protein Rnf128 and the.mol2 file of small molecule agmatine were prepared for docking using RSCB PDB database (https://www.rcsb.org/) and ZINC15 database (https://zinc15.docking.org/), respectively. The docking program was run according to the respective manuals and therefore the potential docking poses were revealed. For each docking pose in UCSF DOCK 6.9, grid score (kcal/mol), grid vdw (kcal/mol), grid es (kcal/mol), internal energy (kcal/mol) and cluster size were calculated and shown. The binding pose with the best docking score was output.
Cell viability assay
Colorectal cancer cells (HCT116) were seeded into a 96-well plate (1000 cells per well). Then agmatine (0, 1, 10 or 100 μM) was added into the cells. After incubation for different time, the cells were subjected to 3-(4, 5-dimethylthiazol-2-yl)-5-(3- carboxymethoxyphenyl)-2-(4-sulfophenyl)-2 H tetrazolium (MTS) assay according to the manufacturer’s instructions (Promega, Madison, WI, USA). Briefly, 20 μL MTS solution was added into each well, followed by incubation for 2 h at 37°C. The absorbance was measured using a microplate reader at 490 nm.
Random forest
Random forest is a popular supervised machine learning algorithm constructed from decision trees. By leveraging ensemble learning, random forest combines multiple classifiers to tackle complex tasks, which addresses both regression and classification problems. Here, random forest analysis was carried out using randomForest v4.6.12.
Culture of bacteria and identification of agmatine
Bacteria (Odoribacter splanchnicus and Paraprevotella clara) were cultured anaerobically in Chopped Meat Carbohydrate Broth (CMC) (Shandong Tuopu Biol-Engineering Co. Ltd, Shandong, China) at 37°C overnight. Blautia obeum was cultured anaerobically in DSMZ Medium 104 (Shandong Tuopu Biol-Engineering Co. Ltd) at 37°C overnight. Subsequently the supernatant of bacteria was collected and subjected to the extraction of compounds using 80% methanol. After drying by a vacuum spin dryer, the compounds were dissolved in acetonitrile and then centrifuge to collect the supernatant. The supernatant was analyzed by the rapid liquid chromatography-triple quadrupole mass spectrometer (Agilent 6460) (Agilent Technology Co., Ltd, USA).
Statistical analysis
Statistical analysis was performed using GraphPad Prism version 9.0. One-way analysis of variance (ANOVA) and Student’s t-test were conducted to determine the statistical significance between treatments.
Results
Disease-specific bacterial composition in the gut of mice with colorectal cancer
To explore the diversity and composition of gut microbiota of mice with colorectal cancer, the bacteria isolated from the feces of 8 mice with colorectal cancer (ApcMin/+ mice) or 8 healthy mice were subjected to the bacterial 16S rRNA sequencing. The feces of ApcMin/+ mice (CRC models) at month 2 (F1) and month 6 (F2), respectively representing the time points before and after the emergence of intestinal adenomas, as well as the feces specimens of the healthy mice at the same time points, were collected for the analyses of mouse gut microbiota (). The fecal occult blood test indicated that the ApcMin/+ mice yielded strongly positive signals of occult blood when they were 6 months old (), suggesting the existence of intestinal adenomas. The results of hematoxylin and eosin staining of intestinal issues revealed that ApcMin/+ mice harbored a high-grade intestinal dysplasia compared with the control (). These data indicated that intestinal adenomas appeared in ApcMin/+ mice.
Figure 1. Disease-specific bacterial composition in the gut of murine model.
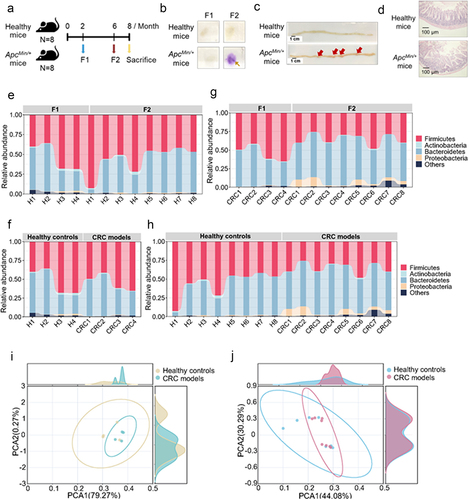
The sequencing analysis of bacterial 16S rRNA gene of ApcMin/+ mice (CRC models, F1 and F2 samples) and healthy controls (F1 and F2 samples) yielded a total of 762,920 reads and 3,951 operational taxonomic units (OTUs) (GenBank accession no. PRJNA825639). Based OTUs at 3% dissimilarity, the rarefaction curves of 24 samples approached plateaus, indicating that the sequencing data represented the gut microbiota of mice (Fig S1a). To evaluate the alterations of bacterial diversity between the two time points in healthy controls, the sequences were aligned to estimate α diversity. The results revealed that there was no statistically significant difference of chao, shannon or simpson index among these groups of mice at F1 and F2 points (Fig S1b-g). Additionally, the relative proportions of dominant taxa at phylum level were evaluated by microbial taxon assignment in these two groups, and the results indicated that the gut microbiota from F1 and F2 groups of mice appeared similar in composition, composing mainly of Bacteroidetes and Firmicutes (). When the gut microbiota of F1 group of healthy controls was compared to that of CRC models at the same age in terms of composition, the assessment essentially generated similar results (). Specifically, Proteobacteria markedly increased in CRC models (). Similarly, the intra group comparison revealed that proteobacteria, the typical microbial signature of dysbiosis in gut microbiota, was more abundant in F2 group compared to that in F1 group of CRC models ().
The principal component analysis (PCA) of mouse gut microbiota showed that there was no significant difference of gut microbial composition between the individuals of healthy mice or ApcMin/+ mice at month 2 (F1 samples) (), indicating that ApcMin/+ mice and healthy mice shared the similar gut microbiota before the emergence of intestinal adenomas. However, the gut bacteria of ApcMin/+ mice at month 6 (F2 samples) were very different from those of ApcMin/+ mice at month 2 (F1 samples) ().
Potential bacterial markers of colorectal cancer
To further identify the bacterial markers of CRC, a random forest classifier of healthy controls versus CRC models was evaluated based on genus-summarized abundances (). Tenfold cross-validation showed the 50 predictive bacterial signatures, for instance, Blautia, Odoribacter, Alistipes and Paraprevotella ().
Figure 2. Potential bacterial markers of colorectal cancer.
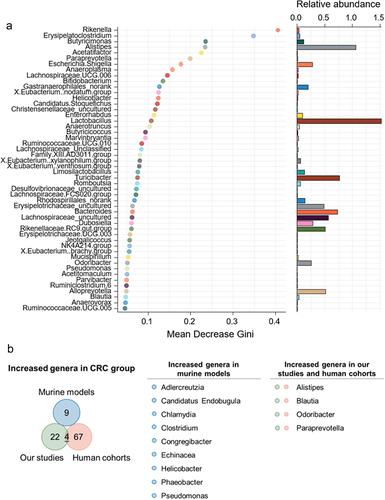
Compared to data from human cohorts and animal models in other studies, 4 bacterial genera identified in our studies stood out (), hinting that Blautia, Odoribacter, Alistipes and Paraprevotella might be promising bacterial signatures of colorectal cancer.
Relationship between gut bacteria-derived metabolites and colorectal cancer
To reveal the relationship between the functions of gut bacteria and colorectal cancer, the bacteria from the feces of ApcMin/+ mice (F1 and F2 samples) and healthy mice (F1 and F2 samples) were subjected to metagenomic analysis. The metagenomic analysis generated ~ 40 Gb raw data (Table S1). A total of 139,823,513 reads were assembled into 521,652 contigs (Table S1).
The metagenomic data were subjected to KEGG pathway analysis, followed by the principal component analysis (PCA). The results showed that there was no significant difference of the abundances of KEGG pathways between F1 and F2 samples of healthy mice, indicating that the functions of mouse gut bacteria were stable during experiments (Fig S2a). The similar results were obtained between F1 samples of healthy mice and ApcMin/+ mice (Fig S2b). These data revealed that the functions, including metabolisms, of the gut bacteria of mice before the occurrence of intestinal adenomas were stable between the individuals of healthy mice and colorectal cancer mice. However, the abundances of KEGG pathways of F2 samples of ApcMin/+ mice were significantly different from those of F1 samples of ApcMin/+ mice and those of F2 samples of healthy mice (Fig S2c and S2d). These results revealed that the occurrence of intestinal adenomas was associated with the functions of the gut bacteria of mice.
The results indicated that the metabolism category accounted for almost half of the upregulated KEGG pathways of the gut bacteria in ApcMin/+ mice (), showing that the gut bacteria played importance roles in the metabolism of mice with colorectal cancer.
Figure 3. Relationship between gut bacteria-derived metabolites and colorectal cancer.
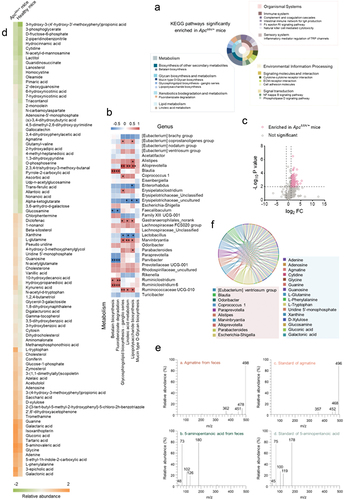
To further characterize the relationships between the gut bacteria of mice with colorectal cancer and the upregulated metabolic pathways, spearman’s correlation analysis has been performed. The results revealed that the gut bacteria of CRC models, belonging to 6 genera, were positively correlated with 5 metabolic pathways, while a gut bacterium was negatively correlated with 2 metabolic pathways (). Alloprevotella showed positive correlation with lipopolysaccharide biosynthesis, glycosphingolipid biosynthesis-ganglio series and linoleic acid metabolism. Positive corrections also existed between Marvinbryantia and glycosphingolipid biosynthesis-ganglio series, Ruminococcaceae UCG-010 and lipopolysaccharide biosynthesis, Ruminiclostridium, Blautia and Ruminiclostridium 6 and fluorobenzoate degradation, Blautia and Ruminiclostridium 6 and betalain biosynthesis (). However, Parvibacter was negatively correlated with betalain biosynthesis and fluorobenzoate degradation ().
The above data showed that the gut bacteria of ApcMin/+ mice played important roles in metabolisms. Therefore, the metabolome of mouse gut bacteria was explored. The GC-MS results revealed that a total of 376 metabolites were obtained from ApcMin/+ and healthy mice. Among them, 95 metabolites were significantly enriched in ApcMin/+ mice, while no metabolite was significantly enriched in healthy mice (). To confirm the GC-MS data, the standards of agmatine (agmatine sulfate) and 5-aminopentanoic acid, randomly selected from the 95 metabolites, were subjected to the GC-MS analysis. The results showed that the spectra of agmatine or 5-aminopentanoic acid from fecal samples matched that of the standard (), thus confirming the GC-MS data.
To explore whether these 95 metabolites were associated with the bacteria enriched in ApcMin/+ mice, the 95 metabolites were subjected to comparison analysis based on the virtual metabolic human database (http://www.vmh.life) to decipher the relationship between bacteria and metabolites. The results indicated that 10 bacteria enriched in ApcMin/+ mice, including Alloprevotella, Marvinbryantia, Blautia, Escherichia-Shigella, Alistipes, [Eubacterium] ventriosum group, Paraprevotella, Coprococcus 1, Odoribacter and Parabacteroides, were markedly correlated with 16 bacterial metabolites (adenine, adenosine, agmatine, cytidine, D-xylulose, galactonic acid, gluconic acid, glucosamine, glycine, guanine, guanosine, L-glutamine, L-phenylalanine, L-tryptophan, uridine 5’−monophosphate and xanthine) enriched in ApcMin/+ mice (). Furthermore, of the 16 metabolites, adenine, adenosine, agmatine, cytidine, D-xylulose, gluconic acid, glucosamine, glycine, guanine, guanosine, L-glutamine, L-phenylalanine, L-tryptophan and xanthine were associated with colorectal cancer based on the data from the human metabolome database (HMDB) (https://hmdb.ca/).
Collectively, these data indicated that 95 metabolites, secreted by gut bacteria of mouse, were the signature metabolites associated with colorectal cancer. Among them, 14 metabolites played important roles in the progression of colorectal cancer of humans.
Promotion of inflammation by the gut metabolites to induce colorectal carcinogenesis
To explore the influence of the metabolites from the gut bacteria of mice on colorectal carcinogenesis, agmatine, a compound with a higher content in the gut of mice with colorectal cancer, was further characterized. Based on the previous data (Liu et al., 2017), it was found that the agmatine content was significantly elevated the CRC rats compared to healthy rats (). The concentration of agmatine in the CRC patients was much higher than that in the healthy donors (). These data showed the important role of agmatine in colorectal cancer. The Western blot results showed that the coloclysis of agmatine led to significant increases of the contents of β-catenin and cyclin D1 in large intestines of healthy mice (). As reported, the activation of Wnt signaling is responsible for initiation and progression of human colorectal cancer, which involves the stimulation of mediators β-catenin and its downstream target cyclin D1.Citation27–29
Figure 4. Promotion of inflammation by the gut metabolites to induce colorectal carcinogenesis.
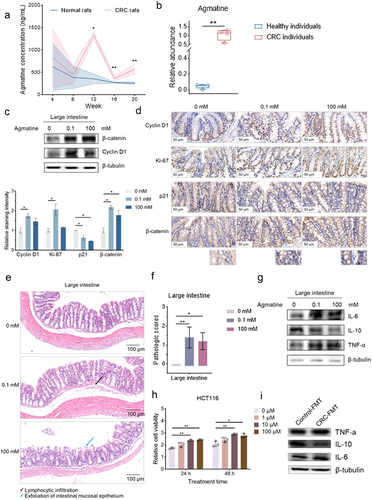
To further characterize the role of agmatine in inducing colorectal carcinogenesis, immunohistochemistry analysis and histological analysis were performed. The results of immunohistochemical analysis revealed that agmatine led to the higher ectopic expression level of β-catenin in the nucleus and cytoplasm and increased the proportion of cyclin D1-positive cells of the large intestinal epithelial cells of healthy mice (). Furthermore, the significant increase in Ki-67 positive signals was detected in the epithelial cells of large intestines of healthy mice treated with agmatine, showing that agmatine triggered the aberrant proliferation of epithelial cells of large intestines (). In addition to the hyperproliferation, the expression level of p21, which governs cell-cycle arrest and differentiation,Citation30 was significantly reduced in the epithelial cells of large intestines of agmatine-treated mice (). These data illustrated the agmatine enema promoted the excessive proliferation of epithelial cells of large intestines and the conversion of large intestinal epithelial cells to poorly-differentiated state, thus accelerating the colorectal carcinogenesis. The histological analysis of intestinal tissues demonstrated that the agmatine-treated mice harbored dysplasia of large intestines compared with the control mice (). The emerged inflammatory infiltration of lymphocytes was observed in intestines of agmatine-treated mice (), which has been known as one of risk factors for colorectal cancer.Citation31 At the same time, the pathologic scores demonstrated a remarkable dysplasia of agmatine-treated mice compared with the control (), indicating the inflammatory infiltration and epithelial damage of the large intestines of agmatine-treated mice. These results confirmed that agmatine could induce intestinal adenomas in mice and suggested that the intestinal adenomas triggered by agmatine might be associated to inflammation.
To reveal the involvement of agmatine in inflammation-driven colorectal carcinogenesis, the expression profiles of cytokines were examined in the large intestines of healthy mice administrated with or without agmatine. Western blots showed that the pro-inflammatory cytokines, including interleukin-6 (IL-6) and tumor necrosis factor-α (TNF-α), and the anti-inflammatory cytokine interleukin-10 (IL-10) were significantly upregulated and downregulated in large intestines of the mice treated with agmatine, respectively (). As reported, inflammatory cytokines IL-6 and TNF-α can facilitate the inflammation-driven colorectal carcinogenesis, while IL-10 suppresses colorectal carcinogenesis.Citation32 To further assess the pro-tumorigenic/pro-proliferative effects of agmatine, colorectal cancer cells (HCT116) were treated with agmatine, followed by the examination of cell proliferation. The results revealed that agmatine significantly enhanced the cell proliferation (), showing the pro-proliferative effects of agmatine. Therefore, these data demonstrated that agmatine could promote the intestinal inflammation of mice to trigger colorectal carcinogenesis.
Based on the MetOrigin (https://metorigin.met-bioinformatics.cn/home/), the gut bacteria belonging to Blautia, Odoribacter, Alistipes and Paraprevotella () could produce agmatine with the substrate arginine. The results of bacterial metabolite profiling demonstrated that 3 representative strains of mouse gut, including Blautia obeum, Odoribacter splanchnicus and paraprevotella clara generated agmatine (Fig. S3a-d).
To determine whether the gut microbiota and the resultant metabolites underpinned the pro-carcinogenetic effects of agmatine in colorectal cancer, the recipient wild-type mice were treated with the stool from ApcMin/+ mice (CRC-FMT) or C57BL/6J mice (Control-FMT) after microbiota depletion with antibiotic cocktail. The results showed that the pro-inflammatory cytokines (IL-6 and TNF-α) were upregulated and the anti-inflammatory cytokines (IL-10) was downregulated in CRC-FMT group compared with the Control-FMT group (). These data indicated that the gut bacterial-derived agmatine could the intestinal inflammation of mice to trigger tumorigenesis in colon.
Taken together, these data indicated that agmatine derived from the gut bacteria could activate the Wnt signaling pathway and induce upregulation of the pro-inflammatory cytokines (IL-6 and TNF-α) and downregulation of the anti-inflammatory cytokine (IL-10), which might lead to the aberrant proliferation of intestinal epithelial cells in mice and further caused the onset of murine intestinal adenomas.
Underlying mechanism of agmatine-driven intestinal inflammation and adenomas in mice
To reveal the mechanism of agmatine-triggered intestinal adenoma in mice, the proteins of mouse intestinal tissues interacted with agmatine were characterized. The results indicated that, two proteins were specifically bound to agmatine (). Based on the mass spectrometric data, these two proteins were respectively identified to be ring finger protein 128 (Rnf128) and heat shock protein 5 (Hspa5) (). Western blot analysis further confirmed the mass spectrometric data (). These results indicated that agmatine might interact with Rnf128 and Hspa5 proteins.
Figure 5. Underlying mechanism of agmatine-driven intestinal inflammation and adenomas in mice.
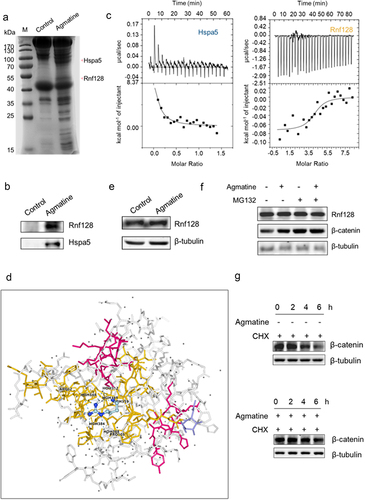
To further explore whether agmatine was directly interacted with Hspa5 or Rnf128 protein, isothermal titration calorimetry (ITC) analysis was performed. The results revealed that agmatine could bind to Rnf128 protein directly, but not Hspa5 (). These data indicated that agmatine was directly interacted with Rnf128. To ascertain the binding of agmatine with Rnf128, molecular docking was performed. The ligand docking results showed that the binding pocket involved the amino acid residues Arg52 and Pro105 and that the Rnf128 protein was interacted with agmatine by forming six hydrogen bonds (), confirming that agmatine was interacted with the Rnf128 protein. Therefore, the impacts of Rnf128 on agmatine-mediated pro-carcinogenesis were further explored.
To assess the role of Rnf128 in agmatine-mediated pro-carcinogenesis, the expression level of Rnf128 protein was examined in large intestines of wild-type mice administered with or without agmatine. Western blot data indicated that agmatine treatment did not change the protein level of Rnf128 (). As reported, Rnf128 acts as an E3 ubiquitin ligase involved in β-catenin ubiquitination.Citation33 Therefore, the impacts of agmatine on the stability of β-catenin protein were characterized. The results showed that the β-catenin protein level in large intestines of agmatine-treated wild-type mice was much higher than that of control and comparable to that of mice treated with MG132, a proteasome inhibitor (). Moreover, the MG132 treatment exerted no effects on Rnf128 protein level (). These data hinted that, agmatine could maintain the stability of β-catenin by suppressing Rnf128-mediated ubiquitination degradation of β-catenin. The cycloheximide (CHX) chase assay indicated that agmatine treatment significantly increased the half-life of β-catenin compared with the control (). These data demonstrated that agmatine could increase the stability of β-catenin protein.
Collectively, these findings highlighted that, agmatine could bind to E3 ubiquitin ligase Rnf128 to suppress the enzymatic activity of Rnf128 and further protect β-catenin from the ubiquitin-proteasome-mediated degradation, thus potentiating colorectal pro-carcinogenesis of mice via Wnt signaling.
Promotive effects of agmatine on carcinogen-induced intestinal tumorigenesis of mice
To further explore the pro-carcinogenic role of agmatine in mouse intestines, an azoxymethane (AOM)/dextran sodium sulfate (DSS)-induced colorectal cancer model was established using healthy mice (C57BL/6JNju mice) (). The results indicated that the body weight of the mice treated with AOM/DSS and agmatine was significantly decreased compared with that of the mice treated with AOM/DSS alone (), suggesting that agmatine might promote colorectal carcinogenesis of mice.
Figure 6. Promotive effects of agmatine on carcinogen-induced intestinal tumorigenesis of mice.
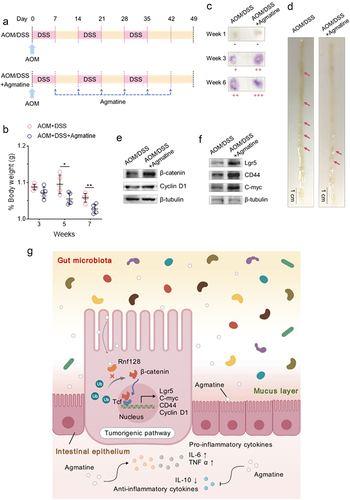
To further monitor the disease progression, the fecal samples of mice treated with AOM/DSS or AOM/DSS and agmatine were subjected to the fecal occult blood test (). As shown in , the positive signals of occult blood in the agmatine-treated mice were much stronger than those in the control mice (AOM/DSS alone) from Week 3 backwards. Compared to the control mice, the agmatine-treated mice exhibited more intestinal adenomas (). These results demonstrated that agmatine could promote colorectal carcinogenesis of mice.
To evaluate whether agmatine triggered colorectal carcinogenesis via the activation of Wnt signaling, the expressions of β-catenin and cyclin D1 in the intestinal adenomas of mice were characterized. Western blots showed that the treatment of agmatine significantly upregulated β-catenin and cyclin D1 (). It is well known that the activation of Wnt signaling pathway is marked by the elevated β‐catenin and cyclin D1 levels in CRC (Yu et al., 2019). Therefore, these data revealed the contribution of agmatine to promote the progression of mouse intestinal adenomas via the Wnt signaling pathway. At the same time, the expression levels of Lgr5, CD44 and C-myc, the markers of stem cells, were upregulated in the intestinal adenomas of the mice treated with AOM/DSS and agmatine (), indicating that agmatine enhanced the stemness of the mouse intestinal adenomas.
Taken together, the findings demonstrated that the gut microbial-derived metabolite agmatine could interact with Rnf128 to suppress the Rnf128-mediated ubiquitination of β-catenin and further upregulate the downstream targets of β-catenin including Cyclin D1, Lgr5, CD44 and C-myc, thereby activating the Wnt signaling pathway (). The activated Wnt signaling pathway promoted the hyperproliferation and undifferentiation of intestinal cells, thus contributing to colorectal carcinogenesis ().
Discussion
The gut microbiota, which consists of trillions of microorganisms including bacteria, viruses, archaea, fungi and protists, may interact with the host cells to modulate the immunity and metabolome in gut, therefore having emerged as a critical cause inducing gastrointestinal diseases.Citation34 Notably, the contribution of gut microbiota to the development of colorectal cancer has been confirmed by multiple in vitro and in vivo studies.Citation35 An interesting finding of previous investigations is that the fecal microbiota from the patients with colorectal cancer can promote colorectal tumorigenesis in the germ-free and AOM-induced mouse models.Citation36 In recent years, the comparative metagenomic or metataxonomic approach has been applied to assess the specific roles of gut microbiota in human colorectal cancers, whereby different gut microbiome signatures between individuals with or without colorectal cancer have been identified.Citation37,Citation38 This difference mainly reflects in the increased abundance of procarcinogenic bacterial taxa (i.e. Bacteroides, Escherichia, Fusobacterium and Porphyromonas) along with the decreased abundance of potentially protective bacterial taxa (i.e. Roseburia) in the colorectal cancer patients versus the healthy individuals.Citation35 In this study, our findings revealed that the gut bacteria might be the key drivers of colorectal cancer. The bacteria belonging to 4 genera (Blautia, Odoribacter, Alistipes and Paraprevotella) might serve as prospective biomarkers for early diagnosis of colorectal cancer. In the future, the large-scale population cohort data of gut microbiota of the colorectal cancer patients would be characterized to obtain the biomarkers of human colorectal cancer. The robust evidence from large cohorts is essential for practice guidelines.
Currently, the compelling evidence highlights the crucial roles of gut microbiota in colorectal cancers via different mechanisms, such as the modulation of immune responses, the production of genotoxins and the metabolisms of dietary components.Citation35,Citation39 However, the underlying mechanism of gut microbiota in the colorectal carcinogenesis has not been extensively explored. In this study, our findings revealed that agmatine, a polyamine mainly generated by resident intestinal microflora (i.e. Enterococcus faecalis and Escherichia coli),Citation40 contributed to the inflammation-mediated colorectal tumorigenesis via activating the Wnt signaling pathway. The results showed that the microbial metabolite agmatine could interact with Rnf128, an E3 ubiquitin ligase for the ubiquitination of β-catenin,Citation33 to suppress the degradation of β-catenin, leading to the upregulation of proinflammatory gene signatures (IL-6 and TNF-α) and the downregulation of anti-inflammatory cytokines (IL-10) to modify the host intestinal immunity and further prompting the intestinal cells to enter the hyperproliferative state. The agmatine-treated mice harbored colonic dysplasia, accompanied by the emergence of inflammatory infiltration of lymphocytes and epithelial damage. As reported, the cytokines IL-6 and TNF-α fuel inflammation-dysplasia-carcinoma events.Citation32,Citation41,Citation42 In this context, our study uncovered that the gut microbial-derived metabolites, such as agmatine, bridged the gaps between inflammation, intestinal immunity and colorectal carcinogenesis, providing a new mechanistic insight into the gut microbiota in colorectal tumorigenesis. This intricate host-microbe-metabolite “cross-talk” might be further explored by employing multi-omics approaches. A lot of preclinical and initial clinical evidences have presented the therapeutic potential of agmatine in a wide range of diseases covering diabetes mellitus, neurodegenerative diseases and mood disorders.Citation43 Although several experimental approaches (i.e. agmatinase inhibitors) have been developed to manipulate the agmatine metabolism in the context of neurological diseases, there is no investigation concerning agmatine as molecular target for anticancer treatments and diagnosis of colorectal cancer.Citation44 Therefore, agmatine or modulating gut microbiota might be considered as prospective therapeutic options against colorectal cancer, which merited to be further explored in the future.
Author contributions
Xiaobo Zhang performed conceptualization, funding acquisition, project administration, supervision, writing and editing. Yu Lu carried out data curation, validation, formal analysis, methodology, validation, resources, software and writing. Aoxi Cui participated data curation, methodology, validation and resources.
Ethics statement
All animal studies were approved by the Institutional Animal Care and Use Committees of Zhejiang University (Approval No.14843) and were carried out according to the protocols approved by Institutional Animal Care and Use Committee (IACUC).
Supplemental Material
Download Zip (466.6 KB)Acknowledgments
This work was financially supported by National Key Research and Development Program of China (2023YFC2811503) and Southern Marine Science and Engineering Guangdong Laboratory (Zhuhai) (SML2023SP236).
Disclosure statement
No potential conflict of interest was reported by the author(s).
Supplementary material
Supplemental data for this article can be accessed online at https://doi.org/10.1080/19490976.2024.2348441
Additional information
Funding
References
- Song M, Garrett WS, Chan AT. Nutrients, foods, and colorectal cancer prevention. Gastroenterology. 2015;148(6):1244–60.e16. doi:10.1053/j.gastro.2014.12.035.
- Chow CJ, Al-Refaie WB, Abraham A, Markin A, Zhong W, Rothenberger DA, Kwaan MR, Habermann EB. Does patient rurality predict quality colon cancer care?: a population-based study. Dis Colon Rectum. 2015;58(4):415–20. doi:10.1097/DCR.0000000000000173.
- Allen J, Sears CL. Impact of the gut microbiome on the genome and epigenome of colon epithelial cells: contributions to colorectal cancer development. Genome Med. 2019;11(1):11. doi:10.1186/s13073-019-0621-2.
- Gagnaire A, Nadel B, Raoult D, Neefjes J, Gorvel JP. Collateral damage: insights into bacterial mechanisms that predispose host cells to cancer. Nat Rev Microbiol. 2017;15(2):109–128. doi:10.1038/nrmicro.2016.171.
- Pleguezuelos-Manzano C, Puschhof J, Rosendahl Huber A, van Hoeck A, Wood HM, Nomburg J, Gurjao C, Manders F, Dalmasso G, Stege, PB. et al. Mutational signature in colorectal cancer caused by genotoxic pks+. E coli Nat. 2020;580:269–273.
- Sears CL, Pardoll DM. Perspective: alpha-bugs, their microbial partners, and the link to colon cancer. J Infect Dis. 2011;203(3):306–311. doi:10.1093/jinfdis/jiq061.
- Tjalsma H, Boleij A, Marchesi JR, Dutilh BE. A bacterial driver–passenger model for colorectal cancer: beyond the usual suspects. Nat Rev Microbiol. 2012;10(8):575–582. doi:10.1038/nrmicro2819.
- Icaza-Chávez ME. Gut microbiota in health and disease. Rev Gastroenterol Mex. 2013;78(4):240–248. doi:10.1016/j.rgmxen.2014.02.009.
- Flemer B, Lynch DB, Brown JM, Jeffery IB, Ryan FJ, Claesson MJ, O’Riordain M, Shanahan F, O’Toole PW. Tumour-associated and non-tumour-associated microbiota in colorectal cancer. Gut. 2017;66(4):633–643. doi:10.1136/gutjnl-2015-309595.
- Yamamoto M, Matsumoto S. Gut microbiota and colorectal cancer. Genes and Environ. 2016;38(1):11. doi:10.1186/s41021-016-0038-8.
- Sun J, Kato I. Gut microbiota, inflammation and colorectal cancer. Genes Dis. 2016;3(2):130–143. doi:10.1016/j.gendis.2016.03.004.
- Yachida S, Mizutani S, Shiroma H, Shiba S, Nakajima T, Sakamoto T, Watanabe H, Masuda K, Nishimoto Y, Kubo M. et al. Metagenomic and metabolomic analyses reveal distinct stage-specific phenotypes of the gut microbiota in colorectal cancer. Nat Med. 2019;25(6):968–976. doi:10.1038/s41591-019-0458-7.
- Louis P, Hold GL, Flint HJ. The gut microbiota, bacterial metabolites and colorectal cancer. Nat Rev Microbiol. 2014;12(10):661–672. doi:10.1038/nrmicro3344.
- Krautkramer KA, Fan J, Bäckhed F. Gut microbial metabolites as multi-kingdom intermediates. Nat Rev Microbiol. 2021;19(2):77–94. doi:10.1038/s41579-020-0438-4.
- Encarnação JC, Abrantes AM, Pires AS, Botelho MF. Revisit dietary fiber on colorectal cancer: butyrate and its role on prevention and treatment. Cancer Metastasis Rev. 2015;34(3):465–478. doi:10.1007/s10555-015-9578-9.
- He Y, Fu L, Li Y, Wang W, Gong M, Zhang J, Dong X, Huang J, Wang Q, Mackay CR. et al. Gut microbial metabolites facilitate anticancer therapy efficacy by modulating cytotoxic CD8+ T cell immunity. Cell Metab. 2021;33(5):988–1000.e7. doi:10.1016/j.cmet.2021.03.002.
- Fang Y, Yan C, Zhao Q, Xu J, Liu Z, Gao J, Zhu H, Dai Z, Wang D, Tang D. et al. The roles of microbial products in the development of colorectal cancer: a review. Bioengineered. 2021;12(1):720–735. doi:10.1080/21655979.2021.1889109.
- Bernstein H, Bernstein C, Payne CM, Dvorak K. Bile acids as endogenous etiologic agents in gastrointestinal cancer. World J Gastroenterol. 2009;15(27):3329–3340. doi:10.3748/wjg.15.3329.
- Fan X, Jin Y, Chen G, Ma X, Zhang L. Gut microbiota dysbiosis drives the development of colorectal cancer. Digestion. 2021;102(4):508–515. doi:10.1159/000508328.
- Xu R, Wang Q, Li L. A genome-wide systems analysis reveals strong link between colorectal cancer and trimethylamine N-oxide (TMAO), a gut microbial metabolite of dietary meat and fat. BMC Genomics. 2015;16(Suppl 7):S4. doi:10.1186/1471-2164-16-S7-S4.
- Casero RA Jr, Murray Stewart T, Pegg AE. Polyamine metabolism and cancer: treatments, challenges and opportunities. Nat Rev Cancer. 2018;18(11):681–695. doi:10.1038/s41568-018-0050-3.
- Johnson CH, Dejea CM, Edler D, Hoang LT, Santidrian AF, Felding BH, Ivanisevic J, Cho K, Wick E, Hechenbleikner E. et al. Metabolism links bacterial biofilms and colon carcinogenesis. Cell Metab. 2015;21(6):891–897. doi:10.1016/j.cmet.2015.04.011.
- Lee YS, Kim TY, Kim Y, Lee SH, Kim S, Kang SW, Yang J-Y, Baek I-J, Sung YH, Park Y-Y. et al. Microbiota-derived lactate accelerates intestinal stem-cell-mediated epithelial development. Cell Host Microbe. 2018;24(6):833–846.e6. doi:10.1016/j.chom.2018.11.002.
- Li R, Li Y, Kristiansen K, Wang J. SOAP: short oligonucleotide alignment program. Bioinformatics. 2008;24(5):713–714. doi:10.1093/bioinformatics/btn025.
- Kurtz S, Phillippy A, Delcher AL, Smoot M, Shumway M, Antonescu C, Salzberg SL. Versatile and open software for comparing large genomes. Genome Biol. 2004;5(2):R12. doi:10.1186/gb-2004-5-2-r12.
- Zhang S, Xin F, Zhang X. The compound packaged in virions is the key to trigger host glycolysis machinery for virus life cycle in the cytoplasm. iScience. 2020;24(1):101915. doi:10.1016/j.isci.2020.101915.
- Peng K, Kou L, Yu L, Bai C, Li M, Mo P, Li W, Yu C. Histone demethylase JMJD2D interacts with β-catenin to induce transcription and activate colorectal cancer cell proliferation and tumor growth in mice. Gastroenterology. 2019;156(4):1112–1126. doi:10.1053/j.gastro.2018.11.036.
- Qin S, Jiang J, Lu Y, Nice EC, Huang C, Zhang J, He W. Emerging role of tumor cell plasticity in modifying therapeutic response. Signal Transduct Target Ther. 2020;5(1):228. doi:10.1038/s41392-020-00313-5.
- Grinat J, Heuberger J, Vidal RO, Goveas N, Kosel F, Berenguer-Llergo A, Kranz A, Wulf-Goldenberg A, Behrens D, Melcher B. et al. The epigenetic regulator Mll1 is required for Wnt-driven intestinal tumorigenesis and cancer stemness. Nat Commun. 2020;11(1):6422. doi:10.1038/s41467-020-20222-z.
- Belcheva A, Irrazabal T, Robertson SJ, Streutker C, Maughan H, Rubino S, Moriyama E, Copeland J, Surendra A, Kumar S. et al. Gut microbial metabolism drives transformation of MSH2-deficient colon epithelial cells. Cell. 2014;158(2):288–299. doi:10.1016/j.cell.2014.04.051.
- Arthur JC, Perez-Chanona E, Mühlbauer M, Tomkovich S, Uronis JM, Fan TJ, Campbell BJ, Abujamel T, Dogan B, Rogers AB. et al. Intestinal inflammation targets cancer-inducing activity of the microbiota. Science. 2012;338(6103):120–123. doi:10.1126/science.1224820.
- Saleh M, Trinchieri G. Innate immune mechanisms of colitis and colitis-associated colorectal cancer. Nat Rev Immunol. 2011;11(1):9–20. doi:10.1038/nri2891.
- Zhu Y, Gan Y, Zou R, Sha H, Lu Y, Zhang Y, Feng J. RNF128 suppresses the malignancy of colorectal cancer cells via inhibition of Wnt/β-catenin signaling. Am J Transl Res. 2021;13:13567–13578.
- Cheng WY, Wu CY, Yu J. The role of gut microbiota in cancer treatment: friend or foe? Gut. 2020;69(10):1867–1876. doi:10.1136/gutjnl-2020-321153.
- Wong SH, Yu J. Gut microbiota in colorectal cancer: mechanisms of action and clinical applications. Nat Rev Gastroenterol Hepatol. 2019;16(11):690–704. doi:10.1038/s41575-019-0209-8.
- Wong SH, Zhao L, Zhang X, Nakatsu G, Han J, Xu W, Xiao X, Kwong TNY, Tsoi H, Wu WKK. et al. Gavage of fecal samples from patients with colorectal cancer promotes intestinal carcinogenesis in germ-free and conventional mice. Gastroenterology. 2017;153(6):1621–1633.e6. doi:10.1053/j.gastro.2017.08.022.
- Yu J, Feng Q, Wong SH, Zhang D, Liang QY, Qin Y, Tang L, Zhao H, Stenvang J, Li Y. et al. Metagenomic analysis of faecal microbiome as a tool towards targeted non-invasive biomarkers for colorectal cancer. Gut. 2017;66(1):70–78. doi:10.1136/gutjnl-2015-309800.
- Nakatsu G, Zhou H, Wu WKK, Wong SH, Coker OO, Dai Z, Li X, Szeto C-H, Sugimura N, Lam TYT. et al. Alterations in enteric virome are associated with colorectal cancer and survival outcomes. Gastroenterology. 2018;155(2):529–541.e5. doi:10.1053/j.gastro.2018.04.018.
- Meng C, Bai C, Brown TD, Hood LE, Tian Q. Human gut microbiota and gastrointestinal cancer. Genomics, Proteomics & Bioinformatics. 2018;16(1):33–49. doi:10.1016/j.gpb.2017.06.002.
- Haenisch B, von Kügelgen I, Bönisch H, Göthert M, Sauerbruch T, Schepke M, Marklein G, Höfling K, Schröder D, Molderings GJ. et al. Regulatory mechanisms underlying agmatine homeostasis in humans. Am J Physiol Gastrointest Liver Physiol. 2008;295(5):G1104–10. doi:10.1152/ajpgi.90374.2008.
- Shah SC, Itzkowitz SH. Colorectal cancer in inflammatory bowel disease: mechanisms and management. Gastroenterology. 2022;162(3):715–730.e3. doi:10.1053/j.gastro.2021.10.035.
- Chatila WK, Walch H, Hechtman JF, Moyer SM, Sgambati V, Faleck DM, Srivastava A, Tang L, Benhamida J, Ismailgeci D. et al. Integrated clinical and genomic analysis identifies driver events and molecular evolution of colitis-associated cancers. Nat Commun. 2023;14(1):110. doi:10.1038/s41467-022-35592-9.
- Piletz JE, Aricioglu F, Cheng JT, Fairbanks CA, Gilad VH, Haenisch B, Halaris A, Hong S, Lee JE, Li J. et al. Agmatine: clinical applications after 100 years in translation. Drug Discov Today. 2013;18(17–18):880–893. doi:10.1016/j.drudis.2013.05.017.
- Piletz JE, Klenotich S, Lee KS, Zhu QL, Valente E, Collins MA, Jones V, Lee SN, Yangzheng F. Putative agmatinase inhibitor for hypoxic-ischemic new born brain damage. Neurotox Res. 2013;24(2):176–190. doi:10.1007/s12640-013-9376-5.