
ABSTRACT
Background
Tongue coating microbiota has aroused particular interest in profiling oral and digestive system cancers. However, little is known on the relationship between tongue coating microbiome and colorectal cancer (CRC).
Methods
Metagenomic shotgun sequencing was performed on tongue coating samples collected from 30 patients with CRC, 30 patients with colorectal polyps (CP), and 30 healthy controls (HC). We further validated the potential of the tongue coating microbiota to predict the CRC by a random forest model.
Results
We found a greater species diversity in CRC samples, and the nucleoside and nucleotide biosynthesis pathway was more apparent in the CRC group. Importantly, various species across participants jointly shaped three distinguishable fur types.The tongue coating microbiome profiling data gave an area under the receiver operating characteristic curve (AUC) of 0.915 in discriminating CRC patients from control participants; species such as Atopobium rimae, Streptococcus sanguinis, and Prevotella oris aided differentiation of CRC patients from healthy participants.
Conclusion
These results elucidate the use of tongue coating microbiome in CRC patients firstly, and the fur-types observed contribute to a better understanding of the microbial community in human. Furthermore, the tongue coating microbiota-based biomarkers provide a valuable reference for CRC prediction and diagnosis.
Introduction
Colorectal cancer (CRC) is a multistep process that involves genomic alterations in parallel with morphologic changes [Citation1]. CRC ranks third in terms of cancer incidence worldwide, and the latest data for China released by the National Cancer Center indicated about 153,020 new cases and 52,550 deaths because of CRC, with an increasing trend in the incidence and mortality [Citation2–5]. Screening and diagnosing CRC at an early stage is therefore a key factor for reducing CRC mortality rate, and current screening strategies including fecal immunochemical test (FIT), serum carcinoembryonic antigen (CEA) test, or colonoscopy technology and tissue biopsies are invasive or unaffordable [Citation6–8]. In the past few years, researchers have proposed that CRC is always caused by inflammatory bowel disease (IBD), obesity, diabetes, and a high-fat diet, all of which suggest that dysbiosis plays a key role in CRC pathogenesis [Citation9]. Some clinical and epidemiological studies have proven that imbalance of the gut microbial community promotes CRC [Citation10]. Particularly, decreased microbial diversity and increased richness of Proteobacteria and Fusobacterium nucleatum (Fn) have been found in the gut microbiome of CRC patients [Citation11–13]. Further, Fn may promote the development of CRC with consistent and chronic inflammation [Citation14]. Besides, studies have reported similar metabolic regulatory mechanisms between the oral cavity and gut microbiota [Citation15]; however, the overlaps between both these regions indicate a specific association with the development of CRC that can potentially predict the risk of CRC. The oral cavity is closely associated with the external environment and has the most diversified microbiome [Citation16]. Of the microbiome, the phyla Actinobacteria, Bacteroidetes, Firmicutes, and Proteobacteria represent microbes in the oral cavity, which form biofilms such as the coat of tongue and dental plaque [Citation17,Citation18]. The tongue is a mobile, muscular organ located in the mouth, which is associated with oral and systemic infections and aspiration pneumonia [Citation19]. The tongue coating is an important part of the tongue and has a specific ecosystem with its own microbiome. Moreover, tongue coating has an essential impact on the total oral microbiome, and common harmful tongue coating bacteria can damage immunity and cause chronic inflammation [Citation20–22]. Nevertheless, in contrast to the rapidly increasing knowledge on gut microbiota, discussion on whether the tongue coating microbiota-based biomarkers can be used for CRC screening and diagnosing is scarce.
Therefore, the aim of this study was to investigate the characteristics of tongue coating microbiome to identify potential non-invasive biomarkers of CRC using metagenomics sequencing (MGS), which has high sequencing detection sensitivity and high-throughput function. Furthermore, the study aimed to determine the complex interaction between tongue coating microbiome and CRC, as the data on ecological mechanism of the tongue coating microbiome for CRC are scarce and the human microbiota community is known to play an active role in carcinogenesis through DNA damage and chronic infection.
Materials and methods
Study design and enrolled subjects
A total of 60 specimens from 30 patients with CRC and 30 patients with CP were collected, and 30 healthy controls were used for comparison. CRC and CP were diagnosed by colonoscopy and histopathologic examination at the hospital, from May 2021 to May 2022. A newly established standard tongue coating collection method was used for sample collection [Citation23]. All participants provided written informed consent, and the study protocol was approved by the Ethics Committee of the hospital.
Subjects diagnosed with CRC or CP were recruited according to strict inclusion criteria: inpatients with newly diagnosed CRC or CP (aged 18–85 years) and had never been treated with aprobiotics or antibiotics in the 4 weeks prior to taking tongue coating samples. Exclusion criteria for the CRC and CP groups included the following: (a) probiotics or antibiotics use within a month prior to taking tongue coating samples; (b) pregnant or lactating women; (c) previous history of CRC or other tumor diseases; (d) uncontrolled active infection, serious electrolyte disorder, obvious bleeding tendency, and severe heart, lung, liver and renal insufficiency; (e) unable to complete the baseline assessment table and those who have no legal capacity. In addition, we enrolled 30 matched healthy controls following the inclusion criteria: (a) individuals who had not been administered probiotics or antibiotics within a month prior to taking tongue coating samples; (b) aged 20–60 years; (c) absence of nausea, vomiting, diarrhea, and other gastrointestinal discomfort within the previous months.
Sample collection
All participants were asked to rinse their mouth three times with normal saline and extend their tongue as far as possible before sampling. The tongue surface was scraped from the posterior middle area to the anterior middle area where commonly the thick and greasy tongue coating exists. This was done 30 times by rolling a sterile oral swab. The swab head was then immersed in a product preservation solution (KD-FM-001, KMHD GeneTech Co., Ltd.), and finally frozen at −80°C.
Metagenomic shotgun sequencing and analysis
Microbial DNA on the tongue coating was extracted using a EasyPure Bacteria Genomic DNA Kit (TransGen, EE161) following the manufacturer’s instructions. The degree of DNA degradation and possible contamination was estimated using 1% agarose gel electrophoresis, the optical density (OD) value of DNA with 260/280 absorbance ratio values of 1.8–2.0 was detected using a microplate reader (Biotek, Cytation5), and the DNAs were quantified using a Qubit 4.0 Fluorometer (Thermo Fisher, Q33226). Metagenomic shotgun sequencing was performed on the MGI DNBSEQ-T7 platform with a paired end library of 350-bp and 150-bp read length, with an average of 7.72 Gb and 51.46 M reads per sample.
Species accumulation curves show the cumulative number of species recorded for a certain number of individuals to provide an estimate of species richness. The mean cumulative number of species was calculated for a specified number of random individuals from the population for 5 times. The sequencing readings were subjected to quality control using Kneaddata (https://github.com/biobakery/biobakery/wiki/kneaddata) [Citation24] and host sequences were removed based on the human genome (hg19 build) database. High-quality sequences were used for quantitative profiling of the taxonomic composition of the microbial communities of all samples using MetaPhlAn 3.0 (https://github.com/biobakery/MetaPhlAn/wiki/MetaPhlAn-3.0) [Citation25], whereas HUMAnN 3.0 (https://huttenhower.sph.harvard.edu/humann) was used to profile gene-family abundances [Citation26]. Gene families determined by UniRef were mapped to the MetaCyc metabolic pathway database. The alpha diversity index (Shannon index) and Bray-Curtis dissimilarities were calculated using Vegan package in R. And beta diversity was subdivided into turnover and nestedness using adespatial package. Statistical analysis was performed on the Shannon index between groups using a non-parametric Wilcoxon test with a p-value <0.05. Principal coordinate analysis (PCoA) was performed on beta diversity based on Bray-Curtis distances, and the differences were compared using permutational multivariate ANOVA (PERMANOVA) with 9,999 permutations. LEfSe was used to quantitate differential taxonomic abundance and pathway abundance using a Kruskal–Wallis test with a value of 0.05 and a log linear discriminant analysis (LDA) score cut-off of 2 [Citation27]. The above analyses were performed using the HMGA tools (http://www.gigaomics.com/), a free online platform for data analysis [Citation28].
A distance matrix was computed using the Jensen- Shannon divergence (JSD) distance. The optimal number of clusters was determined using the silhouette width method, and the Partitioning Around Medoids (PAM) algorithm. Medoids (PAM) algorithm was employed to categorize the samples into clusters as fur-types. Between-class analysis (BCA) was performed on fur-types and top 10 contributors were shown. Heat tree and co-occurrence network were analyzed on Microbiome Analyst [Citation29]. The association between species, clinical characteristics, and other confounders was calculated by Microbiome Multivariable Associations with Linear Models (MaAsLin2), a multivariable statistical framework with default parameters.
Species-based classifier
To acquire the best discriminant performance across CRC and non-CRC individuals, fivefold cross-validation was performed on a random forest model using the ‘randomForest’ package v.4.7–1 based on the relative abundances of species level. The cross-validation error curves from five trials of five-fold cross-validation were averaged and were used to select appropriate features. Seventy percent of all individuals were randomly selected as the training set and 30% as the validation set for the model.
Statistical methods
R (version 4.2) was used for statistical analysis. Categorical data were tested using the chi-square test and continuous variables using t-tests to examine the difference in phenotype index between the groups. p values < 0.05 were considered statistically significant.
Results
Study population and demographics
Tongue coating microbiome samples from HC (n = 30), CP patients (n = 30), and CRC patients (n = 30) were prospectively obtained from workplace-based colonoscopy tests in the Second Affiliated Hospital of Guangzhou University of Chinese Medicine. Significant difference was found in terms of age, but no significant differences in other demographically assessed variables such as BMI, gender, smoking status, and alcohol drinking status among the groups (, Supplementary Table S1).
Table 1. Differences in demographic and clinical characteristics between CRC, CP, and NC groups.
Composition of the tongue coating microbiota
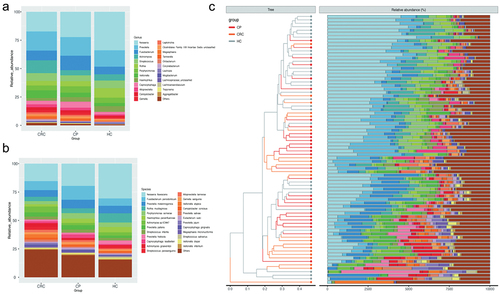
Community profiling analysis showed significant differences in phylum to species levels between the HC group compared to the CP and CRC groups ( and Supplementary Figure S1). At the phylum level, Proteobacteria, Bacteroidota, Firmicutes, Actinobacteriota, and Fusobacteriota were most abundant, and among these, Proteobacteria, Firmicutes, and Bacteroidota were the most abundant phyla across groups. Proteobacteria was the dominant bacteria with a relative abundance of 41.73% in the HC group, significantly higher than that in the CP (29.22%) and CRC (23.35%) groups (all p < 0.05). Actinobacteria had increased abundance in the CRC group (all p < 0.05). At the class level, CRC patients showed increased levels of Actinobacteria, Negativicutes, and Epsilonproteobacteria but a decrease in levels of Betaproteobacteria and Gammaproteobacteria, compared to the HC group. At the order level, Actinomycetales, Veillonellales, Eggerthellales, Selenomonadales, and Campylobacterales were more abundant in the CRC group, while Neisseriales, Micrococcales, Pasteurellales, Cardiobacteriales, and Burkholderiales were more frequent in the HC group. In addition to Neisseriaceae, Prevotellaceae, Fusobacteriaceae, and Actinomycetaceae, which are dominant bacteria at the family level, Actinomycetaceae, Veillonellaceae, Eggerthellaceae, Campylobacteraceae, Selenomonadaceae, and Leptotrichiaceae showed significantly higher relative abundance in patients with CRC, while Neisseriaceae, Micrococcaceae, Pasteurellaceae, Cardiobacteriaceae, and Burkholderiaceae were more frequent in the HC group (Supplementary Figure S1). At the genus level, CRC patients had increased abundance in seven species (Actinomyces, Slackia, Alloprevotella, Campylobacter, Peptostreptococcus, Megasphaera, Leptotrichia), while the HC group showed an increase in Neisseria, Rothia, Haemophilus, Lautropia, and Cardiobacterium (). At the species level, Veillonella atypica, Megasphaera micronuciformis, and Veillonella parvula were more abundant in the CRC group, while Neisseria flavescens and Rothia mucilaginosa were more frequent in the HC group ().
Figure 1. Comparison of relative abundance among each group. (a) Relative abundance of tongue coating microbiota at the genus level. (b) Relative abundance of tongue coating microbiota at the species level. (c) Heat map plot of relative abundance of the top 25 species in each sample (The legend of panel c in this figure is as same as the legend of panel b).
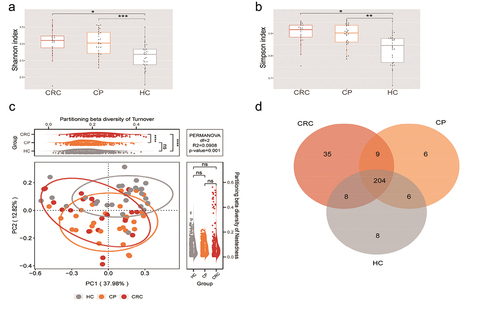
Species accumulation curves at the species level showed that the dataset in this study was sufficiently large and valid (Supplementary Figure S2). The sequencing depth was judged to be sufficient as the curve tended to be flat. The detection rate of the microbial community was almost flat, indicating a reasonable sequencing volume that could cover most species. To examine differences in the microbial community richness and composition between the three groups, we evaluated the α and β diversity of tongue coating microbiota. In terms of Shannon index and Simpson index, samples from the CP and CRC groups did not significantly differ in their α-diversity, but were significantly different compared to the HC group (). Based on the β-diversity analysis, the PCoA plot showed significant differences in species composition among the three groups (all p < 0.05; ). Diversity among communities (β-diversity) is driven by turnover (replacement of taxa) and nestedness (gain or loss of taxa resulting in differences in richness). Compared with HC and CP groups, the CRC group showed significant turnover (p < 0.0001, ), indicating that the CRC group harbors unique taxa. Moreover, noteworthy overlaps in differentially abundant OTUs were found among the CRC, CP and HC groups (). As shown in the Venn diagram, there are 204 common species among the three groups, 35 were specific for the CRC group and six were unique to the CP group. Overall, these findings indicate that the composition of microbial communities differed significantly among the different groups.
Figure 2. Microbial diversity analysis among three groups. (a,b) α-diversity indexes in the CRC, CP, and HC groups (observed, diversity Shannon and Simpson indexes depict diversity). (c) PCoA for β-diversity analysis. Red, orange, and grey represent different samples from the three groups. The structure and composition of the tongue coating microbiota were significantly different among the three groups. (d) Numbers of enriched OTUs between each compartment. Statistical significance by *p < 0.05, **p < 0.01, ***p < 0.001, ****p < 0.0001; ns, non-significant. HC: healthy controls, CP: patients with colorectal polyps (CP), CRC: patients with colorectal cancer.
Differential abundance of tongue coating microbiome across the three groups
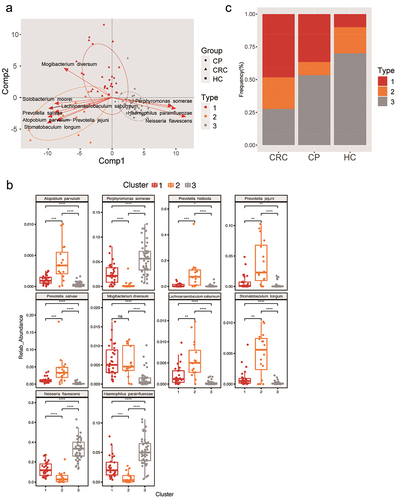
To better distinguish the types of disease-causing microbiota and health status, we identified three distinct clusters () designated as fur-types. Fur-type analysis was based on the classification of species to better reflect morphological changes [Citation30]. Each of these three fur-types cannot be identified by one dominant species. Between-class analysis (BCA) was performed on fur-types. The contribution of the bacteria for fur-type classification were calculated by the column normed scores in BCA and top 10 contributors were shown, namely Atopobium parvulum, Porphyromonas somerae, Prevotella jejuni, Prevotella salivae, Lachnoanaerobaculum saburreu, Stomatobaculum longum, Solobacterium moorei, Mogibacterium diversum, Neisseria flavescens, and Haemophilus parainfluenzae were found differed among the fur-types. Especially, the abundances of Atopobium parvulum, Prevotella jejuni, Prevotella salivae, Lachnoanaerobaculum saburreu, Stomatobaculum longum, and Megasphaera micronuciformis were significantly enriched in fur-type 2; Mogibacterium diversum has higher abundance in fur-type 1, and Porphyromonas somerae, Neisseria flavescens, and Haemophilus parainfluenzae were over-expressed in fur-type 3 (). Analysis on the differences shows the frequency of fur-type 1 and type 3 were higher in the CRC and HC groups, respectively, while fur-type 2 was not diverse among the three groups ().
Figure 3. Phylogenetic differences among three fur-types. (a) A BCA plot for showing the different species of three fur-types. (b) The top 10 contributors of three fur-types showing a different trend among groups. (c) Frequency of tongue coating types in the three groups. Statistical significance by *p < 0.05, **p < 0.01, ***p < 0.001, ****p < 0.0001; ns, non-significant. BCA: between class analysis, which visualizes results from principal component analysis and clustering; HC: healthy controls, CP: patients with colorectal polyps (CP), CRC: patients with colorectal cancer.
To further explore differences in microflora among groups, the LEfSe algorithm was used to detect abundance from the phylum to species levels. As shown in , 50 discriminatory species were found in the CRC, CP and HC groups, and one phylum, three classes, five orders, six families, 10 genera, and 26 species were enriched in patients with CRC (LDA score > 2.0; ). At the species level, Selenomonas sp. oral taxon 126, Prevotella multisaccharivorax, Prevotella fusca, and Actinomyces sp. oral taxon 180 were characteristic of the CRC group, whereas Neisseria sp. HMSC064E01 was excluded from the CRC group (). A cladogram was then generated to visualize and compare the phylogenetic distribution between three groups from the phylum to genus level. The results supported that the HC group was significantly different from the CP and CRC groups at each taxonomic level analyzed, while the CP and HC groups showed significant difference only at the level of phylum and genus (p < 0.05; Supplementary Figure S3).
Figure 4. Differences in tongue coating microbiota from phylum to species in the CRC, CP, and HC groups. (a) Microbiome biomarkers were identified using a logarithmic linear discriminant analysis (LDA) effect size (LefSe) threshold > 2.0. (b) HeatTree for clustering analysis. Red indicates a significant increase of abundance, while blue depicts the opposite. (c) Co-occurrence network analysis of tongue coating microbiota using Pearson’s correlation coefficient. A node represents a species. The node size indicates the level of abundance. Color scale indicates the proportion of bacterium in the three groups separately. Red depicts CRC patients, green depicts CP while purple depicts HC. Connecting lines indicate the strength of the relationship. HC: healthy controls, CP: patients with colorectal polyps (CP), CRC: patients with colorectal cancer.
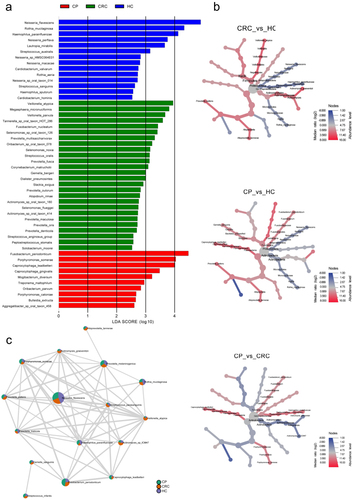
The clustering analysis of microbiota enrichment verified the diversity of Actinobacteria and exhibited clusters for Proteobacteria and Micrococcales in the HC, which also indicated that CRC patients had an increased abundance of Prevotellaceae, Frimicutes, and Actinomycetales, compared to the HC (). Moreover, the network map depicting enrichment relationships among groups at the species level illustrated that several bacteria were closely associated with Prevotella pallens, including Actinomyces graevenitzii, Actinomyces sp ICM47, and Streptococcus parasanguinis, which showed an increase in abundance in the CRC groups and a decrease in abundance the HC or CP group ().
Correlations between tongue coating microbiome and CRC clinical characteristics
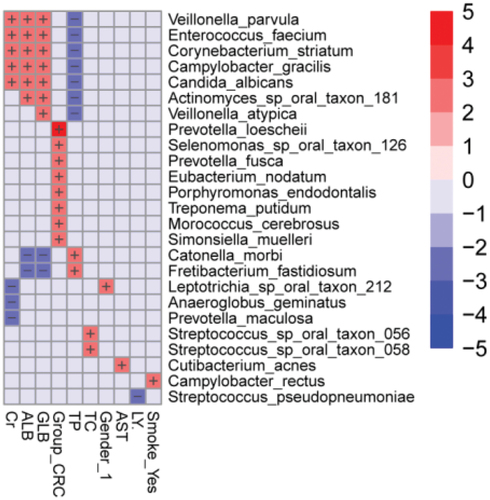
As shown in the multivariable statistical framework (), the CRC group significantly correlated with Prevotella loescheii, Selenomonas sp. oral taxon 126, Prevotella fusca, Eubacterium nodatum, Porphyromonas endodontalis, Treponema putidum, Morococcus cerebrosus, and Simonsiella muelleri. Clinical indicators of creatinine (Cr), globulin (GLB), and albumin (ALB) positively correlated with the species Veillonella parvula, Enterococcus faecium, Corynebacterium striatum, Campylobacter gracilis, Candida albicans, Actinomyces sp. oral taxon 181, and Veillonella atypica, whereas they were negatively correlated with Catonella morbi, Fretibacterium fastidiosum, Leptotrichia sp. oral taxon 212, Anaeroglobus geminatus, and Prevotella maculosa. The relative abundance of Veillonella parvula, Enterococcus faecium, Corynebacterium striatum, Campylobacter gracilis, Candida albicans, Actinomyces sp. oral taxon 181, and Veillonella atypica were inversely associated with total protein levels (TP), while TP levels showed positive correlations with Catonella morbi and Fretibacterium fastidiosum. Furthermore, historical or active smoking positively correlated with the presence of Campylobacter rectus.
Figure 5. Heatmap analysis of the correlation between tongue coating microbiota composition and clinical indexes. The heatmap of the multivariable model describing the top associations between the independent variables and bacterial features. Positive associations are in red, while inverse associations are in blue. The color gradient represents the strength of the association, with darker colors representing stronger associations. The effect size was calculated by the following formula: (−log(qval)*SIGN (coeff)). Cr: creatinine, GLB: globulin, ALB: albumin, TP: total protein, AST: aspartate aminotransferase, TC: total cholesterol, LY: lymphocyte.
Pathway and function enrichment analysis of differential microbiome
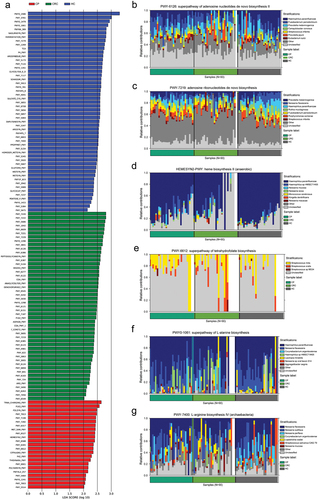
The LefSe analysis shows the enrichment of pathways in three groups based on data from the MetaCyc database (). The tongue coating microbiota-related pathways enriched in the CRC group were involved in the de novo biosynthesis of adenosine nucleotides and adenosine ribonucleotides, in which most of the contributing strains were derived from Prevotella jejuni and Streptococcus infantis (). Pathways enriched in the CP group were involved in heme biosynthesis and the superpathway of tetrahydrofolate biosynthesis; the pathway was enriched by Streptococcus mitis and Kingella denitrificans (). Meanwhile, dominant pathways for the HC group included the biosynthesis of amino acid biosynthesis, especially the biosynthesis of L-alanine and L-arginine that originated from various species such as Neisseria flavescens and Haemophilus parainfluenzae (). The MetaCyc pathway analysis predicted different metabolic functions of tongue coating microbiota between the three groups. Given the dysbiosis of the tongue coating microbiome in the CRC group, we believed the microbiota imbalance alters systematic metabolism.
Figure 6. Enrichment of functional pathways of differential bacteria among the three groups. (a) LDA values of different pathways in samples from the three groups. (b,c) Relative contribution of tongue coating microbes to pathways in CRC patients. (d,e) Relative contribution of tongue coating microbes to pathways in CP patients. (f,g) Relative contribution of tongue coating microbes to pathways in HC samples. Enrichment was defined as p < 0.05, q < 0.1, and LDA > 2.0. HC: healthy controls, CP: patients with colorectal polyps (CP), CRC: patients with colorectal cancer.
A classifier based on the tongue coating taxonomical abundance of our cohort
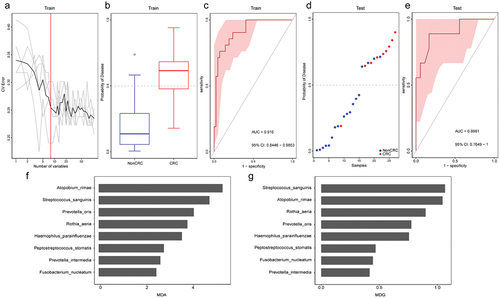
We next explored whether the tongue coating microbiome profiling data could distinguish CRC patients from non-CRC participants by constructing a disease classifier using a random forest model and the data for the relative abundances of species level. Seventy percent samples were randomly chosen as the training group, and the rest 30% constituted the testing group. As a result, the training and testing groups area under the receiver operating curve (AUC) of the corresponding ROC curve reached 0.915 (95% confidence interval [CI] 0.845 to 0.985) and 0.898 (95% CI 0.745–1.00), respectively (). The bacterial species used for classification include Atopobium rimae, Streptococcus sanguinis, Prevotella oris, Rothia aeria, Haemophilus parainfluenzae, Peptostreptococcus stomatis, Prevotella intermedia, and Fusobacterium nucleatum. Among them, Atopobium rimae, which was increased in the tongue coating microbiome from the CRC group, had the most predictable power.
Figure 7. Tongue coating microbiome as a non-invasive diagnostic model for CRC. (a) The random forest models to identify eight species as optimal biomarkers, using the cross-validation error curve. (b) The POD value in the discovery cohort. (c) Receiver operating characteristic (ROC) in the discovery cohort. (d) The POD value in the validation cohort. (e) ROC for the validation cohort samples. (f-g) MDA and MDG of attributes as assigned by the random forest. POD, probability of disease; CV error, cross-validation error; AUC, area under the curve; CRC, Patients with CRC; NonCRC, colonoscopy-negative controls or patients with colorectal polyps; MDA, Mean Decrease Accuracy; MDG, Mean Decrease Gini.
Discussion
A series of studies showed the microbiome in the body always influences our physical health directly [Citation31]. Similarly, our study found the difference of tongue coating microbiota existed in patients with CRC and healthy controls, and Atopobium rimae could be a potential biomarker for CRC research. Numerous previous studies have reported the gut-type bacteria on CRC, particularly Fusobacterium nucleatum (Fn) [Citation32–34]. Also, some researchers discovered that Fn in the oral cavity would enhance the viability of cancer cells, and a high burden of Fn in healthy individuals or patients with colorectal polyps may lead to CRC [Citation35,Citation36]. Whereas, little attention has been paid to the potential function of tongue coating microbiome, whether high abundance Fn in tongue coating is associated with CRC risk directly maintain unknown, hampers the mechanistic investigations of tongue coating bacteria in CRC development.
In our study, we observed a significant shift of tongue coating microbiome from phylum to species levels between CRC and control participants. Especially, at the phylum level, Proteobacteria was the most abundant in HC, and Actinobacteria was present predominantly in the CRC group. Factually, the dominant phylum sorts we reported in the tongue coating microbiota were members of saliva and gut [Citation37,Citation38], confirming the fact that the mouth and gut are linked along the gastrointestinal tract. More interestingly, Actinobacteria was found to be rich in the tongue coating of volunteers with adenomas and CRC is a Gram-positive anaerobic bacterium that is mostly pathogenic [Citation39]. Brandilyn et al. have found that genera Actinomyces can be highlighted as a potential CRC driver bacterium, as it was over-represented in gut microbiota of CRC patients [Citation40]. The results obtained propose more attention to the pathogenic microbiota Actinobacteria in the tongue coating, which may contribute to CRC via inflammatory mechanisms.
Our data of the 10 most abundant bacterial genera across all three group samples were Neisseria, Prevotella, Fusobacterium, Actinomyces, Streptococcus, Rothia, Porphyromonas, Veillonella, Haemophilus, and Capnocytophaga, which are similar to previous studies of the oral microbiota [Citation41–43]. Besides, we also found that the relative abundance of Neisseria and Haemophilus in the healthy people was higher than that in the cancer group; Actinomyces and Leptotrichia were linked to an increased risk of CRC, same with those papers that selected the research samples of tongue coating [Citation7]. However, always, different sample types and different detection methods may result in ambiguous results. For example, research from Yang and colleagues conducted a nested case–control study including 231 incident CRC cases and 462 controls with 75% of the subjects being African-Americans, all mouth rinse samples in this study were detected with 16sRNA method. As a result, they found the oral pathogens Treponema denticola and Prevotella intermedia were associated with an increased risk of CRC. Their research results are quite different from ours, for what we found was that Atopobium rimae, Streptococcus sanguinis, and Prevotella oris were deferentially abundant in CRC. In addition, the same analysis on pancreatic head cancer patients suggested the Leptotrichia, Fusobacterium, Rothia, Actinomyces, Corynebacterium, Atopobium, Peptostreptococcus, Catonella, Oribacterium, Filifactor, Campylobacter, Moraxella and Tannerella were over-represented in the tongue coating, and Haemophilus, Porphyromonas and Paraprevotella were enriched in the tongue coating microbiota of healthy controls [Citation44], showing a significant divergence with the findings in our study.
There were 50 discriminatory species in the CRC, CP and HC groups. Of them, the species Veillonella atypica, Megasphaera micronuciformis, and Veillonella parvula were significantly higher in patients with CRC. Notably, similar to the previous finding, the presence and abundance of Veillonella atypica, which may undergo lactic acid metabolism through the tricarboxylic acid cycle pathway that is involved both in the pathogenesis of inflammatory bowel disease and CRC [Citation45]. Moreover, Liao and colleagues reported that Megamonas is highly abundant in the Asian population, indicating that the bacteria may be characteristic of Asian populations [Citation46]. Further, salivary Megasphaera was observed to be more abundant in lung cancer patients [Citation47], showing the alignment and divergence of those microbes in the human body.
Next, we performed a multidimensional clustering analysis and between-class analysis (BCA) aimed to distinguish the microbiota types of participants, basing on relative abundances using Jensen-Shannon divergence (JSD) distance and the partitioning around medoids (PAM) clustering algorithm. A previous study performed by Arumugam et al. suggested that gut microbiota can be roughly divided into three enterotypes, namely Bacteroides, Prevotella, and Ruminococcus. Likewise, based on the contribution of oral bacteria to the tongue coating microbiota, three distinct clusters were formed, and we designated these as fur-types. The fur-types were driven by specific community compositions, but these were not the highly abundant species. In this work, we explored the tongue coating microbiome in humans across three clusters among a panel of 10 biomarkers, and cluster fur-type 1 and fur-type 3 were higher in the CRC and HC groups, respectively. The Mogibacterium diversum rich in fur-type 1, and Porphyromonas somerae, Neisseria flavescens, and Haemophilus parainfluenzae over-expressed in fur-type 3 may be helpful for the diagnosis and differentiation of CRC. In other words, if patients were driven by those oral microorganisms, such as Mogibacterium diversum, Porphyromonas somerae, Neisseria flavescens, and Haemophilus parainfluenzae, is likely to increase the risk of CRC. However, CRC may not have been caused by one dominant species, and further research is required to verify the robustness of the fur-types referred.
We studied the correlations between tongue coating microbiome and clinical characteristics of diseased human by using the MaAsLin2 analytic method. After adjusting for age, gender, and BMI, Veillonella parvula, Enterococcus faecium, and Corynebacterium striatum in CRC patients positively associated with Cr, GLB, and ALB levels, but displayed an inverse association with the TP level. However, these indicators negatively correlated with Catonella morbi, Fretibacterium fastidiosum, Leptotrichia sp. oral taxon 212, Anaeroglobus geminatus, and Prevotella maculosa. Besides, tongue coating microbial dysbiosis was observed in cigarette-smoking patients, especially with the enrichment of Campylobacter rectus. In total, clinical biochemical indices such as Cr, GLB, ALB, and TP levels, and smoking, all of which correlated with the microbiome extracted from tongue coating, are suggested as factors in the innate immune response of CRC. Apart from this, CRC could be an age-associated disease. Research has shown that Wepericorum, Pricococcus, and Streptococcus are comicrobiomes in all age groups; Clostridium perfringens is present on the tongue of most children; Uncultured prevotellaceae bacterium B00064B52 has been reported in just the aged group, and the genus Poulet was reported in young and middle-aged groups [Citation48,Citation49]. Given that there are no significant age differences between groups in our study, we advise that further study should be undertaken to determine the association of age and CRC, collecting data from diverse participant groups and environments.
The MetaCyc pathway analysis found dysregulation in many metabolic pathways in CRC patients. One mechanism of pathway dysregulation is cancer cells are fast-growing, with enhanced metabolic needs and, hence, the requirement for de novo synthesis of essential metabolites is high [Citation50]. To synthesize large amounts of energy and nucleotides for DNA and RNA of cancer cells, de novo nucleotide biosynthesis enables cells to proliferate rapidly. Historically, the nucleotide synthesis pathway is targeted to cancer, as nucleotides form building blocks for DNA synthesis in cells, and cancer cells have a heightened need due to their fast growth [Citation51]. Therefore, nucleotide biosynthesis over-expression of the tongue coating microbiome in the CRC group leads to rapid cell proliferation.
Overall, the spread of tongue coating microbes to the different individuals and diverse diseases are heterogeneous, but all the research results mentioned above show that the tongue diagnosis may provide potential screening and early diagnosis method for cancers. Therefore, the more valuable clues of the microbes on the tongue coating of cancers, the potential microbiological indicators of screening and early diagnosis of cancer are more reliable.
This study has several limitations that can be improved in future studies. First, limited clinical information about patients and healthy individuals was obtained; more basic information, such as metabolic and immunological parameters, is needed for a broader perspective on the study of CRC. Second, the present study has a small sample size, and the clustering analysis findings need to be validated in a larger sample in the future.
Conclusion
In conclusion, in this study, we confirmed the tongue coating microbiota profiles of patients with CRC differ from those of HC; Atopobium rimae with an AUC of 0.915 was found to be a potential discriminating biomarker for improving research on CRC prediction and diagnosis. Furthermore, the predictable biomarker and fur-types we proposed here could advance our understanding of the functional significance of tongue coating microbial communities and provide a new perspective for further study of tongue coating function in the future. Due to the lack of metagenome sequencing research on tongue coating microbiota, further studies are warranted to evaluate the tongue coating microbiota in larger CRC cohorts, as well as to investigate the effectiveness of the tongue coating microbiota-based biomarkers, such as the presence of Atopobium rimae, in predicting and diagnosing CRC.
Supplemental Material
Download PDF (1.1 MB)Disclosure statement
No potential conflict of interest was reported by the author(s).
Supplemental data
Supplemental data for this article can be accessed online at https://doi.org/10.1080/20002297.2024.2344278
Additional information
Funding
References
- Rawla P, Sunkara T, Barsouk A. Epidemiology of colorectal cancer: incidence, mortality survival, and risk factors. Prz Gastroenterol. 2019;14(2):89–14. doi: 10.5114/pg.2018.81072
- Siegel RL, Miller KD, Goding Sauer A, et al. Colorectal cancer statistics. CA Cancer J Clin. 2020;70(3):145–164. doi: 10.3322/caac.21601
- Siegel RL, Wagle NS, Cercek A, et al. Colorectal cancer statistics. CA Cancer J Clin. 2023;73(3):233–254. doi: 10.3322/caac.21772
- Xia C, Dong X, Li H, et al. Cancer statistics in China and United States, 2022: profiles, trends, and determinants. Chin Med J (Engl). 2022;135(5):584–590. doi: 10.1097/CM9.0000000000002108
- Yuan ZR, Weng S, Ye C, et al. CSCO guidelines for colorectal cancer version 2022: updates and discussions. Chin J Cancer Res. 2022;34(2):67–70. doi: 10.21147/j.issn.1000-9604.2022.02.01
- Xie YH, Gao Q-Y, Cai G-X, et al. Fecal clostridium symbiosum for noninvasive detection of early and advanced colorectal cancer: test and validation studies. EBioMedicine. 2017;25:32–40. doi: 10.1016/j.ebiom.2017.10.005
- Han S, YANG XI, QI Q, et al. Potential screening and early diagnosis method for cancer: tongue diagnosis. Int J Oncol. 2016;48(6):2257–2264. doi: 10.3892/ijo.2016.3466
- McGovern J, Dolan RD, Horgan PG, et al. The prevalence and prognostic value of frailty screening measures in patients undergoing surgery for colorectal cancer: observations from a systematic review. BMC Geriatr. 2022;22(1):260. doi: 10.1186/s12877-022-02928-5
- Baxter NT, Ruffin M, Rogers MA, et al. Microbiota-based model improves the sensitivity of fecal immunochemical test for detecting colonic lesions. Genome Med. 2016;8(1):37. doi: 10.1186/s13073-016-0290-3
- Dominguez-Bello MG, Godoy-Vitorino F, Knight R, et al. Role of the microbiome in human development. Gut. 2019;68(6):1108–1114. doi: 10.1136/gutjnl-2018-317503
- Feng Q, Liang S, Jia H, et al. Gut microbiome development along the colorectal adenoma–carcinoma sequence. Nat Commun. 2015;6(1):6528. doi: 10.1038/ncomms7528
- Yachida S, Mizutani S, Shiroma H, et al. Metagenomic and metabolomic analyses reveal distinct stage-specific phenotypes of the gut microbiota in colorectal cancer. Nat Med. 2019;25(6):968–976. doi: 10.1038/s41591-019-0458-7
- Georg Z, Tap, J., Voigt, A.Y. et al. Potential of fecal microbiota for early-stage detection of colorectal cancer. Mol Syst Biol. 2014;10:1–12.
- Flynn KJ, Baxter NT, Schloss PD, et al. Metabolic and community synergy of oral bacteria in colorectal cancer. mSphere. 2016;1(3):1–6. doi: 10.1128/mSphere.00102-16
- Li Y, Cui J, Liu Y, et al. Oral, tongue-coating microbiota, and metabolic disorders: a novel area of interactive research. Front Cardiovasc Med. 2021;8:730203. doi: 10.3389/fcvm.2021.730203
- Pang W, Zhang D, Zhang J, et al. Tongue features of patients with coronavirus disease 2019: a retrospective cross-sectional study. Integr Med Res. 2020;9(3):100493. doi: 10.1016/j.imr.2020.100493
- Fan ZX, Tang P, Li C, et al. Fusobacterium nucleatum and its associated systemic diseases: epidemiologic studies and possible mechanisms. Journal Of Oral Microbiology. 2022;15(1):1. doi: 10.1080/20002297.2022.2145729
- Rashid MU, Weintraub A, Nord CE. Effect of new antimicrobial agents on the ecological balance of human microflora. Anaerobe. 2012;18(2):249–253. doi: 10.1016/j.anaerobe.2011.11.005
- Brandon P. Tongue: anatomy, function, and common disorders-How this organ helps with eating, tasting, speaking, and breathing. Verywell Health Com/tongue-Anatomy-4774957. 2023;10:03.
- Chen H. The composition of the oral microbiome and its relationship with human diseases master. Shanghai Jiao Tong University. 2016.
- Seerangaiyan K, Juch F, Winkel EG. Tongue coating: its characteristics and role in intra-oral halitosis and general health—a review. J Breath Res. 2018;12(3):034001. doi: 10.1088/1752-7163/aaa3a1
- Schmidt TS, Hayward MR, Coelho LP, et al. Extensive transmission of microbes along the gastrointestinal tract. Elife. 2019;8. doi: 10.7554/eLife.42693
- Zeng X, Gupta RK. Call for papers: emerging markets and technologies. Biopreserv Biobank. 2022;20(1):1–11. doi: 10.1089/bio.0113
- Russo E, Bacci G, Chiellini C, et al. Preliminary comparison of oral and intestinal human microbiota in patients with colorectal cancer: a pilot study. Front Microbiol. 2017;8:2699. doi: 10.3389/fmicb.2017.02699
- Segata N, Waldron L, Ballarini A, et al. Metagenomic microbial community profiling using unique clade-specific marker genes. Nat Methods. 2012;9(8):811–814. doi: 10.1038/nmeth.2066
- Beghini F, McIver LJ, Blanco-Míguez A, et al. Integrating taxonomic, functional, and strain-level profiling of diverse microbial communities with bioBakery 3. Elife. 2021;10. doi: 10.7554/eLife.65088
- Nicola S, Izard J, Waldron L, et al. Metagenomic biomarker discovery and explanation. Genome Biol. 2011;12(6):R60. doi: 10.1186/gb-2011-12-6-r60
- Dhariwal A, Chong J, Habib S, et al. MicrobiomeAnalyst: a web-based tool for comprehensive statistical, visual and meta-analysis of microbiome data. Nucleic Acids Res. 2017;45(W1):W180–W188. doi: 10.1093/nar/gkx295
- Mallick H, Rahnavard A, McIver LJ, et al. Multivariable association discovery in population-scale meta-omics studies. PLOS Comput Biol. 2021;17(11):e1009442. doi: 10.1371/journal.pcbi.1009442
- Arumugam M, Raes J, Pelletier E, et al. Enterotypes of the human gut microbiome. Nature. 2011;473(7346):174–180. doi: 10.1038/nature09944
- Lu H, Ren Z, Li A, et al. Deep sequencing reveals microbiota dysbiosis of tongue coat in patients with liver carcinoma. Sci Rep. 2016;6(1):33142. doi: 10.1038/srep33142
- Hu J, Han S, Chen Y, et al. Variations of tongue coating microbiota in patients with gastric cancer. BioMed Res Int. 2015;2015:1–7. doi: 10.1155/2015/173729
- Kostic AD, Chun E, Robertson L, et al. Fusobacterium nucleatum potentiates intestinal tumorigenesis and modulates the tumor-immune microenvironment. Cell Host Microbe. 2013;14(2):207–215. doi: 10.1016/j.chom.2013.07.007
- Castellarin M, Warren RL, Freeman JD, et al. Fusobacterium nucleatum infection is prevalent in human colorectal carcinoma. Genome Res. 2012;22(2):299–306. doi: 10.1101/gr.126516.111
- LaCourse KD, Zepeda-Rivera M, Kempchinsky AG, et al. The cancer chemotherapeutic 5-fluorouracil is a potent Fusobacterium nucleatum inhibitor and its activity is modified by intratumoral microbiota. Cell Rep. 2022;41(7):111625. doi: 10.1016/j.celrep.2022.111625
- Galeano Nino JL, Wu H, LaCourse KD, et al. Effect of the intratumoral microbiota on spatial and cellular heterogeneity in cancer. Nature. 2022;611(7937):810–817. doi: 10.1038/s41586-022-05435-0
- Zhang S, Kong C, Yang Y, et al. Human oral microbiome dysbiosis as a novel non-invasive biomarker in detection of colorectal cancer. Theranostics. 2020;10(25):11595–11606. doi: 10.7150/thno.49515
- Jeong JK, Ahn K, Mun S, et al. Understanding the bacterial compositional network associations between oral and gut microbiome within healthy Koreans. J Oral Microbiol. 2023;15(1):1. doi: 10.1080/20002297.2023.2186591
- Tarcoveanu E, Vasilescu A, Andronic D, et al. AbdominaL actinomycosis mimicking colon cancer. Chirurgia (Bucur). 2019;114(2):251–258. doi: 10.21614/chirurgia.114.2.251
- Peters BA, Dominianni C, Shapiro JA, et al. The gut microbiota in conventional and serrated precursors of colorectal cancer. Microbiome. 2016;4(1):69. doi: 10.1186/s40168-016-0218-6
- Segata N, Haake SK, Mannon P, et al. Composition of the adult digestive tract bacterial microbiome based on seven mouth surfaces, tonsils, throat and stool samples. Genome Biol. 2012;13(6):R42. doi: 10.1186/gb-2012-13-6-r42
- Bassis CM, Erb-Downward JR, Dickson RP, et al. Analysis of the upper respiratory tract microbiotas as the source of the lung and gastric microbiotas in healthy individuals. MBio. 2015;6(2):e00037. doi: 10.1128/mBio.00037-15
- Flemer B, Warren RD, Barrett MPJ, et al. The oral microbiota in colorectal cancer is distinctive and predictive. BMJ Open Access. 2018;8(8):1454–1463. doi: 10.1136/GUTJNL-2017-3148
- Lu H, Ren Z, Li A, et al. Tongue coating microbiome data distinguish patients with pancreatic head cancer from healthy controls. J Oral Microbiol. 2019;11(1):1563409. doi: 10.1080/20002297.2018.1563409
- Shi YC, Cai S-T, Tian Y-P, et al. Effects of proton pump inhibitors on the gastrointestinal microbiota in gastroesophageal reflux disease. Int J Geno Prot. 2019;17(1):52–63. doi: 10.1016/j.gpb.2018.12.004
- Liao M, Xie Y, Mao Y, et al. Comparative analyses of fecal microbiota in Chinese isolated Yao population, minority Zhuang and rural han by 16sRNA sequencing. Sci Rep. 2018;8(1):1142. doi: 10.1038/s41598-017-17851-8
- Lee SH, Sung JY, Yong D, et al. Characterization of microbiome in bronchoalveolar lavage fluid of patients with lung cancer comparing with benign mass like lesions. Lung Cancer. 2016;102:89–95. doi: 10.1016/j.lungcan.2016.10.016
- Chen FG, Gao W, Yu C, et al. Age-associated changes of nasal bacterial microbiome in patients with chronic rhinosinusitis. Front Cell Infect Microbiol. 2022;12:786481. doi: 10.3389/fcimb.2022.786481
- Ma GQ, Zhang CH, Xu HB, et al. Analysis of human tongue microbial community structure by PCR-DGGE method. Jiang Xi Science. 2018;36:923–926. doi: 10.13990/j.issn1001-3679.2018.06.005
- Robinson AD, Eich ML, Varambally S. Dysregulation of de novo nucleotide biosynthetic pathway enzymes in cancer and targeting opportunities. Cancer Lett. 2020;470:134–140. doi: 10.1016/j.canlet.2019.11.013
- Vander HM, Cantley LC, Thompson CB. Understanding the Warburg effect: the metabolic requirements of cell proliferation. Science. 2009;324(5930):1029–1033. doi: 10.1126/science.1160809