
ABSTRACT
The microRNA (miRNA) cargo contained in plasma extracellular vesicles (EVs) offers a relatively little explored source of biomarkers for brain diseases that can be obtained noninvasively. Methods to isolate EVs from plasma, however, are still being developed. For EV isolation, it is important to ensure the removal of vesicle-free miRNAs, which account for approximately two-thirds of plasma miRNAs. Membrane particle precipitation-based EV isolation is an appealing method because of the simple protocol and high yield. Here, we evaluated the performance of a precipitation-based method to obtain enriched EV-specific miRNAs from a small volume of rat plasma. We performed size-exclusion chromatography (SEC) on precipitation-isolated EV pellets and whole plasma. The SEC fractions were analysed using Nanoparticle Tracking Analysis (NTA), protein and miRNA concentration assays, and droplet digital polymerase chain reaction for four miRNAs (miR-142-3p, miR-124-3p, miR-23a, miR-122). Precipitation-isolated EVs and selected SEC fractions from the plasma were also analysed with transmission electron microscopy (TEM). Precipitation-based EV isolation co-precipitated 9% to 15% of plasma proteins and 21% to 99% of vesicle-free miRNAs, depending on the individual miRNAs. In addition, the amount of miR-142-3p, found mainly in EV fractions, was decreased in the EV fractions, indicating that part of it was lost during precipitation-based isolation. Western blot and TEM revealed both protein and lipoprotein contamination in the precipitation-isolated EV-pellets. Our findings indicate that a precipitation-based method is not sufficient for purifying plasma EV-contained miRNA cargo. The particle number measured by NTA is high, but this is mostly due to the contaminating lipoproteins. Although a part of the vesicle-free miRNA is removed, vesicle-free miRNA still dominates in plasma EV pellets isolated by the precipitation-based method.
Introduction
Extracellular vesicles (EVs), lipid particles found in all body fluids, are secreted by many cell types and used in inter-cellular communication [Citation1]. Both the surface proteins and the cargo, especially in plasma EVs, represent emerging targets for biomarker and treatment discovery for various diseases [Citation2].
Currently, there are several methods for isolating plasma EVs. Each method has its advantages and disadvantages [Citation3]. Several commercial EV isolation kits, such as the miRCURY™ Exosome Isolation Kit, ExoQuick and Invitrogen Total Exosome isolation reagent, are based on the precipitation of membrane particles. According to a worldwide survey performed in 2015 by the International society for extracellular vesicles (ISEV), precipitation-based methods are used especially for biologic samples with a small starting volume. In addition, 84% of researchers using precipitation techniques perform RNA analysis of the EV fraction [Citation4].
In addition to EVs, plasma contains a high number of lipoproteins, including high-density lipoproteins (HDL), low-density lipoproteins, very low-density lipoproteins and chylomicrons [Citation5]. Some of these lipoproteins are within the size-range or density of EVs, which makes it difficult to isolate EVs from plasma [Citation6,Citation7].
MicroRNAs are small non-coding RNAs that regulate protein synthesis at the post-transcriptional level. Circulating miRNAs are considered potential biomarkers, such as for cancer, infections, and neurologic diseases [Citation8–Citation10]. Circulating miRNAs are not intrinsically resistant to endogenous RNases and therefore, require protection against degrading enzymes [Citation11]. In plasma, miRNAs are found in EVs [Citation1,Citation11], lipoproteins like HDL and low-density lipoproteins [Citation12,Citation13], and protein complexes [Citation11,Citation14]. All these carriers appear to have an individual miRNA profile [Citation13]. A study using size exclusion chromatography (SEC) estimated that approximately 15% of circulating miRNAs in humans are enriched in EV fractions and 66% are enriched in lipoprotein/protein fractions [Citation11]. In addition, a notable amount of protein-bound miRNA appears to be bound specifically to Argonaute-2, a protein in the intracellular miRNA-silencing complex [Citation11,Citation14]. A recent position paper by the ISEV listed the opportunities and limitations of EV-related RNA studies emphasising that the methods are still developing, and that isolation techniques, especially regarding RNA, must be critically evaluated [Citation3].
Several studies have compared the miRNA yield in EVs obtained from plasma or serum using different EV isolation methods, including precipitation-based methods [Citation15–Citation21]. Based on microarray or next generation sequencing studies it is evident that the EV isolation method influences the captured miRNome [Citation20–Citation22]. The presence of lipoproteins, of contaminating miRNAs or miRNA-binding proteins is less studied [Citation15]. In studies of EV miRNA cargo, it is critical to ensure that protein- and lipoprotein-bound miRNAs are removed during the EV isolation process. The present study aimed to test the efficiency of the precipitation-based miRCURY™ Exosome Isolation Kit – Serum and Plasma, combined with filtration, for removing non-EV-related miRNAs, and thereby enriching the EV miRNA cargo from rat plasma.
Materials and methods
Animals and plasma collection
Naïve male Sprague-Dawley rats (n = 5, body weight 327–403 g at the time of decapitation) were used. Water and pellet food were freely available and provided ad libitum. All animal procedures were approved by the Animal Ethics Committee of the Provincial Government of Southern Finland and carried out in accordance with the guidelines of the European Community Council Directives 2010/63/EU.
Rats were anesthetised with isoflurane and decapitated. The trunk blood was collected into K2-EDTA-tubes (di-potassium ethylenediaminetetraacetic acid, Vacutainer, BD Biosciences, Franklin Lakes, NJ, USA). The tubes were immediately placed into ice. For plasma isolation, blood samples were centrifuged at 1300g for 10 min (+4⁰C) within 1 h after collection and stored in 200 µl aliquots at −70°C until further processed.
EV isolation using a precipitation-based method
EVs for various experiments were isolated from 250–800 µl of trunk plasma. A 10 µl aliquot of pooled plasma was stored at −70°C for sodium dodecyl sulfate-polyacrylamide gel electrophoresis (SDS-PAGE) and Western blot analysis. The remaining plasma was used for EV isolation with the miRCURY™ Exosome Isolation Kit—Serum and Plasma (#300112, Exiqon A/S, Denmark). Briefly, after thrombin treatment, the plasma was filtered through a 0.22 µm polyvinylidene difluoride filter (#SLGV013SL, Millex-GV, Merck Millipore) to eliminate larger vesicles. Next, the filtered plasma was combined with 0.4 volumes of precipitation buffer, incubated for 1 h at 4°C and then the EVs were pelleted by centrifugation (500 g, 5 min, RT). The pelleted EVs were resuspended in 270 µl resuspension buffer from the kit and stored at −70°C and the supernatant was collected and stored at −70°C.
EV isolation with SEC and RNA isolation
From each of the four rats, eight 200 µl aliquots (total volume 1 600 µl) were pooled and used for analysis. After centrifugation (5 min, 10,000 g), the supernatant was divided into two 800 µl aliquots.
Plasma SEC analysis (plasma-SEC). The first 800 µl aliquot was filled to 1 ml with filtered (0.22 µm) PBS containing 0.32% trisodium citrate and loaded into a 10 ml Sepharose CL-2B column as described by Böing et al. [Citation23]. After loading, 25 fractions of filtrates (500 µl each) were collected.
EV pellet SEC analysis (EV-SEC). EVs from the second 800 µl plasma aliquot was isolated using the miRCURY™ Exosome Isolation Kit—Serum and Plasma as described above. The resuspended precipitation-isolated EV pellet (270 µl) was combined with 730 µl of 0.22 µm filtered phosphate-buffered saline (PBS, VWRVE404-200TABS, VWR) including 0.32% trisodium citrate, and then loaded into the SEC column. After loading, 25 fractions of filtrates (500 µl each) were collected.
RNA isolation. RNA was isolated from the SEC fractions (plasma-SEC and EV-SEC) obtained from two individual rats. For RNA isolation, 400 µl portions of each of the two consecutive 500 µl SEC fractions were combined, starting from fraction 4. This resulted in 11 800 µl fractions per SEC for RNA isolation. Each 800 µl fraction was combined with five volumes of Qiazol lysis reagent (#79306, Qiagen), vortexed for 10 s, and incubated at room temperature for 5 min. The mixture was then frozen in dry ice and stored at −80°C. After thawing on ice, chloroform (0.2 volumes) was added to the Qiazol-mixture. The phases were separated by centrifugation (15 min, 4°C, 12,000g) and then ethanol (1.5 volumes) was added to the collected aqueous phase. The mixture was loaded into a single affinity column from miRNeasy Mini Kit (Qiagen, #217004) and washed according to the kit’s instructions. Finally, the RNA was eluted with 30 µl of nuclease-free water. The miRNA concentration of the purified RNA was measured using a Qubit® microRNA Assay Kit (#Q32880, Thermo Fisher Scientific) and a DeNovix DS-11 FX fluorometer. The remaining fractions were saved for nanoparticle tracking analysis (NTA) and protein concentration analyses. Protein concentration was measured using a Pierce BCA protein assay kit according to manufacturer instructions (#23225, Thermo Fisher Scientific).
Nanoparticle tracking analysis
NTA was used to measure the relative concentration and size distribution of the particles. Measurements were obtained using NS300 NanoSight (Malvern, Worcestershire, UK). Polystyrene latex beads (91 nm; Bal-Tec, Balzers, Lichtenstein) were used as a positive control and PBS (VWRVE404-200TABS, VWR) was used as a negative control. For recordings, the camera level was adjusted to 13 (range: 1–16) and the remaining settings were set to automatic. The sample was injected to the sample chamber at a constant flow rate using the Malvern NanoSight syringe pump system. Three 30 s captures per sample were recorded. For analysis of the recordings, the settings were set to automatic, except for the detection threshold, which was set to 5. Each sample was diluted to reach a concentration between 5×10Citation7 and 2×10Citation9 particles/ml, expect for SEC fractions 1–7 whose particle counts were too low to reach the detectable concentration range.
SDS-PAGE and western blot
Protein concentrations in the plasma, EVs, and supernatant samples were determined using the Pierce BCA protein assay kit. First, samples were mixed with 2x RIPA lysis buffer and incubated at 4°C for 15 min. The samples were mixed with 4x Laemmli sample buffer (#161–0747, Bio-Rad, Hercules, CA, USA) including 2-mercaptoethanol and denatured at 95°C for 10 min. For Western blot analysis, 5 µg (albumin) or 25 µg (Tsg-101 and ApoA1) protein was separated by 12% SDS-PAGE (TGX Stain-Free™ FastCast™ Acrylamide kit, Bio-Rad, 161–0185) and transferred to Amersham Hybond-P polyvinylidene difluoride membranes (P 0.45, GE Healthcare) using a Thermo Scientific™ Pierce™ Power Blotter. Protein bands on the gels and membranes were visualised after separation and transfer using a Bio-Rad ChemiDoc™ TM MP System.
Primary antibodies against ApoA1 (rabbit, dilution 1:400, Abcam, Cambridge, MA, USA, ab33470), albumin (goat, dilution 1:2000, Santa Cruz Biotechnology, Dalas, TX, USA, sc-46,293) and Tsg-101 (rabbit, dilution 1:5000, Abcam, Cambridge, MA, USA, ab125011) were used for the Western blot analysis. After primary and secondary antibody incubations (mouse anti-rabbit horseradish peroxidase [HRP; dilution 1:10,000 or 1:5000, Abcam ab99697] or rabbit anti-goat HRP [dilution 1:10,000, Santa Cruz Biotechnology, sc-2922]), the membranes were subjected to HRP chemiluminescent substrate (#34080, SuperSignal™ West Pico Chemiluminescent Substrate, Thermo Fisher Scientific). Protein bands were visualised using the signal accumulation mode in Bio-Rad ChemiDoc™ MP System. Image Lab™ (version 6.0, Bio-Rad) was used to measure the adjusted intensity of the albumin bands after SDS-PAGE.
Scanning electron microscopy
For scanning electron microscopy (SEM), EVs were isolated from 350 µl rat plasma using the miRCURY™ Exosome Isolation Kit—Serum and Plasma as described above. SEM of the EVs was performed as previously described [Citation24]. Briefly, precipitation-isolated EV preparations were diluted 1:10 in PBS and left to settle onto poly-D-lysine-coated coverslips overnight at 4°C. They were then washed in 0.1 M sodium cacodylate and 0.1 M sucrose (pH 7.4) and fixed in sodium cacodylate-buffered 2% (v/v) glutaraldehyde for 30 min. After washing with 0.1 M sodium cacodylate the samples were postfixed in 1% osmium tetroxide and 0.1 M Na-cacodylate for 1 h followed by washing with sodium cacodylate and distilled water. Thereafter, the samples were dehydrated through a graded series of ethanol. Samples were chemically dried with hexamethyldisilazane, air-dried, coated with chrome and imaged with a Zeiss Sigma HD|VP (Carl Zeiss Microscopy GmbH, Oberkochen, Germany) scanning electron microscope at 3 kV. A negative control was prepared using PBS as the starting material. Solution containing 91-nm polystyrene latex beads (Bal-Tec) served as a positive control.
Transmission electron microscopy
For transmission electron microscopy (TEM), EVs were isolated from 250 µl of rat plasma using the miRCURY™ Exosome Isolation Kit—Serum and Plasma as described above. In addition, SEC was performed with 250 µl of plasma as described above. TEM of EVs was performed according to Thery et al. [Citation25]. Before preparing the TEM samples, SEC fractions 6–7 were concentrated to ~100 µl using an Amicon Ultra-4 10 K concentrator column. Next, SEC fractions 8–10 and 12–13 were concentrated to 390 µl and 260 µl, respectively, using Pierce 3K concentrator columns. Then, 8 µl of sample was mixed with 8 µl of 4% paraformaldehyde. Five microliters of sample-paraformaldehyde suspension was deposited on each of two Formvar-carbon coated and glow-discharged electron microscopy grids, and the membranes were covered for 20 min. For washing, 100 µl drops of PBS were placed on a sheet of parafilm, and the grids were transferred to the drops for 2 min with the sample membrane side facing down. The grids were transferred to a 50 µl drop of 1% glutaraldehyde for 5 min. The grids were then washed by transferring them to a 100 µl drop of distilled water for 2 min. The washing step was repeated seven times for a total of eight washes. For the contrast, the grids were transferred to a 50 µl drop of uranyl-oxalate solution, pH 7, for 5 min. The grids were then transferred to a 50 µl drop of methyl cellulose-UA for 10 min on ice. The grids were removed with stainless steel loops and the excess fluid was blotted on Whatman no. 1 filter paper. Finally, the grids were air-dried on the loop for 5–10 min and stored in grid storage boxes. Imaging was performed using a JEOL JEM-2100F electron microscope (Jeol Ltd, Tokyo, Japan) at 200 kV.
Droplet digital PCR
Four miRNAs were selected for individual miRNA analysis based on previously reported data. Brain enriched miR-124-3p was found from serum EVs when ExoQuick precipitation-based isolation method was used [Citation26]. Other miRNAs were selected based on the previous knowledge about their co-precipitation with EVs (miR-142-3p) or proteins (miR-23a and miR-122) in SEC [Citation11].
cDNA synthesis was conducted using a TaqMan miRNA Reverse Transcription kit (#4366596, Applied Biosystems™) according to the manufacturer’s instructions. Five microliters of extracted RNA (mmu-miR-124a: assay ref 001182, Thermo Fisher Scientific) or a 1:3 dilution of extracted RNA (hsa-miR-122: 002245, has-miR-23a: 000399 and has-miR-142-3p: 000464, Thermo Fisher Scientific) was used as a template. The cDNA synthesis was conducted with a Bio-Rad T100 Thermal Cycler (30 min at 16°C; 30 min at 42°C; and 5 min at 85°C). TaqMan™ MicroRNA Assays were used in both cDNA synthesis and droplet digital PCR (ddPCR).
For the ddPCR reaction, 1.3 µl of cDNA was combined with 10 µl of 2x ddPCR™ Supermix for Probes (#1863027, Bio-Rad), 1 µl of microRNA Assay and 7.7 µl of nuclease-free water. Samples and 70 µl of droplet generator oil for probes (#1863005, Bio-Rad) were loaded into the wells of the droplet generator cartridge (#1864008, Bio-Rad). Droplets were generated using a QX200 Droplet Generator (Bio-Rad). Droplets were applied to a 96-well plate (#Z651443-25EA, Sigma Millipore, St. Louis, MO, USA), and the plate was sealed with foil (#1814040, Bio-Rad) using a PX1 PCR Plate Sealer (Bio-Rad). The PCR reaction was conducted with a BIO-RAD T100 Thermal Cycler (10 min at 95°C; 40 cycles of 15 s at 95°C and 60s at 60°C; 10 min at 98°C). The fluorescence of each droplet was measured using a QX200 Droplet Reader (Bio-Rad). Data were analysed with QuantaSoft software v1.7 (Bio-Rad) to determine the copy number of the measured miRNA. Each sample was run in duplicate and the mean of positive droplets per 20 µl of reaction mix was used in further calculations. A no-template (nuclease-free water) control was included in each run.
Results
Characterisation of plasma EVs isolated by the precipitation method
To assess the overall quality of the EVs (i.e. EV pellet) that were isolated from rat trunk plasma using a precipitation-based EV isolation method, we applied several techniques recommended by the ISEV, including NTA, SEM, SDS-PAGE, and Western blot [Citation27].
NTA indicated a peak in the EV pellet particle size within the range of 60–120 nm ()). In the positive control (91-nm polystyrene latex beads), NTA detected a constant peak at 83 nm using several settings (data not shown).
Figure 1. Characterisation of EVs isolated using the precipitation method. (a) Scanning electron microscopy (SEM) images of the isolated EV fraction show round vesicle-like particles (black arrows) and smaller background particles. Scale bar: 200 nm in all panels. (b) Nanoparticle tracking analysis (NTA) showed that the size of most particles ranged from 60–120 nm, which is comparable to that measured with SEM. Data are expressed as the mean ± standard error of the mean. (c) SDS-PAGE of proteins in trunk plasma (P), EV pellet (EV), and the remaining supernatant (S). Each lane was loaded with 5 µg protein. Note that almost all protein bands present in plasma were also observed in the EV-pellet. (d) Western blot analysis showed no signal on EV-marker tsg-101, reduced signal in the albumin and enrichment of the HDL marker ApoA1 in the EV pellet. Rat cortex lysate (C) was used as a positive control for tsg-101.
SEM images of the EV pellets revealed spherical particles that were within the same size range as the particles measured with NTA from the same EV isolation ()). In addition, we found a large number of smaller particles in the background. In the positive control (91-nm polystyrene latex beads), SEM showed 90-nm round particles (data not shown). In the negative control (PBS), we detected small asymmetrical particles in the background (data not shown).
SDS-PAGE of total proteins in plasma, EV pellet and supernatant revealed different protein band patterns ()). The albumin band (66 kDa, the most abundant protein in plasma) accounted for 25% of the total intensity of the protein bands in the plasma, 16% in the EV pellet and 32% in the supernatant.
Western blot did not reveal EV-specific marker tsg-101 in the EV pellet, plasma, or supernatant ()). Instead, HDL marker ApoA1 was enriched in the EV pellet ()). Western blot analysis confirmed the presence of albumin in both the EV pellet and supernatant ()). The TGX Stain-free images for all Western blots are presented in Supplementary figure 1.
TEM analysis of precipitation and SEC-isolated EVs
To study the precipitation-isolated EV pellet in more detail, we imaged it with TEM and compared it to results of the SEC EV-isolation from plasma. TEM imaging of the precipitation-isolated EV pellet showed several round particles, some of which were cup-shaped, which is consistent with EVs [Citation23,Citation28,Citation29]. Most of the round particles, however, had a morphology comparable to that of lipoproteins [Citation23,Citation30]. In addition, the TEM images showed a “dense background smudge”, consistent with the presence of protein aggregates [Citation6] ()). In negative control (precipitation purification performed to PBS), no particles or background were visible (Supplementary Figure 2).
Figure 2. (a) Transmission electron microscopy (TEM) analysis of the precipitation-isolated EV pellet showed round particles, presumably lipoproteins (marked with black arrows), and a few cup-shaped particles (marked with white arrows). The “dense smudge” background indicates protein contamination. (b) Plasma size-exclusion chromatography (SEC). The relative number of particles measured with nanoparticle tracking analysis indicated the highest particle count in fractions 12–15 and the highest protein concentration in fractions 18–22. Fractions marked with black boxes were pooled and concentrated for TEM imaging. Data are from one series of SEC fractions. Three 30-sec videos were recorded by NTA for each fraction. Data are expressed as the mean ± standard error of the mean. (c) TEM analysis of SEC fractions 6–7 showed a few cup-shaped vesicles (white arrows) and round lipoprotein-like particles (black arrows). In fractions 8–10 (d) and 12–13 (e) cup-shaped EVs were not found, but were lipoprotein-like particles were observed (black arrows). Particle size distribution from SEC fractions (f) 6–7, (g) 8–10 and (h) 12–13 measured with nanoparticle tracking analysis showed that the proportion of larger particles (>100 nm) was higher in earlier fractions and that of <60 nm particles increased in the later fractions. Fractions are the same as in Figure 2 B. Data from three 30-second videos recorded by NTA are expressed as the mean ± standard error of the mean.
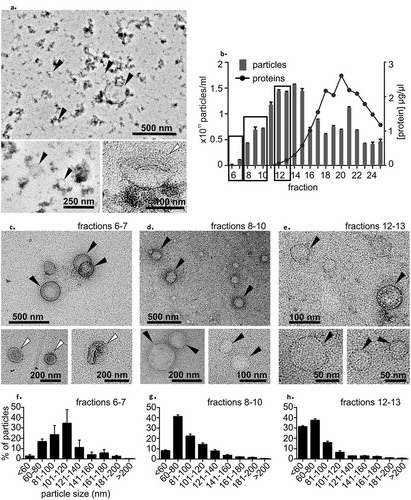
TEM imaging of plasma-SEC revealed a few cup-shaped EVs in the SEC fractions 6–7 ()). As in the TEM images of the precipitation-isolated EV pellet, most of the round vesicles in plasma-SEC fractions 6–7, 8–10 and 12–13 had a diameter ranging from 20 nm to 200 nm, and a morphology consistent with that of lipoproteins (). The plasma-SEC fractions were devoid of the “dense background smudge”. TEM imaging confirmed the particle size distribution measured with NTA, indicating a progressive decrease in the particle diameter from earlier to later SEC fractions (). In addition, Western blot analysis with ApoA1-antibody from plasma-SEC fractions revealed an intensity profile similar to NTA particle profile. The highest intensity was detected in fractions 15–16 (Supplementary figure 3).
SEC analysis of EVs isolated using the precipitation method
Next, we further purified the precipitation-isolated EV pellet with SEC (EV-SEC) and compared the protein and particle concentrations in the various fractions to that in the corresponding fractions collected from SEC-purified plasma (plasma-SEC) ()). NTA and the protein concentration were measured separately for each SEC fraction.
Figure 3. (a) A precipitation-based isolation method was evaluated using size-exclusion chromatography (SEC). Plasma from individual rat was divided in two 800 µl aliquots and the first aliquot was analysed with SEC (plasma-SEC). EVs from the second aliquot was first isolated using precipitation-based kit and the EV pellet was further analysed with SEC (EV-SEC). (b) Measurement of the protein concentration in each fraction showed that precipitation isolation removed 85% to 91% of the total plasma proteins. (c) Nanoparticle tracking analysis (NTA) indicated that the total number of particles was comparable in the plasma-SEC and EV-SEC, but the main peak moved towards later fractions in EV-SEC. The figures present four individual rats (biological replicates). Data are expressed as the mean ± standard error of the mean. Black box indicates the EV-rich fractions.
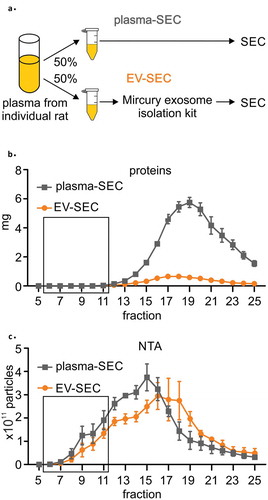
Proteins. The highest protein concentrations were detected in fractions 17–20 in both EV-SEC and plasma-SEC preparations ()). The protein concentration in the presumed EV-rich fractions 7–10 was under the detection limit in both preparations. Interestingly, the total amount of protein in the EV-SEC samples (all protein-containing fractions combined) was only 9% to 15% that in plasma-SEC samples.
NTA. The highest total particle concentration was in fractions 13–18 in both preparations and tended to be higher in later fractions of the EV-SEC preparations ()). The total number of particles in EV-SEC samples (all fractions combined) was 54% to 138% of that in the plasma-SEC samples.
To further analyse the miRNA content of EV-pellet, we combined two adjacent fractions from plasma-SEC and EV-SEC for RNA isolation.
miRNAs. In the EV-SEC samples, the miRNAs were evenly distributed among the fractions. In plasma-SEC preparations, the highest amount of miRNA was detected in the protein-rich fractions, rather than in the fractions with the highest particle number (i.e. NTA peak, )) or in EV-rich fractions 7–10. The total amount of miRNA in the protein-enriched fractions 16–21 in the EV-SEC samples was 51% to 70% of that in the plasma-SEC samples.
Figure 4. A precipitation-based isolation method was evaluated using size-exclusion chromatography (SEC). Plasma was divided in two 800 µl aliquots, and the first aliquot was analysed with SEC (plasma-SEC). EVs from the second aliquot was first isolated using precipitation-based kit and the EV pellet was further analysed with SEC (EV-SEC). RNA was isolated from combined adjacent fractions. The analysis was made for two individual rats (rat A and B). (a) The miRNA concentration peaked in the protein fractions in plasma-SEC, whereas no clear peak was in the EV-SEC. (b) Droplet digital PCR analysis of miR-142-3p showed the highest peaks in the EV fractions (6–11). The total amount of miR-142-3p appeared lower in the EV-SEC fractions. (c) miR-124-3p, (d) miR-23a and (e) miR-122 were found in protein-rich fractions in both plasma-SEC and EV-SEC.
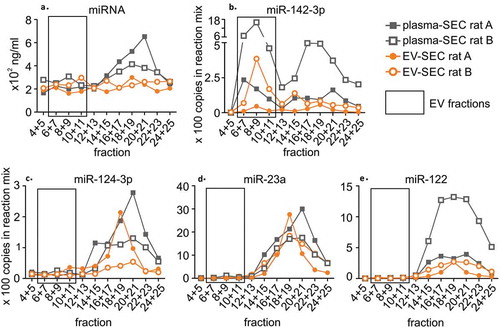
miR-142-3p, miR-124-3p, miR-23a, and miR-122. ddPCR analysis indicated that in both the EV-SEC and plasma-SEC samples, the EV-related miR-142-3p [Citation11] formed two main peaks: fractions 6–11 (presumed EVs) and fractions 16–23 (proteins) ()). Its concentration was lowest in the mid-fractions, which contained the highest particle concentration in the NTA. The total amount of miR-142-3p in the SEC-fractions 6–11 of the EV-SEC samples was 14% to 23% that in the plasma-SEC samples. The precipitation-based method did not enrich miR-142-3p.
The highest amounts of miR-124-3p, miR-23a, and miR-122 were in the protein-rich fractions in both the EV-SEC and plasma-SEC preparations (). In the EV-SEC preparations, the total amount of miR-124-3p was 41% to 51%, miR-23a 56% to 99% and miR-122 21% to 37% that in the plasma-SEC preparations.
Discussion
The present study evaluated the ability of a precipitation-based EV isolation method to remove vesicle-free miRNAs to provide enriched EV cargo-related miRNAs. We had two major findings. First, lipoproteins precipitated with the EV pellet during precipitation isolation. Second, vesicle-free miRNAs were also present in the EV pellet.
Precipitation-based EV-isolation co-precipitates plasma lipoproteins
SEM, TEM and NTA revealed the presence of particles within the EV size range in the precipitation-isolated EV pellet from plasma. SDS-PAGE, however, showed that the precipitation-isolated EV pellet was contaminated with albumin, and Western blot analysis revealed contamination with HDLs.
In plasma, lipoproteins are major contaminating particles that interfere with various EV isolation methodologies [Citation5–Citation7]. HDLs have a density comparable to that of EVs, whereas very low-density lipoproteins and chylomicrons fall into the same size-range as EVs [Citation6,Citation7]. In a recent “Viewpoints” article, Simonsen estimated that one milliliter of plasma contains 107–109 EV particles and up to 1016 lipoprotein particles [Citation7]. Our TEM images of the precipitation-isolated EV pellet revealed particles with a mainly round shape, consistent with a lipoprotein morphology [Citation23,Citation30], and only very few EVs with a distinct cup-shaped morphology [Citation23,Citation28,Citation29], suggesting that the plasma lipoproteins were not removed during precipitation-based EV isolation.
Earlier studies revealed that lipoproteins and larger protein complexes affect particle counts in human plasma samples in NTA [Citation31,Citation32]. Accordingly, our TEM images from SEC fractions with the highest NTA particle concentration showed round lipoprotein-like particles instead of cup-shaped EVs. These data together with the observations of Mork and coworkers, that the NTA particle concentration in platelet-free plasma is reduced by 32% to 72% when lipoproteins are removed by immunoprecipitation, indicate that lipoproteins also contribute to the particle counts measured with NTA.
Finally, we used SEC followed by NTA to compare the particle counts in the precipitation-isolated plasma EV-pellet to that in the original plasma sample. Importantly, the total number of particles was comparable in both samples, providing further evidence that lipoproteins co-precipitate with the EV pellet during precipitation isolation.
Precipitation-based EV isolation co-precipitates plasma miRNAs
Arroyo et al. estimated that 66% of miRNAs elute in the same fractions as proteins in SEC [Citation11]. Further, Turchinovich et al. showed that a majority of plasma miRNA is independent of EVs, and possibly bound to Argonaute-2 protein complexes [Citation14]. Our miRNA profile from plasma-SEC confirmed the finding of Arroyo et al., as the highest amount of total miRNA was detected in the protein-rich fractions, instead of fractions with EVs [Citation11].
Droplet digital PCR detected EV-enriched miR-142-3p in both the EV-rich and protein-rich SEC fractions of rat plasma, comparable to that in human plasma [Citation11]. Interestingly, the amount of miR-142-3p in EVs contained in the EV-SEC fractions was only 14% to 23% compared with that in the EV-containing fractions of whole plasma-SEC, indicating that the precipitation method did not enrich miR-142-3p in the EV pellet.
The other three miRNAs (miR-124-3p, miR-122 and miR-23a) eluted mainly in the protein-rich fractions in both EV-SEC and plasma-SEC derived samples. Thus, the precipitation-based method was not able to remove the protein-co-precipitating miRNAs, i.e. miR-124-3p, miR-122 miR-23a. Interestingly, earlier study used ExoQuick precipitation-based method for isolation of EVs and found increased amount of miR-124 in serum EVs after acute ischemic stroke [Citation26].
Taken together, our data show that a precipitation-based EV isolation method removes only part of the vesicle-free miRNAs, which has implications for interpretating previously published data. For example, a recent comparison of the miRNA contents of plasma and precipitation-isolated EV pellets using a miRNA array indicated that the miRNA profile was comparable between the two preparations [Citation33]. On the other hand, another report showed that EVs carry only a minor proportion of the plasma miRNAs [Citation11]. The data inconsistencies obtained can be explained by poor performance of a precipitation-based method of purifying the EVs and removing vesicle-free miRNAs. Buschmann et al. [Citation22] performed miRNA-sequencing and compared several serum EV-isolation methods, including miRCURY Exosome isolation kit and SEC. MicroRNA content of EVs purified with SEC failed to separate sepsis patients from healthy volunteers, but significant changes were found between the groups with the precipitation method. One discussed explanation to the difference was co-precipitation of non-vesicular miRNA with the precipitation method, which is supported by our data. Further, Van Deun et al. detected Argonaute-2, a protein known to bind miRNAs, in the EV pellet when using precipitation-based ExoQuick method [Citation17]. The presence of Argonaute-bound miRNAs in precipitation-isolated EVs remains to be studied.
Future directions
Precipitation-based EV isolation is appealing in cases with a limited sample volume, such as when analysing EV-related biomarkers in small amounts of rat tail vein plasma. As demonstrated here, however, the precipitated EV fractions also contain lipoproteins and vesicle-free miRNAs. Further analysis with SEC more specifically revealed EV-specific miRNA cargo, but the EV pellet was not completely free from co-precipitated lipoproteins and vesicle-free miRNAs. Therefore, further development of EV isolation methodologies and the identification of markers that reliably indicate the isolation quality are needed. One approach in this direction was recently published by Karimi et al., who combined density-based isolation with SEC and demonstrated improved enrichment of cup-shaped EVs in human plasma samples with a proteomics profile matching that in EVs isolated from cell culture media [Citation6]. Scaling the analysis to a small sample volume, however, remains to be accomplished.
Supplemental Material
Download MS Word (5 MB)Acknowledgments
We thank Joonas Malinen for excellent technical assistance. This study was supported by the Academy of Finland, the Sigrid Juselius Foundation, the European Union’s Seventh Framework Programme (FP7/2007-2013) under grant agreement n°602102 (EPITARGET) and by EATRIS, the European Infrastructure for Translational Medicine, University of Eastern Finland (Biocenter Kuopio) and Biocenter Finland.
Disclosure statement
No potential conflict of interest was reported by the authors.
Supplementary material
Supplemental data for this article can be accessed here.
Additional information
Funding
References
- Yanez-Mo M, Siljander PR, Andreu Z, et al. Biological properties of extracellular vesicles and their physiological functions. J Extracell Vesicles. 2015;4:27066.
- Whiteside TL. The potential of tumor-derived exosomes for noninvasive cancer monitoring. Expert Rev Mol Diagn. 2015;15(10):1293–10.
- Mateescu B, Kowal EJ, van Balkom BW, et al. Obstacles and opportunities in the functional analysis of extracellular vesicle RNA - an ISEV position paper. J Extracell Vesicles. 2017;6(1):1286095.
- Gardiner C, Di Vizio D, Sahoo S, et al. Techniques used for the isolation and characterization of extracellular vesicles: results of a worldwide survey. J Extracell Vesicles. 2016;5:32945.
- Yuana Y, Koning RI, Kuil ME, et al. Cryo-Electron microscopy of extracellular vesicles in fresh plasma. J Extracell Vesicles. 2013;2. eCollection 2013 Dec 31. DOI:10.3402/jev.v2i0.21494
- Karimi N, Cvjetkovic A, Jang SC, et al. Detailed analysis of the plasma extracellular vesicle proteome after separation from lipoproteins. Cell Mol Life Sci. 2018;75:2873–2886.
- Simonsen JB. What are we looking at? Extracellular vesicles, lipoproteins, or both? Circ Res. 2017;121(8):920–922.
- Armand-Labit V, Pradines A. Circulating cell-free microRNAs as clinical cancer biomarkers. Biomol Concepts. 2017;8(2):61–81.
- Correia CN, Nalpas NC, McLoughlin KE, et al. Circulating microRNAs as potential biomarkers of infectious disease. Front Immunol. 2017;8:118.
- Sheinerman KS, Umansky SR. Circulating cell-free microRNA as biomarkers for screening, diagnosis and monitoring of neurodegenerative diseases and other neurologic pathologies. Front Cell Neurosci. 2013;7:150.
- Arroyo JD, Chevillet JR, Kroh EM, et al. Argonaute2 complexes carry a population of circulating microRNAs independent of vesicles in human plasma. Proc Natl Acad Sci USA. 2011;108(12):5003–5008.
- Vickers KC, Palmisano BT, Shoucri BM, et al. MicroRNAs are transported in plasma and delivered to recipient cells by high-density lipoproteins. Nat Cell Biol. 2011;13(4):423–433.
- Wagner J, Riwanto M, Besler C, et al. Characterization of levels and cellular transfer of circulating lipoprotein-bound microRNAs. Arterioscler Thromb Vasc Biol. 2013;33(6):1392–1400.
- Turchinovich A, Weiz L, Langheinz A, et al. Characterization of extracellular circulating microRNA. Nucleic Acids Res. 2011;39(16):7223–7233.
- Stranska R, Gysbrechts L, Wouters J, et al. Comparison of membrane affinity-based method with size-exclusion chromatography for isolation of exosome-like vesicles from human plasma. J Transl Med. 2018;16(1):1–017-1374–6.
- Helwa I, Cai J, Drewry MD, et al. A comparative study of serum exosome isolation using differential ultracentrifugation and three commercial reagents. PLoS One. 2017;12(1):e0170628.
- Van Deun J, Mestdagh P, Sormunen R, et al. The impact of disparate isolation methods for extracellular vesicles on downstream RNA profiling. J Extracell Vesicles. 2014;3. eCollection 2014. DOI:10.3402/jev.v3.24858
- Crossland RE, Norden J, Bibby LA, et al. Evaluation of optimal extracellular vesicle small RNA isolation and qRT-PCR normalisation for serum and urine. J Immunol Methods. 2016;429:39–49.
- Ding M, Wang C, Lu X, et al. Comparison of commercial exosome isolation kits for circulating exosomal microRNA profiling. Anal Bioanal Chem. 2018;410(16):3805–3814.
- Tang YT, Huang YY, Zheng L, et al. Comparison of isolation methods of exosomes and exosomal RNA from cell culture medium and serum. Int J Mol Med. 2017;40(3):834–844.
- Rekker K, Saare M, Roost AM, et al. Comparison of serum exosome isolation methods for microRNA profiling. Clin Biochem. 2014;47(1–2):135–138.
- Buschmann D, Kirchner B, Hermann S, et al. Evaluation of serum extracellular vesicle isolation methods for profiling miRNAs by next-generation sequencing. J Extracell Vesicles. 2018;7(1):1481321.
- Boing AN, van der Pol E, Grootemaat AE, et al. Single-step isolation of extracellular vesicles by size-exclusion chromatography. J Extracell Vesicles. 2014;3. eCollection 2014. DOI:10.3402/jev.v3.23430
- Latham SL, Chaponnier C, Dugina V, et al. Cooperation between beta- and gamma-cytoplasmic actins in the mechanical regulation of endothelial microparticle formation. FASEB J. 2013;27(2):672–683.
- Thery C, Amigorena S, Raposo G, et al. Isolation and characterization of exosomes from cell culture supernatants and biological fluids. Curr Protoc Cell Biol. 2006;30:3.22.1–3.22.29. Chapter 3Unit 3.22.
- Ji Q, Ji Y, Peng J, et al. Increased brain-specific MiR-9 and MiR-124 in the serum exosomes of acute ischemic stroke patients. PLoS One. 2016;11(9):e0163645.
- Lotvall J, Hill AF, Hochberg F, et al. Minimal experimental requirements for definition of extracellular vesicles and their functions: a position statement from the international society for extracellular vesicles. J Extracell Vesicles. 2014;3:26913.
- Lobb RJ, Becker M, Wen SW, et al. Optimized exosome isolation protocol for cell culture supernatant and human plasma. J Extracell Vesicles. 2015;4:27031.
- Jeurissen S, Vergauwen G, Van Deun J, et al. The isolation of morphologically intact and biologically active extracellular vesicles from the secretome of cancer-associated adipose tissue. Cell Adh Migr. 2017;11(2):196–204.
- Yuana Y, Levels J, Grootemaat A, et al. Co-isolation of extracellular vesicles and high-density lipoproteins using density gradient ultracentrifugation. J Extracell Vesicles. 2014;3. eCollection 2014. DOI:10.3402/jev.v3.23262
- Gardiner C, Ferreira YJ, Dragovic RA, et al. Extracellular vesicle sizing and enumeration by nanoparticle tracking analysis. J Extracell Vesicles. 2013;2. eCollection 2013. DOI:10.3402/jev.v2i0.19671
- Mork M, Handberg A, Pedersen S, et al. Prospects and limitations of antibody-mediated clearing of lipoproteins from blood plasma prior to nanoparticle tracking analysis of extracellular vesicles. J Extracell Vesicles. 2017;6(1):1308779.
- Tian F, Shen Y, Chen Z, et al. No significant difference between plasma miRNAs and plasma-derived exosomal miRNAs from healthy people. Biomed Res Int. 2017;2017:1304816.