
 ?Mathematical formulae have been encoded as MathML and are displayed in this HTML version using MathJax in order to improve their display. Uncheck the box to turn MathJax off. This feature requires Javascript. Click on a formula to zoom.
ABSTRACT
Background: NICE in England, and ICER in the US both use cost-utility analyses (CUA) and budget impact analyses (BIA) to assess value for money and affordability, however the thresholds used differ greatly.
Objective: To perform a cross-country comparison of the results of the CUA and BIA and detail the implications for reimbursed price and volumes, for a novel gene therapy for Parkinson’s disease (PD).
Methods: A Markov model was built to perform country-specific CUAs and BIAs
Findings: The US ceiling price identified through CUA is ~ 1.8 times higher than in England (aligning to our previous US/UK price comparison analysis of high-cost drugs). However, the net budget impact corresponding to these price levels would limit number of patients treated in order not to exceed the BIA threshold. Performance-based annuity payments can increase patient access at launch without exceeding the thresholds while reducing payers’ data uncertainty.
Conclusion: Our cost-utility analysis in PD shows a difference in price potential between the US and England that aligns with what is observed in practice for other high-cost drugs. Furthermore, the budget impact threshold operational in England imposes a greater downwards pressure on price and/or volumes than the one applied by ICER in the US.
Introduction and objectives
As healthcare budgets have become increasingly constrained, the need for prioritisation of healthcare resources has become more pressing. Cost-utility and budget impact analyses are two widely adopted methods for assessing value for money and affordability, however, the degree to which they are a formalised part of health technology assessments (HTAs) for the purposes of therapy reimbursement differs greatly between countries.
The cost-utility framework was conceived as a tool to help inform the prioritisation of healthcare resources across different therapy areas, however, its methodological properties continue to be debated among healthcare stakeholders and scholars [Citation1–Citation4]. Despite its methodological imperfections, cost-utility analyses (CUAs) remain a central component of HTAs that inform pricing and reimbursement (P&R) in many countries in the European Union (EU), such as the United Kingdom (UK), Sweden, Belgium, and The Netherlands [Citation1], as well as in Australia [Citation5] and Canada [Citation6]. Furthermore, its use has gradually become more widespread in EU countries where it has historically seen limited use, e.g. France, and Spain [Citation7].
In the UK, the devolved administrations of England, Scotland, Wales and Northern Ireland are in charge of HTA and reimbursement decisions for their respective territories. In England, reimbursement decisions for the majority of novel medicines are typically made based on the recommendations of the HTAs conducted by the National Institute for Health and Care Excellence (NICE). These recommendations are largely driven by CUA, and since NICE’s establishment in 1999, its methodologies have become more rigorous [Citation8–Citation11], making it a reference point for stakeholders doing HTAs and CUAs in other countries as well.
In the United States of America (USA), CUAs have traditionally had little impact on coverage (reimbursement) decisions, and while this continues to be the norm, recent developments reflect a shift in interest towards more value-based approaches to HTAs. This is illustrated by the emergence in recent years of several tools (as described below and summarised in ) to enable payers, clinicians and patients to make better informed decisions [Citation12,Citation13], as well as by the introduction of CUAs to support clinical guideline development [Citation14], drug formulary management by certain health plans [Citation15], and for the assessment of preventive measures by Medicare [Citation16]. Moreover, the independent non-profit Institute for Clinical and Economic Review (ICER) is producing evidence reports using the CUA methodology as a free resource available to any stakeholder interested in evidence-based and cost-effectiveness-driven healthcare decision-making [Citation17].
Table 1. Examples of value-based assessment tools available in the USA.
While the application of the CUA framework in HTAs varies greatly among countries, budget impact analyses, i.e. affordability, are a cornerstone of HTAs everywhere. In 2016 and 2017, NICE (along with NHS England, the national commissioning/payer body for specialised services) in England and ICER in the USA respectively proposed explicit values of overall healthcare system net budget impact that could be considered acceptable [Citation18,Citation19]. In England, this budget impact threshold (also referred to as a ‘budget impact test’) was later adopted as a formal part of the HTA procedure for reimbursement [Citation20,Citation21]. This is the first time that an explicit value has been defined for what is an acceptable increase in healthcare spending for a new health technology in England, and these initiatives have understandably been a subject of a great deal of debate among stakeholders in the healthcare sector [Citation22,Citation23].
Although CUAs and BIAs are considered contentious by many stakeholders, the relevance of these frameworks seems to be increasing, notably in the USA, and they are therefore worth examining in more detail. The objective of this article is to compare the results produced by the CUA and BIA when using the threshold values provided by NICE in England and ICER in the USA, and detail the implications these methodologies have on the potential reimbursed price and volumes, using a novel gene therapy for Parkinson’s disease (PD) as the basis for the comparison.
Background
Value-based assessment in healthcare has a longstanding application in the UK. NICE was set up in 1999, and since 2000 (and through January 2018) it has produced over 500 technology appraisals with the aim to ensure that all National Health Service (NHS) patients have access to the most clinically – and cost-effective treatments available [Citation24,Citation25]. The recommendations from NICE’s technology appraisals inform the reimbursement decisions for the NHS in England, and such evidence-based guidance and advice are intended to help resolve uncertainty about which medicines, treatments, procedures and devices represent the best quality care and which offer the best value for money for the NHS.
In the USA, the situation is quite different. Despite the historically low application of value-based product assessments, recent years have seen an increase in the efforts to develop tools to assess value for money, and the need to adapt the P&R frameworks used for high-cost and high-value medicines. Several tools exist, and some recent examples are listed in .
In the following, we will provide more detail around the frameworks used for cost-utility analyses (CUAs) and budget impact analyses (BIAs), focusing on NICE in England and ICER in the USA.
Cost-utility analysis (CUA)
The cost-utility analysis explores the costs and outcomes (expressed as QALYs), achieved by an intervention, as compared to those achieved with a relevant comparator in a defined target population, to elicit the incremental costs and QALYs of the intervention in question. This approach incorporates both increases in survival time (additional life years) and changes in quality of life (with or without increased survival) into one measure. The incremental cost-effectiveness ratio (Equation 1) compares the incremental costs (i.e. all additional costs incurred by the stakeholder in question in providing the new therapy vs. the standard of careFootnote1 ) and incremental QALYs generated by the novel therapy and the standard of care (SOC) over a lifetime, and expresses this as a cost per additional QALY generated by the new therapy.
Equation 1: the cost-effectiveness ratio as used in cost-utility analyses
England
The National Institute for Health and Care Excellence (NICE) is a national advisory body operating as an executive non-departmental public body. Its role is to provide guidance and support to providers and commissioners (payers) to help improve outcomes for people using the NHS, public health and social care services. NICE’s aim is to be the principal UK source of evidence to support health, public health and social care practice, commissioning and local decision-making, including practical support to help put recommendations into practice. NICE does this by producing recommendations about effective and cost-effective practice in a range of forms, together with services to support their implementation [Citation26].
NICE bases its recommendations for reimbursement of new technologies in the NHS on technology appraisals that use CUAs to determine value for money. NICE generally considers a new therapy to be good value for money (cost-effective) and appropriate for NHS reimbursement if the incremental cost-effectiveness ratio is below the threshold range of £20,000–30,000 per additional QALY [Citation8]. Whether the upper or lower end of that range is applied is driven by how innovative the novel therapy is, and methodological considerations, e.g. whether QoL has been captured adequately, and the degree of uncertainty in the analysis [Citation8]. However, there are situations where a higher cost per additional QALY is accepted: For end-of-life therapies, the willingness to pay per QALY increases to £50,000; for treatments that target very rare diseases (assessed under the Highly Specialised Technologies programme) it increases further and up to a maximum of £300,000 per additional QALY (depending on the magnitude of the QALY gain) [Citation21,Citation27]. This increased willingness to pay is important as it provides developers of therapies for very rare diseases a better chance of recovering the research and development (R&D) and operational costs, despite being disadvantaged in terms of volumes by the limited number of patients in the therapy area.
United States of America
The Institute for Clinical and Economic Review (ICER) is a consensus-led, non-profit, independent organisation that conducts evidence-based reviews of health care interventions in the USA [Citation28]. ICER has developed its framework for value assessment with input from a multi-stakeholder workgroup including the perspectives of patient advocates, clinical societies, life sciences companies, pharmaceutical benefit managers, and insurers [Citation29]. The overall goal of the ICER value framework is to enable sustainable access to high-value care for all patients, and a key component of the assessment of long-term value for money is the estimated incremental cost-effectiveness, measured through a CUA.
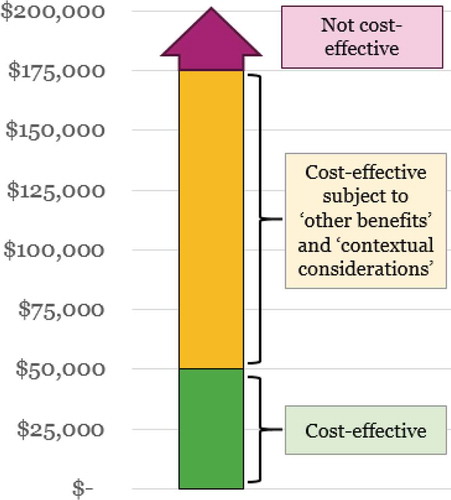
Similarly to the ACC/AHA guidelines (and Premera Blue Cross), ICER uses the WHO’s recommendation for using three times the GDP per person as a benchmark to estimate an acceptable cost per additional QALY gained, and the following thresholds for cost per QALY are used in ICER’s assessments (and as illustrated in ):
<$50,000/QALY: High value, considered cost-effective with no need for further vote or deliberation
$50,000-$175,000/QALY: Can be considered cost-effective and long-term value for money (subject to committee vote) if ‘contextual considerations’ and ‘other benefits and disadvantages’ exist (see below and ) that contribute to the long-term value
>$175,000/QALY: Low value (not considered cost-effective)
Table 2. ‘Contextual considerations’ and ‘Other Benefits or Disadvantages’ as considered in ICER’s value assessment framework.
Figure 1. Threshold values used for cost per incremental QALY in ICER’s value assessment framework.
When ICER’s independent assessment committee decides on the long-term value for money, they consider also ‘Other benefits and disadvantages’, and ‘Contextual considerations’. While the ‘Other benefits and disadvantages’ focus on the outcomes for the patient and caregivers, etc., the ‘Contextual Considerations’ focus more on disease burden, unmet need in the therapy area, and the uncertainty surrounding the long-term safety and efficacy. ICER seeks input on these additional components from all stakeholders, especially patients and patient groups. This process culminates in a vote where each committee member votes yes, no, or uncertain on each of the statements shown in [Citation19].
In ultra-rare indications (i.e. where the treatment is envisaged for a population of less than 10,000 US patients, or ~ 3/100,000), ICER’s value assessment framework allows the voting committee the discretion to accept a higher cost per additional QALY than $175,000, and gives greater weight to ‘other benefits’ and ‘contextual considerations’ [Citation30].
Budget impact analyses (BIA)
While the CUA examines the differences in the lifetime costs and QALYs generated by treatment options in the comparison, the budget impact analysis (BIA) is solely concerned with the changes in healthcare costs. Most commonly, the time horizon for the BIA is short-term, e.g. one year or budget cycle, however, it sometimes also goes up to five years [Citation31].
One important difference between the CUA and the BIA is with regards to how the incremental QALYs impact the results. Commonly, when CUA is used to determine reimbursed price potential for a novel therapy, manufacturers seek to maximise price potential by capitalising on the value of both the incremental QALYs and the displaced healthcare costs as compared to the SOC. In the CUA, the additional QALYs are value-drivers, and are monetised according to the stated willingness to pay per additional QALY (i.e. the thresholds for an acceptable cost per additional QALY). In the BIA, however, the value of the additional QALYs generated by the new therapy has a detrimental impact on the budget, as the corresponding price ‘premium’ increases the cost differential between the novel therapy and the SOC. This means that the therapies with higher QALY gains vs. the SOC have a greater price potential which results in greater budget impact (assuming all other healthcare costs remain the same).
In the below, we detail how NICE in England and ICER in the USA have defined levels of budget impact that these organisations deem reasonable.
England
In April 2017, NICE and NHS England introduced a net budget impact threshold (labelled as a ‘test’) in England, in order to tackle the discrepancies between the prices deemed cost-effective on a per-patient basis, and the aggregate impact high-cost therapies have on the NHS budget. The threshold is considered to have been exceeded if the expected annual net budget impact in any of the first three years on the market is higher than £20 million. Any therapy that is expected to exceed this value is subject to additional commercial negotiations, and potentially a ‘phased’ introduction, to help manage the budget impact [Citation21,Citation32].
This net budget impact threshold now applies to all technology appraisals performed by NICE, and thereby become a mandatory feature of reimbursement and access in England. Although NICE has stated that the £20-million value is ‘not necessarily the maximum amount that the NHS would commit to funding a new technology in any one financial year’ [Citation18,Citation20], it becomes a key requirement for manufacturers to consider and comply with when launching a new therapy in England.
United States of America
In the USA, overall budget impact for the healthcare system does not drive price and access the way it does in the UK. However, ICER has introduced a potential budget impact threshold in its HTAs that is meant to address the question around affordability of introducing the new therapy for the USA as a whole.
ICER’s potential budget impact threshold is calculated using World Bank GDP growth estimates (+ 1%) to adjust the annual spending on drugs in the US, in order to estimate the overall annual growth in drug spending ($15.3 billion for 2017). This estimated overall growth in spending is then divided by the estimated number of new market entrants (33.5 in 2017, as per FDA data) to calculate the potential threshold for annual net budget impact per drug launched: $457.5 million (in 2017) [Citation19].
It should be noted that ICER’s potential budget impact threshold does not hold any direct bearing on reimbursement (coverage) decisions in the US, but that it is used as an additional consideration in the value assessment performed by ICER.
Methods
The CUA and BIA in our example were calculated using a cohort-based state transition Markov model constructed in TreeAge Pro™ 2017 to compare the novel gene therapy to the SOC. The model structure reflects the disease trajectory for the target patient population and is designed to capture the incremental costs and outcomes (QALYs) accrued over time.
The determination of the reimbursed price potential is based on reaching, but not exceeding, the incremental cost-effectiveness ratio thresholds in England and the US respectively, as calculated through the CUA (see Equation 1). This means that the reimbursed price potential calculated through this approach reflects the maximum justified under the respective thresholds.
Model features
Key features of the Markov model are detailed in .
Table 3. Key features of the Markov model used.
For England, we use the upper end of NICE’s cost-effectiveness range (£30,000 per QALY) as innovative therapies are more likely to qualify for this, provided that QoL has been captured adequately and degree of uncertainty in the cost-effectiveness outcome is low (informed by the NICE methods for technology appraisal [Citation8]).
For the US analysis, we adopt a moderate willingness to pay of $100,000. This threshold level for the incremental cost-effectiveness ratio was chosen based on the ‘Other Benefits or Disadvantages’ and ‘Contextual Considerations’ from the ICER’s value assessment framework [Citation19]. While the willingness to pay threshold in the assessment of a novel gene therapy in PD could be driven upwards by considerations such as improvements in caregiver burden, ability to return to work, and representing a novel treatment option, other considerations would likely limit the willingness to pay per QALY, e.g. the availability of other treatment options in advanced PD, the fact that it is not an acutely life-threatening disease, and that there will likely be uncertainty around the safety and efficacy of the therapy at launch.
Model structure
The Markov model was structured using health states defined by patients’ underlying disease severity (as measured by the Hoehn & Yahr [H&Y] score) and sub-states for their level of symptom control (as measured by the proportion of waking hours spent in the ‘off’ state). The choice of structure is informed by a number of cost-utility studies performed in PD [Citation33–Citation37], as well as Abbvie’s submission for Duodopa to the Scottish Medicines Consortium in Scotland (which was accepted for reimbursement for PD patients with severe motor fluctuations and hyper-/dyskinesia when available combinations of Parkinson medicinal products have not given satisfactory results) [Citation38].
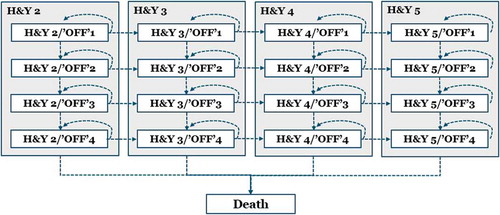
illustrates how patients transit through the different health states in the model, i.e. either remain in the health state they are in, or deteriorate on either the H&Y dimension or in terms of the time spent in the ‘off’ state. Every health state in the model can transit to ‘Death’.
Figure 2. Health states and transitions in the health economic model.
‘OFF’1: 0–25% of waking hours spent in ‘off’ state‘OFF’2: 25–50% of waking hours spent in ‘off’ state‘OFF’3: 50–75% of waking hours spent in ‘off’ state‘OFF’4: > 75% of waking hours spent in ‘off’ state
Patient baseline and efficacy scenarios
The transition from H&Y2 to H&Y3 is considered to be the transition into a more advanced PD state [Citation39], and the patients with the greatest proportion of time spent in the ‘off’ state are considered very poorly controlled on the standard of care, and therefore more likely to be considered candidates for a novel gene therapy.
Our CUA and BIA therefore focus on patients with a baseline of H&Y3 and who also spend more than 75% of their waking hours in the ‘off’ state, i.e. their PD medicines provide only a very limited degree of control of their Parkinsonian symptoms. It should be noted that given the early development stage of this gene therapy for Parkinson’s disease, the efficacy scenarios described in reflect aspirational claims around therapeutic positioning and benefit. The sustainability of effect was assumed to be five years for the gene therapy in both efficacy scenarios.
Table 4. Patient baseline and efficacy scenarios.
Comparator
Due to a lack of clearly defined treatment algorithms in clinical guidelines [Citation40–Citation42], PD patients may be treated with a variety of drugs (e.g. dopamine agonists, levodopa, monoamine oxidase-B inhibitors, COMT inhibitors or Amantadine) and devices (e.g. deep brain stimulation or Duodopa pumps). The timing and choice of therapy is driven by the patient’s individual circumstances, meaning it is not possible to precisely define the standard of care (SOC) as a single therapy. This fact is reflected in several published health economic analyses, where the treatment in the comparator arm is commonly a homogeneous group of treatments referred to as SOC or best medical therapy [Citation33–Citation37,Citation43–Citation46]. Therefore, given the lack of a single clearly defined SOC per disease stage, we apply the available groupings of therapeutic options for a given SOC and the associated clinical and economic outcomes.
Model inputs
The following assumptions have been made regarding the model inputs:
The impact on healthcare costs, and quality of life (QoL) utility are based on the relevant H&Y stage, and the proportion of waking time spent in the ‘OFF’ state
Mortality is driven by the H&Y score and age (not ‘off’ state)
We assume that probability of death or complications in a given cycle is specific to that health state and is not affected by what happened in previous cycles
Patients can only deteriorate on either ‘OFF’ or H&Y stage per six-month cycle (not both)
Costs and quality of life (QoL) utilities
The health state-specific costs applied in the model are UK specific and derived from McCrone (2009) [Citation47] and Lowin et al. (2011) [Citation33], and inflated to £2015 using the Health Service Cost Indices [Citation48]. When adapting the model to the US analysis, these costs were inflated using the Organisation for Economic Co-operation and Development’s (OECD) most recent (2014) purchasing power parity conversion factor for health costs [Citation49].
Health state-specific utilities were generated based on data from Palmer et al. (2000) [Citation50] and Walter & Odin (2015) [Citation37], adjusted for the utility effect of age as per the UK age-matched general population at a given age [Citation51].
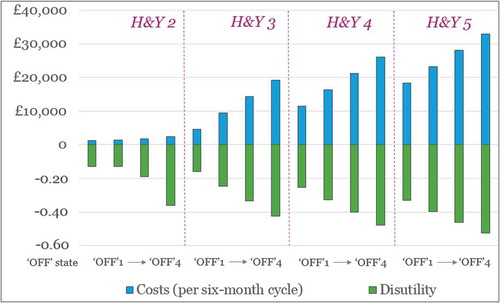
provides an illustration of the (UK) costs and disutilities associated with the different health states in the model.
Figure 3. Graphical illustration of the (UK) costs and disutilities associated with the health states in the model (except deathFootnote2).
Transition probabilities and mortality
The transition probabilities for the standard disease trajectory dictate the proportion of patients deteriorating during each cycle, and were obtained from the cost-effectiveness studies published by Eggington et al. (2014) [Citation35] and Lowin et al. (2011) [Citation33]. Mortality in the model is driven by the age of the patient, adjusted for the mortality effect of the H&Y score, informed by the hazard ratios reported by Liou et al. (2009) [Citation52].
Findings
Potential price implications (using the CUA)
Using the CUA, we explore the potential price implications for the novel gene therapy as illustrated in below. This figure details the estimated maximum cost-effective price potential, and it assumes no uncertainty regarding the incremental value of the therapy over a five-year horizon. However, uncertainty in the supporting data is common for gene therapies at the time of launch, largely due to the claims of sustainability of effect that often extend beyond the trial observation period. In the presence of uncertainty, payers expect price discounts or more sophisticated managed entry agreements in order to minimise payer risk.
Figure 4. Comparison of estimated maximum cost-effective prices for the gene therapy in the US and England, for patients with H&Y3 and > 75% ‘OFF’ time at baseline (assuming five years duration of effect).
* English results are adjusted for the average £-to-$ exchange rate for 2017 (1.29) [Citation68] to allow the comparison (original results shown in GBP in parentheses)
![Figure 4. Comparison of estimated maximum cost-effective prices for the gene therapy in the US and England, for patients with H&Y3 and > 75% ‘OFF’ time at baseline (assuming five years duration of effect).* English results are adjusted for the average £-to-$ exchange rate for 2017 (1.29) [Citation68] to allow the comparison (original results shown in GBP in parentheses)](/cms/asset/fff5b11b-7cda-45ae-9ef0-16f7f2b9b2a9/zjma_a_1500419_f0004_oc.jpg)
It is worth noting the modest uplift in price potential between the symptomatic and disease-modifying improvement scenarios. This is driven by the limited difference in costs and QoL when comparing the H&Y3/’OFF1ʹ and H&Y2/’OFF1ʹ health states (see ). The majority of the potential product value (from a CUA perspective) for patients with a H&Y3/’OFF4ʹ baseline is therefore driven by improvements in time spent in the ‘off’ state rather than a further improvement in H&Y score.
The US results are substantially higher than the English results: 1.75 and 1.83 times higher for the symptomatic and disease-modifying scenarios respectively. These differences are driven by the higher costs of the SOC as compared to England, as well as the higher willingness to pay (WTP) per QALY ($100k in the US vs. ~$40k [£30k] in England). This difference would have been even more pronounced if a higher WTP threshold had been applied in the US analysis (‘Other Benefits’ and ‘Contextual Considerations’ may justify a WTP up to $175k).
Potential access implications (using the BIA)
Using the maximum cost-effective prices identified for the gene therapy in the CUA above, we explore the potential access implications of the budget impact thresholds applied by NICE in the England and proposed by ICER in the US.
As stated above, the maximum cost-effective price potential calculated here represents the ceiling price according to the CUA framework because it is based on reaching, but not exceeding, the incremental cost-effectiveness ratio thresholds in England and the USA, and assuming no uncertainty regarding the therapy performance. However, in real life, dealing with data uncertainty is a common HTA challenge especially for therapies that make claims that extend beyond the clinical trial data available at launch (this is particularly pertinent for one-off gene therapies that have the potential to provide long-term patient benefits). In a previous publication [Citation53], we have shown how performance-based annuity payments (rather than full upfront payments) can be an effective way to reduce payer uncertainty, while improving affordability and patient access to innovative gene therapies at launch. In the following BIA, we show how the number of patients eligible for treatment without exceeding the budget impact thresholds differs according to the payment approach used.
In the left half of , we depict the estimated English net budget impact in year one of introducing the novel gene therapy for patients with an H&Y score of 3 and > 75% ‘Off’ time at baseline. Although the annual cost for patients on the SOC is considerable (nearly £29,000), commanding a full upfront payment for the novel gene therapy creates a substantial budget impact in year one, in the region of £182k-£227 per patient treated. A net budget impact of this magnitude corresponds to a patient volume of around 90 to 110 in that same year without exceeding the budget impact threshold (or up to around 440–550 over a five-year period, as illustrated by the numbers in brackets above).
Figure 5. Maximum number of English patients eligible for treatment in year one according to the max prices identified* for patients with H&Y3/’OFF’4 at baseline and the £20-million budget impact threshold.
* £198,556 per patient for partial response; £250,264 per patient for optimal response** £39,711 per patient (£198,556/5 years) for partial response; £50,053 per patient (£250,264/5 years) for optimal response*** Over five years^ Maximum number of patients in years one through five (as the annuity payments are split over five years)
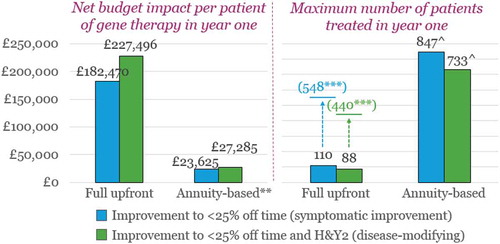
Performance-based annuity payments dramatically reduce the budget impact in year one (to £23-£27k per patient) in England, as compared to a full upfront payment, by dividing the cost of the gene therapy over five years (the claimed duration of effect). This reduction in annual net budget impact allows between ~ 730–850 patients (depending on the level of improvement) in England to be treated in year one (through year five) without triggering the net budget impact threshold. It is important to note, that although this is the maximum number of patients that can be treated over the five years of claimed benefit, this number of patients is considerably higher than what would be the case over five years using a full upfront payment, as is highlighted by the numbers in brackets (around 440–550).
However, if we compare this to the potential target population, it is clear that further concessions in terms of price would be needed to enable broader access. Prevalence estimates suggest that the total 2018 UK PD population is in the region of 160,000 [Citation54], and if we adjust this for the number of people living in England (54 million vs. 66 million), the corresponding prevalence estimate is around 130,000. Key opinion leader (KOL) clinician input indicates that around 10% of the total PD population have advanced disease and are poorly controlled on the existing SOC, meaning that in England, the total potential target population might be in the region of 13,000. The results of the BIA above correspond to less than 7% of these patients, meaning that an effort would likely need to be made to consider price concessions and/or potentially a ‘phased’ introduction and/or targeting a PD subpopulation of higher unmet need.
A similar pattern is observed in the US analysis, as shown in . The net budget impact in year one drops substantially when annuity-based payments are used rather than full upfront payments.
Figure 6. Maximum number of US patients eligible for treatment in year one according to the max prices identified* for patients with H&Y3/’OFF’4 at baseline and the $457.5-million budget impact threshold.
* $448,662 per patient for partial response; $591,662 per patient for optimal response** $ 89,732 per patient ($448,662/5 years) for partial response; $118,332 per patient ($591,662/5 years) for optimal response*** Over five years^ Maximum number of patients in years one through five (as annuity payments are split over five years)
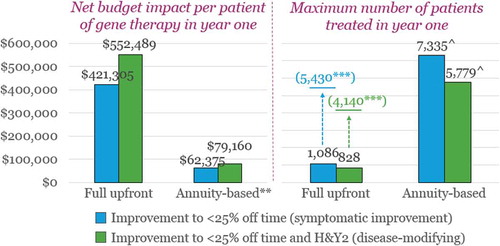
Similarly as in the English example above, the number of patients that can be treated in the USA over a five-year period (without exceeding the proposed net budget impact threshold) is also substantially higher when using performance-based annuity payments than under a full upfront payment: around 5,800–7,300 patients vs. 4,100–5,400 patients.
However, when considering the estimated total US target population, it is again evident that price concessions would have to be made in order to access more patients without exceeding ICER’s threshold. The estimated 2018 total US PD population is around 800,000 [Citation55], and using the same KOL estimate of the proportion of all PD patients who are advanced and poorly controlled, we get an estimated target population in the region of 80,000. In this context, the results of the BIA mean that less than 9% of the US target population could be treated annually without exceeding the threshold.
Another point worth noting is the higher number of patients as compared to the English results in . If we adjust the US threshold for differences in population size (54 million in England vs. 325 million in the US [Citation56,Citation57]) and exchange rate (1.29 as applied above), the net budget impact threshold suggested by ICER in the US corresponds to an English equivalent of approximately ~£59 million per year; this is ~ 3 times higher than the net budget impact threshold applied by NICE and NHS England. In other words, the proposed net budget impact threshold in the USA is far higher both in absolute terms and in relation to the population size.
Discussion
In our example, we explore the value and access potential of a novel gene therapy for Parkinson’s disease, by testing different aspirational product performance scenarios, using the CUA and BIA framework as per the threshold values outlined by NICE in England and ICER in the USA. Overall, the results of the CUA illustrate the substantial value potential for a new PD therapy that robustly demonstrates improvements in morbidity and QoL in PD patients, as well as providing benefits to the healthcare system through reduction of healthcare resource utilisation. The country-specific analyses illustrate how the higher cost of the SOC, and importantly, the higher willingness to pay per incremental QALY used by the ICER framework in the US, drive substantially higher prices than those derived using the English perspective. It should be noted that the value potential in the USA may be even higher than what is presented in our analysis, as we applied a moderate willingness to pay in our analysis ($100k per additional QALY). A willingness to pay higher than this (but <$175k) is possible, subject to the interpretations of the ‘contextual considerations’ and ‘other benefits and disadvantages’ as used by ICER when determining the appropriate threshold level.
In a previous publication, we have shown that the pharmaceutical prices (as charged by the manufacturer) are on average 1.90 times higher in the US than in the UK for higher-cost drugs [Citation58]. This finding is very much in line with the differential of 1.83 found in our analysis (), and supports the relevance of the CUA framework in estimating US willingness to pay in PD.
In general terms, it should be noted that the results of the CUA are sensitive to how adequately QoL is captured by the utility scores used for the QALY calculation, and this can differ between therapy areas and the QoL instruments used. In our example, the deterioration of PD patients as measured on the H&Y scale and in terms of time spent in the ‘off’ state has a substantial impact on the QoL utilities. In other therapy areas, such as ophthalmology, there are well-established methodological issues in terms of translating patient benefits into QALY improvements, and the recent case of ICER’s assessment of Luxturna illustrates this [Citation59].
The CUA framework is also sensitive to the discount rate used when considering future costs and benefits, as shown in NICE’s exploration of the assessment and appraisal of regenerative medicines [Citation60]. The NICE assessment framework allows a discount rate of 1.5% to be applied (rather than the commonly applied 3.5% rate) in cases where the ‘…treatment restores people who would otherwise die or have a very severely impaired life to full or near full health, and when this is sustained over a very long period’, and where the Appraisal Committee believe that ‘…it is highly likely that, […] the long term health benefits will be achieved’ [Citation60]. However, making the case for the 1.5% discount rate convincingly is challenging, and unlikely to be accepted in the absence of long-term data supporting curative claims, as shown in the assessment of the hypothetical CAR-T therapy for paediatric acute lymphoblastic leukaemia in NICE’s Regenerative Medicine Study [Citation60].
Furthermore, it is worth highlighting that the perspective of the CUA methodology applied in England and the USA is that of the healthcare system and not the wider society. This means that the value of benefits such as ability to go back to work, work productivity, or impact on caregiver burden (e.g. family members) are not fully reflected in the results when using this analytical framework. Also, other scholars have hypothesised that society may value curative therapies more highly than treatments that offer the same ‘total’ benefits through incremental gains (e.g. over many years and/or patients); still, there is little evidence to suggest that a higher willingness to pay exists for this [Citation61]. What is clear, is that this is not a factor that currently drives a higher willingness to pay in the CUA methodologies used by NICE in England, and only to a limited extent by ICER in the US (through ‘Other Benefits and Disadvantages’).
While the value potential identified in our CUA is considerable, the results of the BIA show how the budget impact thresholds in England and the USA apply a substantial downwards pressure on price and/or volume. A finding worth noting is that the threshold proposed by ICER in the USA is far higher than the one applied in England, both in absolute terms and in relation to the total population of these countries. ICER’s proposed budget impact threshold allows approximately three times more patients access when seen in relation to the total US population, than the threshold applied in England. This finding may be reflective of the fact that ICER is consensus-driven, and therefore may be more likely to weigh in the patient and industry perspectives, than the English budget impact threshold, which is payer-led. Regardless, it means that the threshold applied in England applies a greater downwards pressure on price and/or volume than the threshold proposed by ICER in the USA.
For manufacturers of highly innovative treatments that provide long-term savings and substantial QALY gains (and therefore can justify a higher cost-effective price through the CUA framework), a key challenge is to ensure that the budget impact, especially short-term, is not of a magnitude that is detrimental to product adoption. High-value, one-off treatments that command a full upfront payment are disadvantaged by the BIA, as their long-term value is concentrated in one upfront payment, rather than in payments spread over time. In situations like these, payers have commonly sought price concessions to account for any uncertainty around the longer-term real life benefit of a one-off therapy. Collecting real-world data through registries post-launch (which is sometimes a regulatory requirement for cell and gene therapies) is one possible means to reduce this uncertainty without compromising the value of the therapy, although payers generally perceive real-world data as less convincing evidence (as compared to randomised control trial data), due to the increased risk of bias from confounders [Citation61]. But importantly, it does not deal with the budget impact concerns from charging the full price upfront.
We argue that performance-based annuity payments should be considered in situations like this. Our previous analysis of the UK budget impact ‘test’ [Citation53] showed that adopting such payment schemes can substantially reduce both payer uncertainty around longer-term real-world benefits, as well as the annual net budget impact in the first three years after launch (i.e. the time horizon of the budget impact ‘test’). Performance-based annuity payments can thus be a vehicle to increase patient access as compared to charging a full payment upfront for the therapy. This can be particularly useful in indications where there is a large proportion of prevalent patients. In such cases, performance-based annuity payments can provide budgetary room for decision-makers to treat more of the prevalent population when the new therapy is introduced, and then focus on the incident population in subsequent years. Still, when considering the prevalence estimates for advanced and poorly controlled PD in England and the US, it is clear that further reductions in price are required in order to access the broader population without exceeding the budget impact thresholds longer term (e.g. beyond the three-year horizon used in the UK framework).
From a US perspective, the budget impact threshold proposed by ICER is an interesting development that has merit in terms of analysing trends in pharmaceutical spending on a healthcare system level. However, achieving a widespread adoption among US decision-makers for the purposes of making individual coverage decisions is challenging. A key reason for this is the fact that the US healthcare market is comprised of multiple payers, for whom the budget impact on a macro level is less relevant when they are making coverage decisions. A threshold like the one ICER has proposed is better suited in single-payer systems, where the payer’s budget impact by and large reflects the budget impact of the healthcare system. To some extent, one could argue that certain patient populations could be considered as covered by a one-payer system even in the US, e.g. patients over the age of 65, the vast majority of which are covered through Medicare. This would largely be the case for the advanced PD population, however, unless the scope of the budget impact threshold is changed to fit the remit of individual payers (e.g. a Medicare-specific budget impact threshold), its impact on coverage decisions will likely remain limited.
A second, and more hypothetical scenario, where one could consider a single-payer situation in the US is where a federal risk-pooling (carve out) mechanism is introduced. This would require individual payers to put a certain percent of their member premiums or health care budgets into a dedicated fund for high value medicines, essentially creating a single payer system for such therapies [Citation62]. In this scenario, a budget impact threshold like the one proposed by ICER would be easier to implement.
Finally, an important difference to emphasise between the two countries is that while the CUA and BIA frameworks are integral to the HTA and ultimately inform reimbursement in the NHS in England, these frameworks currently have limited direct implications for price and coverage (reimbursement) decisions in the USA. It is interesting to note that, with the exception of Premera Blue Cross (which uses CUA to inform actual management of its drug formulary), none of the other examples we describe above have any explicitly defined impact on coverage or formulary management of therapies, and are meant purely as complementary tools to aid decision-making.
While survey data is inconclusive at present in terms of the proportion of US payers using the ICER CUA framework [Citation63,Citation64], the emergence of value assessment tools over recent years points to a trend towards a greater interest in assessing value for money, which is supported by an increasing trend in terms of adoption: from 46% intending to use the ICER reports in 2015 to 59% using them in 2016) [Citation64]. It is our belief that the use of CUAs in coverage (reimbursement) decisions in the USA will increase in the future, and although it may not play as integral a role in coverage determinations as it does in England, in the near future, the CUA has compelling properties in terms of informing the prioritisation of scarce healthcare resources, and therefore lends itself well to more widespread use, also in the USA.
Disclosure statement
No potential conflict of interest was reported by the authors.
Additional information
Funding
Notes
1 It is important to note that this is not limited to the cost of the new therapy in isolation, but all additional associated costs, e.g. administration, follow-ups, etc.
2 The ‘Death’ health state has no costs or utility associated with it.
References
- Nuijten MJC, Dubois DJ. Cost-utility analysis: current methodological issues and future perspectives. Front Pharmacol. 2011;2:1.
- Whitehead SJ, Ali S. Health outcomes in economic evaluation: the QALY and utilities. Br Med Bull. 2010;96(1):5–15.
- Nancy McLaughlin, Ong M.K., Tabbush V., et al. Contemporary health care economics: an overview. Neurosurg Focus. 2014;37(5):E2.
- McDonough CM, Tosteson ANA. Measuring preferences for cost-utility analysis: how choice of method may influence decision-making. Pharmaco Economics. 2007;25(2):93–106.
- Taylor C, Jan S. Economic evaluation of medicines. Aust Prescriber. 2017;40(2):76–78.
- Paris V, Belloni A. Value in Pharmaceutical Pricing Country Overview: Canada. 2014 [cited 2018 Feb 15]; Available from: https://www.oecd.org/health/Value-in-Pharmaceutical-Pricing-Canada.pdf.
- Jørgensen J, Kefalas P. Reimbursement of licensed cell and gene therapies across the major European healthcare markets. Journal Market Access Health Policy. 2015;3:10. 3402/jmahp.v3.29321.
- National Institute for Health and Care Excellence (NICE). Guide to the methods of technology appraisal 2013 [PMG9]. 2013 [cited 2015 Nov 12]; Available from: https://www.nice.org.uk/process/pmg9/resources/guide-to-the-methods-of-technology-appraisal-2013-pdf-2007975843781.
- Latimer NR. NICE decision support unit technical support document 14, survival analysis for economicevaluations alongside clinical trials - extrapolation with patient-level data. In: Wailoo, A. (Ed). London: National Institute for Health and Care Excellence (NICE); 2013.
- Claxton, K., Martin S., Soares M., et al. Methods for the estimation of the National Institute for Health and Care Excellence cost-effectiveness threshold. Health Technol Assess. 2015;19(14):1–503, v-vi.
- Sabine Grimm MS, Brennan A, Wailoo A. Framework for analysing risk in health technology assessments and its application to managed entry agreements. 2016; Available from: http://scharr.dept.shef.ac.uk/nicedsu/wp-content/uploads/sites/7/2016/03/DSU-Managed-Access-report-FINAL.pdf.
- National Comprehensive Cancer Network (NCCN). NCCN Clinical Practice Guidelines in Oncology (NCCN Guidelines®) with NCCN Evidence Blocks™. [cited 2018 Feb 12]; Available from: https://www.nccn.org/evidenceblocks/.
- Memorial Sloan Kettering Cancer Center (Drug Pricing Lab). Drug Abacus. 2018 [cited 2018 Feb 12]; Available from: https://drugpricinglab.org/tools/drug-abacus/.
- Anderson, J.L., Heidenreich P.A., Barnett P.G., et al. ACC/AHA statement on cost/value methodology in clinical practice guidelines and performance measures: a report of the American College of Cardiology/American Heart Association Task Force on Performance Measures and Task Force on Practice Guidelines. J Am Coll Cardiol. 2014;63(21):2304–2322.
- Yeung, K., Basu A., Hansen R.N., et al. Impact of a value-based formulary on medication utilization, health services utilization, and expenditures. Med Care. 2017;55(2):191–198.
- Chambers JD, Cangelosi MJ, Neumann PJ. Medicare’s use of cost-effectiveness analysis for prevention (but not for treatment). Health Policy. 2015;119(2):156–163.
- Institute for clinical and economic review (ICER). Materials. 2018 [cited 2018 Feb 7]; Available from: https://icer-review.org/materials/.
- National Institute for Health and Care Excellence (NICE) and NHS England. Proposals for changes to the arrangements for evaluating and funding drugs and other health technologies appraised through NICE’s technology appraisal and highly specialised technologies programmes. 2016 [cited 2017 Mar 31]; Available from: https://www.nice.org.uk/Media/Default/About/what-we-do/our-programmes/technology-appraisals/NICE_NHSE_TA_and_HST_consultation_document.PDF.
- Institute for clinical and economic review (ICER). Overview of the ICER value assessment framework and update for 2017–2019. 2017 [cited 2018 Jun 15]; Available from: https://icer-review.org/wp-content/uploads/2017/06/ICER-value-assessment-framework-Updated-050818.pdf.
- National institute for Health and Care Excellence (NICE). NICE and NHS England consultation on changes to the arrangements for evaluating and funding drugs and other health technologies assessed through NICE’s technology appraisal and highly specialised technologies programmes (Reference: 17/029). 2017 [cited 2017 Mar 31]; Available from: https://www.nice.org.uk/Media/Default/Get-involved/Meetings-In-Public/Public-board-meetings/agenda-and-papers-mar-17.pdf.
- National Institute for Health and Care Excellence (NICE). NICE gets go-ahead to fast-track more drug approvals. 2017 [cited 2017 Apr 3]; Available from: https://www.nice.org.uk/news/article/nice-gets-go-ahead-to-fast-track-more-drug-approvals.
- Bodkin H, Big pharma sues drugs watchdog over medicines price cap, in The Telegraph. 2017.
- Ogden J. How will NICE’s budget impact test affect new drug availability?. Prescriber. 2017;28(8):9–12.
- National institute for Health and Care Excellence (NICE). Summary of decisions. 2018 [cited 2018 Feb 12]; Available from: https://www.nice.org.uk/about/what-we-do/our-programmes/nice-guidance/nice-technology-appraisal-guidance/summary-of-decisions.
- National institute for Health and Care Excellence (NICE). Who we are. [cited 2018 Feb 13]; Available from: https://www.nice.org.uk/about/who-we-are.
- NICE Triennial Review Team, Assurance Division, Group Operations, Department of Health. Report of the triennial review of the national institute for health and care excellence. 2015 [cited 2018 Feb 13]; Available from: https://www.gov.uk/government/uploads/system/uploads/attachment_data/file/447317/NICE_Triennial_Review_Report.pdf.
- National institute for Health and Care Excellence (NICE). Interim process and methods of the highly specialised technologies programme updated to reflect 2017 changes - process for the evaluation of highly specialised technologies. 2017 [cited 2017 May 9]; Available from: https://www.nice.org.uk/Media/Default/About/what-we-do/NICE-guidance/NICE-highly-specialised-technologies-guidance/HST-interim-methods-process-guide-may-17.pdf.
- Institute for clinical and economic review (ICER). How we do our work. [cited 2018 Feb 13]; Available from: https://icer-review.org/methodology/icers-methods/.
- Institute for clinical and economic review (ICER). ICER value assessment framework. [cited 2018 Feb 13]; Available from: https://icer-review.org/methodology/icers-methods/icer-value-assessment-framework/.
- Institute for clinical and economic review (ICER). Modifications to the ICER value assessment framework for treatments for ultra‐rare diseases. 2017 [cited 2018 Feb 6]; Available from: https://icer-review.org/wp-content/uploads/2017/11/ICER-Adaptations-of-Value-Framework-for-Rare-Diseases.pdf.
- National Institute for Health and Care Excellence (NICE). Assessing cost impact - Methods guide. 2011 [cited 2016 Aug 25]; Available from: https://www.nice.org.uk/Media/Default/About/what-we-do/Into-practice/Costing_Manual_update_050811.pdf.
- National Institute for Health and Care Excellence (NICE). Technology appraisal and highly specialised technologies programmes - procedure for varying the funding requirement to take account of net budget impact. 2017 [cited 2017 Apr 3]; Available from: https://www.nice.org.uk/Media/Default/About/what-we-do/NICE-guidance/NICE-technology-appraisals/TA-HST-procedure-varying-the-funding-direction.pdf.
- Lowin, J., Bergman A., Chaudhuri K.R., et al. A cost-effectiveness analysis of levodopa/carbidopa intestinal gel compared to standard care in late stage Parkinson’s disease in the UK. J Med Econ. 2011;14(5):584–593.
- Dams, J., Siebert U., Bornschein B., et al. Cost-effectiveness of deep brain stimulation in patients with Parkinson’s disease. Move Disord. 2013;28(6):763–771.
- Eggington, S., Valldeoriola F., Chaudhuri K.R., et al. The cost-effectiveness of deep brain stimulation in combination with best medical therapy, versus best medical therapy alone, in advanced Parkinson’s disease. J Neurol. 2014;261(1):106–116.
- Findley, L.J., Lees A., Apajasalo M., et al. Cost-effectiveness of levodopa/carbidopa/entacapone (Stalevo) compared to standard care in UK Parkinson’s disease patients with wearing-off. Curr Med Res Opin. 2005;21(7):1005–1014.
- Walter E, Odin P. Cost-effectiveness of continuous subcutaneous apomorphine in the treatment of Parkinson’s disease in the UK and Germany. J Med Econ. 2015;18(2):155–165.
- Scottish Medicines Consortium (SMC). co-careldopa-levodopa (Duodopa). 2016 [cited 2018 Feb 13]; Available from: https://www.scottishmedicines.org.uk/files/advice/DAD_co-careldopa_2nd_Resubmission_FINAL_May_2016_for_website.pdf.
- Krüger, R., Klucken J., Weiss D., et al. Classification of advanced stages of Parkinson’s disease: translation into stratified treatments. J Neural Transm. 2017;124(8):1015–1027.
- National Institute for Health and Care Excellence (NICE). Parkinson’s disease in adults (NG71). 2017 [cited 2018 Feb 15]; Available from: https://www.nice.org.uk/guidance/ng71/resources/parkinsons-disease-in-adults-pdf-1837629189061.
- Scottish Intercollegiate Guidelines Network (SIGN). Diagnosis and pharmacological management of Parkinson’s disease - A national clinical guideline (113). 2010 [cited 2016 Jul 5]; Available from: http://www.sign.ac.uk/pdf/sign113.pdf.
- NHS Dudley Joint Medicines Formulary. Parkinson’s Disease Prescribing Guidelines for use in Primary and Secondary Care. 2015 [cited 2016 Jul 5]; Available from: http://www.dudleyformulary.nhs.uk/page/20/guidelines.
- Hjelmgren, J., Ghatnekar O., Reimer J., et al. Estimating the value of novel interventions for Parkinson’s disease: an early decision-making model with application to dopamine cell replacement. Parkinsonism Relat Disord. 2006;12(7):443–452.
- McIntosh, E., Gray A., Daniels J., et al. Cost-utility analysis of deep brain stimulation surgery plus best medical therapy versus best medical therapy in patients with Parkinson’s: economic evaluation alongside the PD SURG trial. Mov Disord. 2016;31(8):1173–1182. doi: 10.1002/mds.26423. .
- Nuijten, M.J., van Iperen P., Palmer C., et al. Cost-effectiveness analysis of entacapone in Parkinson’s disease: a Markov process analysis.Value Health. 2001;4(4):316–328.
- Palmer, C.S., Nuijten M.J., Schmier J.K., et al. Cost effectiveness of treatment of Parkinson’s disease with entacapone in the USA. Pharmacoeconomics. 2002;20(9):617–628.
- McCrone P. Capturing the costs of end-of-life care: comparisons of multiple sclerosis, Parkinson’s disease, and dementia. J Pain Symptom Manage. 2009;38(1):62–67.
- Department of Health. Health service cost index - annual summaries 2006–2015. 2006–2016 [cited 2016 Feb 17]; Available from: www.info.doh.gov.uk.
- Organisation for Economic Co-operation and Development (OECD). 2014 PPP Benchmark results. 2017 [cited 2018 Feb 5]; Available from: https://stats.oecd.org/Index.aspx?DataSetCode=PPP2014.
- Palmer, C.S., Schmier J.K., Snyder E., et al. Patient preferences and utilities for ‘off-time’ outcomes in the treatment of Parkinson’s disease. Qual Life Res. 2000;9(7):819–827.
- EuroQol Group. How to report - UK population sample by age/sex. [cited 2015 Nov 9]; Table quoting data from P. Kind, G. Hardman and S. Macran. UK Population norms for EQ-5D York Centre for Health Economics Discussion Paper pp. 172. 1999. Available from: http://www.euroqol.org/about-eq-5d/how-to-use-eq-5d/how-to-report.html.
- Liou, H.H., Wu C.Y., Chiu Y.H., et al. Mortality of Parkinson’s disease by Hoehn-Yahr stage from community-based and clinic series [Keelung Community-based Integrated Screening (KCIS) no. 17)]. J Eval Clin Pract. 2009;15(4):587–591.
- Jørgensen J, Kefalas P. Annuity payments can increase patient access to innovative cell and gene therapies under England’s net budget impact test. Journal Market Access Health Policy. 2017;5(1):1355203.
- Parkinson’s UK. Parkinson’s prevalence in the UK. 2009 [cited 2018 Feb 20]; Available from: https://www.parkinsons.org.uk/sites/default/files/parkinsonsprevalenceuk_0.pdf.
- Kowal, S.L., Dall T.M., Chakrabarti R., et al. The current and projected economic burden of Parkinson’s disease in the USA. Mov Disord. 2013;28(3):311–318.
- Worldometers. UK population. 2018 [cited 2018 Feb 14]; Available from: http://www.worldometers.info/world-population/uk-population/.
- Worldometers. US Population. 2018 [cited 2018]; Available from: http://www.worldometers.info/world-population/us-population/.
- Jørgensen J, Kefalas P. A price comparison of recently launched proprietary pharmaceuticals in the UK and the USA. Journal Market Access Health Policy. 2016;4:10.3402/jmahp.v4.32754.
- Institute for clinical and economic review (ICER). Voretigene Neparvovec for Biallelic RPE65- Mediated Retinal Disease: effectiveness and Value. 2018 [cited 2018 Feb 15]; Available from: http://icer-review.org/wp-content/uploads/2017/06/MWCEPAC_VORETIGENE_EVIDENCE_REPORT_01122018.pdf.
- National institute for Health and Care Excellence (NICE). Exploring the assessment and appraisal of regenerative medicines and cell therapy products. 2016 [cited 2018 Jul 4]; Available from: https://www.nice.org.uk/media/default/about/what-we-do/science%20policy%20and%20research/regenerative-medicine-study-march2016-2.pdf.
- Marsden G, Towse A, Pearson SD, et al. Gene Therapy: understanding the Science, Assessing the Evidence, and Paying for Value. 2017 [cited 2017 Apr 4]; Available from: https://www.ohe.org/publications/gene-therapy-understanding-science-assessing-evidence-and-paying-value.
- Ted Slocomb MW, Haack T, Valluri S, et al. New Payment And Financing Models For Curative Regenerative Medicines. 2017 [cited 2018 Feb 15]; Available from: https://www.hklaw.com/files/Uploads/Documents/Articles/ARM_Curative_Regenerative_IV1707_LRS.pdf.
- Seidman J, Choe SH Most Health Plans Do Not Use Existing Value Frameworks to Make Coverage Decisions. 2016 [cited 2018 Feb 12]; Available from: http://avalere.com/expertise/life-sciences/insights/most-health-plans-do-not-use-value-frameworks-to-make-coverage-decisions.
- Lising A, Drummond M, Barry M, et al. Payers’ Use of Independent Reports in Decision Making – will There Be an ICER Effect?. Value & Outcomes Spotlight 2017 [cited 2018 Feb 14]; Available from: https://www.ispor.org/health-policy_independent-reports_ICER.pdf.
- Slomiany, M., Madhavan P., Kuehn M., et al. Value Frameworks in Oncology: comparative Analysis and Implications to the Pharmaceutical Industry. American Health & Drug Benefits. 2017;10(5):253–260.
- Schnipper, L.E., Davidson, N.E., Wollins, D.S., et al. Updating the American Society of Clinical Oncology Value Framework: revisions and reflections in response to comments received. J Clin Oncol. 2016;34(24):2925–2934.
- Zhao, Y.J., Wee H.L., Chan Y.H., et al. Progression of Parkinson’s disease as evaluated by Hoehn and Yahr stage transition times. Mov Disord. 2010;25(6):710–716.
- OFX. Yearly Average Rates. 2018 [cited 2018 Feb 8]; Available from: https://www.ofx.com/en-gb/forex-news/historical-exchange-rates/yearly-average-rates/.