
Abstract
This study aims to determine the baseline and indicators for greenhouse gas (GHG) emissions and to evaluate the effectiveness of mitigation measures used to reduce GHG emissions in Thai petrochemical plants. The results demonstrate that petrochemical production between 2005 and 2010 had an annual energy requirement in the range of 120,000–170,000 TJ. The proportions of energy consumption for the petrochemical industry's upstream, intermediate and downstream groups were 75%, 14% and 11%, respectively. The amount of GHG emissions from the petrochemical industry during 2005–2010 was approximately 8000 to 12,000 kt CO2 eq./year. This value represents approximately 3% of the total GHG emissions of Thailand. The upstream petrochemical industry accounted for the highest GHG emissions of 62%, whereas the intermediate and downstream groups were responsible for 21% and 17%, respectively. The carbon intensities of the upstream petrochemical products for the olefin and aromatic groups ranged from 1.104 to 1.485 t CO2 eq./t and 0.420 to 1.125 t CO2 eq./t, respectively. For the intermediate and downstream petrochemical products, the carbon intensities ranged from 0.396 to 1.209 t CO2 eq./t and from 0.096 to 0.477, respectively. The likely reason for the decrease in carbon intensity from 2005 to 2010 is that the industry sector implemented measures to improve energy conservation and updated production processes. The most significant potential for GHG emissions reduction was found in fuel conservation measures, steam conservation measures and electricity conservation measures.
1. Introduction
The Kyoto Protocol not only establishes an international roadmap for GHG reductions but also details the significant impacts on the global economy and international trade. The limitations on CO2 emissions have forced participating nations to adjust their patterns of energy supply/demand and their industrial structures (Huang, Lin, & Yang, Citation2010). Industrial activities are highly energy intensive and currently account for 70% of global energy use (Brown, Gambhir, Florin, & Fennell, Citation2012). Approximately 70% of this energy is supplied by fossil fuels, which generate approximately 40% of global CO2 emissions either directly or indirectly. There are two key areas of GHG emissions in the industry sector according to the main categories of GHG emission by sources of The Intergovernmental Panel on Climate Change (IPCC): (1) energy from fuel combustion activities (sector 1A) and (2) industrial processes and product use (sector 2; IPCC, Citation2007). Thus, the industrial sector serves as a starting point for reducing emissions via improvements in the energy efficiency approach (Dong et al., Citation2014). From the beginning, the sectors that have needed to implement measures to reduce GHG emissions have been the chemical and petrochemical industries (sector 2B), the iron and steel industries (sector 2C), and the aluminium (sector 2C) and glass industries (sector 2G; Niramol, Citation2009).
The chemical and petrochemical sector (not including petroleum products derived from refineries, condensate splitters and gas separation plants used for the production of upstream petrochemicals) is the greatest user of industrial energy, accounting for 30% of the industry's total final energy use (final energy is the sum of fuel demand (for fuel and feedstock purposes) and steam and electricity use) or 5% of the world's emissions. This sector is confronted with the challenge of conserving energy primarily for economic and environmental reasons (Saygin, Patel, Worrell, Tam, & Gielen, Citation2011). Such industries are also ranked second in the world for energy demand in production. These factors point to the petrochemical industry as a sector that is likely to be emphasized in international mitigation measures for voluntary GHG reduction under the sectoral approach mechanism (World Resources Institute [WRI], Herzog, Citation2009). The options for reducing direct emissions from industry are highly variable. The key categories for technology development in the abatement of industrial CO2 emissions are energy-efficient technologies, fuel and raw material switching, lifecycle changes and recycling, carbon capture and storage and other novel technologies (International Energy Association [IEA], Citation2009). Many studies have been undertaken to investigate energy consumption, emissions reduction and energy efficiency improvements in the chemical and petrochemical sector (Chen and Hu, Citation2012; Gielen, Moriguchi, & Yagita, Citation2002; Neelis, Patel, Blok, & Bach, Citation2002; Neelis, Worrell, & Masanet, Citation2008; Saygin, Patel, Worrell, Tam, & Gielen, Citation2011). Energy-efficient technologies for best available technology (BAT) processes in the chemical industry could contribute significantly to energy savings of 10–50% and to reductions in CO2 emissions (Neelis et al., Citation2002). Chen and Hu (Citation2012) reported that the Taiwan petrochemical industry achieved a 2.65 Mt CO2 reduction (49% reduction) via decreased steam and oil use (Chen and Hu, Citation2012).
The significant sources of GHG emissions in Thailand are the energy and industrial sectors, with GHGs from industry producing approximately 43.98 million tonnes or 22.7% of overall GHG emissions (JGSEE, Citation2010). The value of the petrochemical industry in Thailand is ranked in the top five in the Asian region and has had a historical growth rate of 5–12% per year since 2005. This industry is vital to the economy of Thailand because the industry requires significant investment as well as operating and maintenance capital and is linked to many other industries, both within Thailand and overseas. Additionally, this industry represents proportionally high amounts of GHG emissions compared with other industries.
Strategic planning for future GHG reduction from the petrochemical sector is important and requires detailed information for the GHG reduction policy development process. Thailand is still lacking this information for the petrochemical sectors; thus, a detailed overview of GHG emissions from the petrochemical industry in each of the upstream, intermediate and downstream petrochemical industries can assist in creating policies to reduce GHG emissions under the sectoral approach mechanism in Thailand. Therefore, this study aims to determine the baseline GHG emissions in the Thai petrochemical industry. This objective covers the three primary groups of petrochemical producers, including the producers of upstream, intermediate and downstream petrochemicals. This study identifies the sources of GHG emissions and major energy sources in the petrochemical production process and evaluates the effectiveness of GHG reduction measures that are commonly applied in Thai petrochemical plants. These research results will be helpful in making decisions, establishing GHG reduction goals for Thailand and contributing to global GHG reduction efforts.
2. Methodology
2.1. System boundaries
In this study, petrochemical plastic products were chosen as representatives of the upstream, intermediate and downstream groups because plastic products in the production line constitute 80% of the production capacity of all petrochemical production in Thailand. shows the representative petrochemical products addressed in this study and divides the six upstream petrochemical products, three intermediate petrochemical products and seven downstream petrochemical products into subgroups. The upstream products were divided into two groups: the olefin group (propylene, ethylene and mixed C4) and the aromatic group (toluene, benzene and paraxylene). The intermediate products that were studied included three products: vinyl chloride monomer (VCM), purified terephthalic acid (PTA) and styrene monomer (SM). Seven downstream products were included: polyvinyl chloride (PVC), low-density polyethylene (LDPE), linear low-density polyethylene (LLDPE), high-density polyethylene (HDPE), polypropylene, polyethylene terephthalate (PET) and polystyrene.
Table 1. Petrochemical products represented in the study.
This study determined the boundary for GHG emissions by following the Greenhouse Gas Protocol (Janet et al., Citation2004), which includes GHG emissions in two scopes. In Scope 1, direct GHG emissions originate directly from the production process and include combustion and flaring. In Scope 2, indirect GHG emissions originate indirectly from energy such as electricity and steam that is purchased and used in the production process. However, Scope 3, the other GHG emissions that come from the extraction and production of purchased raw materials and transportation, is not included in this study.
2.2. GHG accounting
In this research, input/output inventory data were collected from the production processes of all 24 petrochemical plants (covering 16 products) in Thailand during the years 2005–2010. This information was used to evaluate GHG emissions following the 2007 IPCC guidelines (IPCC, Citation2007). The scope established in Section 2.1 includes direct GHG emissions (Scope 1) and indirect GHG emissions (Scope 2). Direct GHG emissions sources are defined as energy used during the combustion of fuel purchased outside the plant (fuel), energy used during the combustion of fuel that is a by-product of the production process (fuel by-product) and the burning of flares (flares). The sources of indirect GHG emissions include electricity and steam purchased from outside the plant (electricity and steam). However, electricity and stream produced inside the plant are defined as direct GHG emission. For the plants that use both purchased and self-produced electricity/stream, the mass ratio allocation was applied.
The GHGs examined in this work include CO2, CH4 and N2O. In the evaluation of GHG emissions, the total of these three gases is calculated in units of carbon dioxide equivalent using the global warming potential (GWP) value according to the IPCC Fourth assessment report: climate change 2007 (IPCC, Citation2007). The results for the calculation of GHG emissions for petrochemical products are reported in terms of carbon intensity (CI) (CO2 eq./ton of product), and the amount of GHG emissions is calculated from Equation (1). Moreover, this research evaluates the results in terms of energy intensity (EI) (MJ/ton of product), and the amount of energy used in production is calculated using Equation (2). To convert the physical units of fuels to common energy units, joules, the net calorific values (NCVs) are used according to 2007 IPCC guidelines.(1)
(2)
2.3. Evaluation of GHG emission reduction from energy conservation measures
This research investigates the potential for reducing GHG emissions from the petrochemical industry based on mitigation measures used to conserve energy and other means of reducing GHG emissions. The study examines alternatives to reducing GHG emissions from the Thai petrochemical industry by collecting data pertaining to the energy conservation measures and GHG reduction approaches that have been implemented in the upstream petrochemical industry's intermediate and downstream plants during the 2005–2010 period and by calculating the reduction in CI values (CIreduction (CO2 eq./ton of product)) and the reduction in EI values (EIreduction(MJ/ton of product)) of each measure using the following equations:(3)
(4)
3. Results and discussions
3.1. EI and CI
3.1.1. Upstream petrochemical industry
The raw materials used in the production of olefins in Thailand are gas-based raw materials (i.e. ethane, propane and LPG) and liquid-based raw materials (i.e. naphtha, NGL and raffinate). The sources of GHGs in the production of olefins originate from the burning of fuels used to heat the molecules of the raw materials with steam in cracking furnaces. The fuels burned include natural gas and coal, but these fuels also generate methane and hydrogen, which are by-products of the molecular cracking production process. Apart from this step, other sources of GHG appear in other processes, including the elimination of CO2 from ethane when used as a raw material, the removal of coal dregs in chimneys and the burning of excess fuel or off-spec products. The important sources of GHG in the aromatic group originate from the process of burning fuels, similar to the production of olefins.
shows the average EI for petrochemical products in the upstream, intermediate and downstream groups during the 2005–2010 period. This figure shows that the EI of the olefin group exhibits higher values than that of the aromatic group because of the use of heat for olefins in the production process to crack the molecules of raw materials, whereas the aromatic groups use heat only to distil and separate their products. The product with the highest EI is mixed C4 at 23,588 MJ/t, and the product with the minimum average EI is benzene at 7348 MJ/t. The EI difference between the 2 products is nearly a factor of three. The EI of the olefins and aromatics in 2005–2010 has values ranging from 20,968 to 24,814 and from 5074 to 14,268 MJ/t, respectively. The trends in EI from 2005 to 2010 declined by 30% from the EI value in 2005, most likely because most plants implemented energy conservation measures and improved their industrial manufacturing processes, according to the Royal Thai Government's Promotion of Energy Conservation Act, thus resulting in more efficient energy use. shows the ratio of energy consumption in the production of upstream, intermediate and downstream petrochemical products during the 2005–2010 period. These values are separated according to sources of energy, including direct energy (fuel and fuel by-products) and indirect energy (electricity and steam). From the figure for the production of upstream petrochemicals, direct energy consumption is greater than indirect energy consumption by a factor of approximately 4 or by proportions of 80% and 20%, respectively. Direct energy is used in the process of molecular cracking in the olefin group, which requires high levels of heat to crack raw materials with large molecules (i.e. ethane, propane, LPG and naphtha) into smaller molecules. For the aromatic group, direct energy is used in the process of changing the molecular structure (reforming) of hydrocarbons. This process uses high levels of heat and pressure together with a catalyst to change the molecules of heavy naphtha into aromatic products.
Figure 1. EI of petrochemical products.
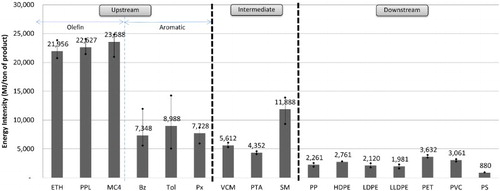
Figure 2. Ratio of energy consumption separated by energy source.
shows the average CI for the upstream, intermediate and downstream petrochemical products during the 2005–2010 period. From the figure, the average CI for upstream petrochemical products was approximately 0.95 t CO2 eq./t product, and the CI for the olefins was greater than that of the aromatics, which corresponds to the EI values mentioned above. The CI ranges for the olefins and aromatics in 2005–2010 were between 1.10 and 1.49 t CO2 eq./t and between 0.42 and 1.13 t CO2 eq./t, respectively. The upstream product with the highest CI is Mixed C4, with an average of 1.37 t CO2 eq./t, and the product with the lowest CI is benzene, with an average of 0.52 t CO2 eq./t. The trend in the CI values for the olefins and aromatics during the 2005–2010 period decreased steadily, corresponding to the trend in EI values, as most plants in the upstream petrochemical industry had implemented energy conservation measures resulting in more efficient manufacturing processes. This effort caused the EI and CI from the production process to decrease accordingly. By 2010, the CI of upstream petrochemical products was reduced by approximately 34% from the 2005 value. shows the average values of the major sources of GHG resulting from petrochemical production in the upstream, intermediate and downstream groups during the 2005–2010 period. As shown in the figure, the most important sources of GHGs in the upstream production are fuel by-products, steam, fuel, electricity and flares, in that order; their proportions of GHG emissions are 37%, 28%, 23%, 10% and 3%, respectively. The direct GHG emissions (fuel, fuel by-product and flare) have GHG emission values that that are approximately 1.6 times greater than the indirect (electricity and steam) values, with proportions of 62% and 38%, respectively.
Figure 3. CI of petrochemical products.
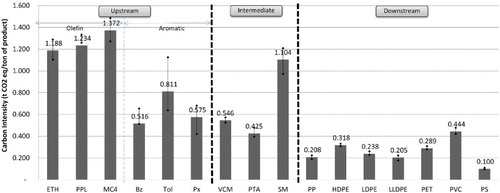
Figure 4. Ratio of GHG emissions separated by sources of GHG emissions.
3.1.2. Intermediate petrochemical industry
In general, upstream products are used as feedstock for intermediate petrochemical production. Ethylene, paraxylene and benzene/ethylene are raw materials used in the production of VCM, PTA and SM, respectively. The important sources of GHGs generated from intermediate petrochemical products originate from various processes. The GHGs from VCM production are generated from the burning of fuels to split the molecules of ethylene dichloride in cracking furnaces. The GHGs from the production of PTA are a product of the high-temperature oxidation reaction between paraxylene and oxygen obtained from a compressor and an oxidation reactor in which paraxylene is converted into terephthalic acid. The GHGs from the production of SM stem from the production process of ethyl benzene and the process of dehydrogenation. shows the EI values for intermediate petrochemical products, with an average of approximately 7284 MJ/t, which is a lower value than that of upstream products, with an average value of 15,388 MJ/t. The lowest and highest EI values for the intermediate products during the 2005–2010 period were 4108 and 13,903 MJ/t, respectively. The trend in the EI values from 2005 to 2010 was a steady decrease, similar to results for the upstream petrochemical products, as a result of the implementation of energy conservation measures. The product with the highest EI was SM, with an average EI of 11,888 MJ/t, as the production process of SM uses a polymerization process that requires high temperatures to bond ethylene and benzene. The product with the lowest EI was PTA, which had an average EI of 4352 MJ/t, because the production process of PTA is an exothermic reaction in which the heat that is produced can be reused by the system. shows that in intermediate petrochemical production, the direct energy use (fuel) value was only slightly lower than the indirect energy use value (electricity and steam), at 47% and 53%, respectively. This observation is different from the energy use portion of upstream production, in which the direct energy use is greater than the indirect energy use by a factor of approximately 4. The processes that require the direct combustion of fuel were the manufacturing process of ethyl benzene used for the production of SM and the process of molecular cracking of ethylene chloride for VCM production.
shows that the average CI for intermediate petrochemical products had a value of approximately 0.69 t CO2 eq./t, which was lower than the CI value for upstream products, with an average value of 0.95 t CO2 eq./t. The trend in CI from 2005 to 2010 was a steady decline resulting from the adoption of energy conservation measures, similar to the findings for upstream petrochemical plants. The intermediate product with the highest CI was SM, with an average of 1.10 t CO2 eq./t, because the production process uses large amounts of fuel for combustion and because the fuels most likely used were diesel and fuel oils, both of which are fuels with high carbon content. The product with the lowest CI was PTA, with an average value of approximately 0.43 t CO2 eq./t, as the main fuel used was natural gas, which has a low carbon content. shows the important sources of GHGs in intermediate production, including GHG emissions from electricity, steam, fuel and process venting (caused by the oxidation reaction in the process of producing PTA in which emissions are vented directly after treatment by an air pollution control device). The direct emissions of GHGs (fuel and process vent) had a slightly lower value than the indirect emissions of GHGs (electricity and steam), accounting for proportions of 41% and 58%, respectively. This finding differs from the results for the GHG emissions portion of upstream production, in which direct GHG emissions show a greater value than indirect GHG emissions by a factor of approximately 1.6.
3.1.3. Downstream petrochemical industry
shows that downstream petrochemical products had a lower EI than upstream products and intermediate products because the production process in the downstream industry does not include molecular cracking, which is a process in the upstream and intermediate petrochemical industry that consumes large amounts of energy. The main downstream process is the polymerization reaction used to create the bonds among single molecules using heat, pressure and/or a catalyst; this process uses much less energy than the other processes. The product with the highest EI value was PET, followed by PVC, which had average EIs of 3632 and 3061 MJ/t, respectively. The production process for PVC in Thailand is separated into two parts: the suspension process and the emulsion process. The PVC produced using the emulsion process had a larger EI value than that for other products because the polymerization reactor in the emulsion process consumes more direct energy from fuel combustion. The product with the lowest EI was polystyrene, which had an average EI of 880 MJ/t. shows that in the downstream production process, indirect energy (electricity and steam) had a larger value than direct energy (fuel and fuel by-product) by a factor of approximately 4, represented as 83% and 17%, respectively. This finding differs from the results for the energy use portion of intermediate production, in which the indirect energy use is only approximately 1.1 times greater than the direct energy use.
shows that the average CI for downstream petrochemical products is likely to correspond to the EI, with an average value of 0.26 t CO2 eq./t. The product with the highest CI was PVC, with an average value of 0.44 t CO2 eq./t, whereas the product with the lowest CI was polystyrene, with an average value of 0.10 t CO2 eq./t. The trend in CI values from 2005 to 2010 showed a slight decline, similar to the findings of the analysis of upstream and intermediate petrochemical products, because of the implementation of measures for the conservation of energy use. Average CI values declined in 2010 by approximately 4% from the 2005 value, which was an average of approximately 0.259 t CO2 eq./t. shows that the important sources of GHG emissions in downstream production included the use of electrical energy and steam energy (both of which are indirect sources of GHG emissions), representing approximately 87%, and the direct GHG emissions sources included flares and fuel, representing approximately 13%.
3.1.4. Comparison of energy and CI with BAT and BPT
summarizes the estimated EI and CI of Thai petrochemical products and compares them with the EI and CI from other countries worldwide based on the reported data after implementation of the BAT and best practice technology (BPT) from Gielen et al. (Citation2002), Neelis et al. (Citation2008) and IEA (Citation2009). The EI values from the majority of Thai petrochemical products are slightly higher than those found in other countries. However, a few types of Thai products have lower EI values than those for other countries, such as LLDPE, polystylene and PET. Therefore, Thailand still has great potential for GHG reduction by reducing energy consumption with BPT, including electricity and heat generation with the combined heat and power system, electricity conservation measures and production process updates. These improvements will also provide cost savings for energy expenses. Additionally, the average CI values for Thai petrochemical products are relatively similar to or lower than those for other countries, perhaps because of the use of natural gases as sources of energy and raw materials.
Table 2. Summary of energy and carbon intensities for the petrochemical industry.
3.2. Energy consumption and GHG emission flow chart for petrochemical products
Information pertaining to the CI and EI values, the production process and the productivity of representative petrochemical products was used to generate flow charts of the energy consumption and GHG emissions since 2005, as shown in and , respectively. In 2005, 12.27 million tonnes of petrochemical products were produced: upstream petrochemical products contributed 5.63 million tonnes, intermediate products contributed 2.64 million tonnes, and downstream products contributed 4.00 million tonnes, representing 45%, 22% and 33% of all petrochemical products, respectively (PTIT, Citation2009). shows the energy demand for representative products in the production process at approximately 122,752 TJ, classified by industry group. The upstream, intermediate and downstream products had proportional energy consumption of 78%, 14% and 8% of the total energy consumption, respectively. It can be observed that the upstream products accounted for nearly 75% of the total energy demand for petrochemical products because of their high production capacity and high energy consumption from the molecular cracking process applied to raw products and the process of molecular structure change. The flow chart of GHG emissions presented in shows that the amount of GHG emissions during the production of representative products has a value of approximately 8448 kt CO2 eq. When separated into the industry groups of upstream, intermediate and downstream products, the proportions of GHG emissions were 70%, 18% and 12%, respectively. Upstream products accounted for the largest amount of GHG emissions, contributing approximately two-thirds of all GHG emissions for the reasons mentioned above in relation to the energy requirements of petrochemical products, resulting in large amounts of GHG emissions from fuel burning within the system.
Figure 5. Energy flow chart of the petrochemical products represented in the study.
Figure 6. GHG emissions flow chart of the petrochemical products represented in the study.
3.3. Projection of energy consumption and GHG emissions for the petrochemical industry
To estimate the amounts of energy consumption and GHG emissions within all groups of the petrochemical industry, figures were calculated directly from the relative proportions of the amounts of each product across the entire country versus the actual amount of each representative product. shows the total energy consumption of the entire petrochemical industry, which has values ranging from 120,000 to 170,000 TJ and is divided into the upstream, intermediate and downstream petrochemical industries (with proportions of 77%, 14% and 9%, respectively). The data from DEDE (Citation2005) show that in 2007–2010, Thailand's energy consumption was 65,500–71,000 KTOE, or approximately 2,700,000–3,000,000 TJ; based on that figure, we can observe that the energy consumption of the petrochemical industry accounted for 6–7% of the total energy consumption in the country. The upstream petrochemical industry used the most energy from by-product fuels in the production process (8857 MJ/t), the intermediate industry used the most energy directly from combustive fuels (2549 MJ/t) and the downstream industry used the most energy from electricity (1226 MJ/t). shows the amount of GHG emissions from the Thai petrochemical industry, with values of approximately 8000–12,000 kt CO2 eq./yr, divided into GHG emissions from the upstream, intermediate and downstream petrochemical industries (with proportions of approximately 67%, 20% and 13%, respectively). Trends in the volume changes of GHG emissions in the industrial sectors for the first three years were oriented in the same direction, with the amounts remaining relatively consistent. However, because of the global economic downturn in 2008, the production capacity of all products was dramatically reduced, which contributed to the reduction of GHG emissions. When economic factors returned to normal in 2009 and 2010, manufacturers in the petrochemical industry expanded their capacity to accommodate the increased market demand, both domestically and internationally, which resulted in an exponential increase in the volume of GHG emissions (the rate increased 30% from 2008). However, when considering the ratio of GHG emission per energy consumption during 2005–2010, the value does not show any significant difference, indicating no change in fuel/feedstock during that period.
Figure 7. Total energy consumption of the Thailand petrochemical industry.
Figure 8. Total GHG emissions of the Thailand petrochemical industry.
Data from WRI (Baumert, Herzog, & Pershing, Citation2005) and Boden, Marland, and Andres (Citation2009) indicate that Thailand had GHG emissions in 2005–2006 that ranged from 375 to 425 Mt CO2 eq., and an evaluation of the amount of GHG emissions from the petrochemical industry in the same year found that the amount of GHGs was approximately 8–9 Mt CO2 eq., which was 2–3% of the entire country's GHG emissions.
3.4. Reduction of GHG emissions from measures intended to conserve energy within representative factories
3.4.1. Measures in the upstream petrochemical industry
An analysis of the energy conservation measures within representative upstream petrochemical factories that have been implemented during 2005–2010 is given in , and the measures are divided into three groups: energy conservation measures, steam conservation measures and fuel conservation measures. The data in show that the EI and CI reductions were approximately 1700 MJ/t and 0.20 t CO2 eq./t, representing decreases of approximately 9% and 16%, respectively, from the average intensity in 2005. Fuel conservation measures had the most drastically reduced intensity values, followed by steam and electricity conservation measures. The reductions in EI and CI resulting from the fuel, steam and electricity conservation measures had proportions of 84%, 13% and 3% for EI and 67%, 23% and 10% for CI, respectively. We note that the fuel conservation measures were the main measures used to reduce energy consumption and to reduce GHG emissions in the upstream petrochemical industry because the main production process uses fuel combustion to generate heat in the molecular cracking and reforming processes. Among the fuel conservation measures, the one that showed the greatest reduction in EI and CI was the reduction of excess air in cracking furnaces, which reduced the intensities by 25% and 14%, respectively. Among the steam conservation measures, the one with the greatest reduction in EI and CI values was heat recovery for use in water boilers (Waste Heat Boiler), which reduced the intensities by 5% and 16%, respectively.
Table 3. Energy conservation measures for representative petrochemical factories.
3.4.2. Measures in the intermediate petrochemical industry
shows the results of the analysis of energy conservation measures for the intermediate petrochemical industry, which showed that the EI and CI reductions had values of approximately 360 MJ/t and 0.06 t CO2 eq./t, () representing decreases of approximately 6% and 10%, respectively, relative to the average intensities in 2005. The steam conservation measures exhibited the greatest reduction in intensity, followed by the electricity and fuel conservation measures. The EI and CI reductions from steam, electricity and fuel conservation measures represented proportions of 76%, 24%, and 0% for EI and 74%, 21% and 5% for CI, respectively. The measures associated with the greatest reductions in EI and CI included the installation of a system that mixed steam before it entered the heater, which was able to reduce the intensities by 46% and 40%, respectively. The measures for electricity conservation that most effectively reduced the EI and CI included the installation of variable speed drives (VSDs) onto different devices, which reduced energy consumption by 28.4 MJ/t, equivalent to 8% of the total amount of energy reduced. In addition, the energy conservation measures that were the most efficient in EI and CI reduction were efficiency inspections of the steam trap, heat recovery from waste gas and reduction in the heat of waste gas, which reduced the EI by 20%, 5% and 4%, respectively, and reduced the CI by 17%, 4% and 3%, respectively.
3.4.3. Measures in the downstream petrochemical industry
An analysis of the energy conservation measures for the downstream petrochemical industry is given in . These data show that the EI and CI reductions were approximately 167.43 MJ/t and 0.005 t CO2 eq./t, () representing decreases of approximately 5% and 1.5%, respectively, from the average intensity in 2005. The electricity conservation measures provided the greatest reduction, followed by the steam and fuel conservation measures. The reduction in EI and CI from electricity, steam and fuel conservation measures represented proportions of 87%, 11% and 2% for EI, respectively, and 98%, 1.5% and 0.5% for CI, respectively. The measures for electricity savings were the main measures that aided in the reduction of energy consumption and GHG emissions in the downstream industry and corresponded to the proportion of energy sources and GHG sources mentioned above. The measures in the electricity conservation group that resulted in the greatest reductions in EI and CI included the reuse of waste heat (reduced by 31.3 MJ/t) and modification of the transformer load to better suit operating conditions (reduced by 1.72 kg CO2 eq./t), respectively. The steam conservation measures that most notably reduced the EI and CI included inspecting the efficiency of the steam trap (reduced by 13.1 MJ/t) and reducing the use of steam when increasing the temperature of water (0.066 kg CO2 eq./t), respectively. In addition, the energy conservation measures that were highly efficient in reducing the intensities were changing the cooling tower fan and controlling the cooling tower fan to ensure more appropriate operation; these measures reduced the EI by 11% and 5%, respectively, and reduced the CI by 25% and 11%, respectively.
Table 4. Summary of EI and CI reduction measures for the Thailand petrochemical industry.
4. Conclusions
The CI of the upstream petrochemicals had the highest value, followed by those of the intermediate and downstream petrochemicals. This result is consistent with the findings for the EI values, which were in the same order. The largest source of GHG emissions from the upstream petrochemical industry (81%) originated from the direct combustion of fuel in the process of molecular cracking for the olefin group and the process of molecular structure reforming of hydrocarbons for the aromatic group. For GHG emissions in the intermediate industry, the sources of most emissions were direct energy (fuel) and indirect energy (electricity). Most sources of GHG emissions in the downstream industry came from indirect energy (electricity and steam) because the main production process of polymerization reaction required less energy. The decrease in CI from 2005 to 2010 was likely observed because the industry sector implemented measures for improved energy conservation and updated production processes. These effects primarily resulted from the requirements contained in the Promotion of Energy Conservation Act of Thailand, which resulted in more efficient energy use. With respect to the mitigation potential for different GHG reduction measures, the fuel conservation measures (reducing direct energy) and the steam and electricity conservation measures (reducing indirect energy) had the highest potential to reduce GHG emissions from the upstream, intermediate and downstream petrochemical industries. These measures correspond to the main sources of energy consumption in the petrochemical industry. These results provide important information for the planning of future additional reductions in GHG emissions in the petrochemical industry based on consideration of the proportion of GHG emissions from each source and the potential for reducing GHG emissions with each different option.
Acknowledgements
This research has been supported by the Ratchadaphiseksomphot Endowment fund 2013 of Chulalongkorn University (CU-56-403-CC). The authors would like to thank the Thai Research Fund (TRF) and The Petrochemical Industry in Thailand for providing the collaboration in this research.
References
- Baumert, K. A., Herzog, T., & Pershing, J. (2005). Navigating the numbers greenhouse gas data and international climate policy. Washington, DC: World Resources Institute.
- Boden, T. A., Marland, G., & Andres, R. J. (2009). Global, regional, and national fossil-fuel CO2 emissions. Oak Ridge: Carbon Dioxide Information Analysis Center, Oak Ridge national laboratory.
- Brown, T., Gambhir, A., Florin, N., & Fennell, P. (2012). Reducing CO2 emissions from heavy industry: A review of technologies and considerations for policy makers. London: Grantham Institute for Climate Change, Imperial College.
- Chen, L., & Hu, A. H. (2012). Voluntary GHG reduction of industrial sectors in Taiwan. Chemosphere, 88, 1074–1082. doi: 10.1016/j.chemosphere.2012.04.049
- Department of Alternative Energy Development and Efficiency. (2005). Energy report of Thailand. Energy Ministry of Thailand, Bangkok.
- Dong, H., Ohnishi, S., Fujita, F., Geng, Y., Fujii, M., & Dong, L. (2014). Achieving carbon emission reduction through industrial & urban symbiosis: A case of Kawasaki. Energy, 64, 277–286. doi: 10.1016/j.energy.2013.11.005
- Gielen, D. J., Moriguchi, Y., & Yagita, H. (2002). CO2 Emission reduction for Japanese petrochemicals. Journal of Cleaner Production, 10, 589–604. doi: 10.1016/S0959-6526(01)00056-7
- Herzog, T. (2009). World greenhouse gas emissions (WRI Working Paper). Washington, DC: World Resources Institute.
- Huang, Y.-F., Lin, Y.-C., & Yang, J.-T. (2010). An innovative indicator of carbon dioxide emissions for developing countries: A study of Taiwan. Energy Policy, 38, 3257–3262. doi: 10.1016/j.enpol.2010.02.001
- International Energy Association. (2009). Chemical and petrochemical sector: Potential of best practice technology and other measures for improving energy efficiency. France: IEA, 60pp.
- IPCC. (2007). Fourth assessment report. Working group 1. Chapter 2: Changes in atmospheric constituents and in radiative forcing. Cambridge: Cambridge University Press.
- Janet, R., Laurent, C., Pankaj, B., Simon, S., Peter, G., & Kjell, O. (2004). The Greenhouse gas protocol: A corporate accounting and reporting standard. Washington, DC: World Resources Institute and World Business Council for Sustainable Development.
- The Joint Graduate School of Energy and Environment. (2010). Final report of Thai greenhouse gas inventory project. Bangkok: King Mongkut's University of Technology Thonburi.
- Neelis, M., Patel, M., Blok, K., & Bach, P. W. (2002). Approximation of theoretical energy saving potentials for the petrochemical industry using energy balance for 68 key processes. Energy, 32, 1104–1123. doi: 10.1016/j.energy.2006.08.005
- Neelis, M., Worrell, E., & Masanet, E. (2008). Energy improvement and cost saving opportunities for the petrochemical Industry. An ENERGY STAR® Guide for Energy and Plant Managers. Berkeley, CA: Lawrence Berkeley National Laboratory. 132pp.
- Niramol, S., 2009. Sectoral approach concept, Economic Faculty, Thammasat University.
- Petroleum institute of Thailand (PTIT). (2009). Final report of petrochemical industry project of comparative industrial data collection to increase their competitiveness, phase 2.
- Saygin, D., Patel, M. K., Worrell, E., Tam, C., & Gielen, D. J. (2011). Potential of best practice technology to improve energy efficiency in the global chemical and petrochemical sector. Energy, 36, 5779–5790. doi: 10.1016/j.energy.2011.05.019