
 ?Mathematical formulae have been encoded as MathML and are displayed in this HTML version using MathJax in order to improve their display. Uncheck the box to turn MathJax off. This feature requires Javascript. Click on a formula to zoom.
ABSTRACT
Bacillus cereus is a Gram-positive opportunistic pathogen closely related to the entomopathogen, Bacillus thuringiensis, both of which are involved in intestinal infections. Iron is an essential micronutrient for full growth and virulence of pathogens during infection. However, little is known about iron homeostasis during gut infection. Therefore, we aimed to assess the expression of B. cereus genes related to bacterial iron homeostasis, virulence and oxidative stress. The hypothesis is that the expression of such genes would vary between early and later stage colonization in correlation to gut cell damage. To perform the study, a germ-free Galleria mellonella model was set up in order to adapt the use of Laser-capture microdissection (LCM), to select precise areas in the gut lumen from frozen whole larval cryo-sections. Analyses were performed from alive larvae and the expression of targeted genes was assessed byspecific pre-amplification of mRNA followed by quantitative PCR. Firstly, the results reinforce the reliability of LCM, despite a low amount of bacterial RNA recovered. Secondly, bacterial genes involved in iron homeostasis are expressed in the lumen at both 3 and 16 hours post force-feeding. Thirdly, iron gene expression is slightly modulated during gut infection, and lastly, the mRNA of G. mellonella encoding for ferritin and transferrin iron storage and transport are recovered too. Therefore, iron homeostasis should play a role in B. cereus gut colonization. Furthermore, we demonstrate for the first time the value of using LCM for specific in situ gene expression analysis of extracellular bacteria in a whole animal.
INTRODUCTION
Iron is an essential micronutrient for the majority of living organisms. It is involved in several vital processes such as DNA synthesis, respiration, and several other biochemical reactions. However, iron can trigger Fenton reactions, which generates reactive oxygen species a threat for cell membrane integrity, nucleic acids, and proteins [Citation1,Citation2]. Therefore, iron homeostasis is tightly regulated in living organisms. In man and other mammals, the majority of iron is bound to heme in hemoproteins, or bound to transport proteins like transferrin or stored in ferritins, which can reserve thousands of iron atoms [Citation3,Citation4].
To overcome this lack of free iron, pathogens are equipped with mechanisms capable of grabbing iron from the iron-rich host molecules [Citation5,Citation6] or hijacking host iron transport molecules [Citation7]. In this study, we target the opportunist food-borne pathogen Bacillus cereus sensu stricto, a Gram-positive, spore-forming bacteria causing emetic or diarrheal symptoms in humans [Citation8,Citation9]. The Bacillus cereus sensu stricto is tightly related to the human pathogen Bacillus anthracis and the entomopathogen Bacillus thuringiensis [Citation10–13]. B. cereus possesses different strategies to scavenge sequestered iron during host infection. This can be done through direct interactions using surface proteins [Citation14–16], or indirect interactions using both surface proteins to bind the iron source and secreted siderophores, which are small molecules with high affinity for free Fe3+ [Citation17]. The siderophore bacillibactin, encoded by genes of the entA-dhbBCF cluster [Citation18], has been shown to have a major impact on bacterial survival in a low iron environment. For example, the B. cereus ATCC 14579 bacillibactin mutant is strongly affected in vitro in iron deprived conditions, and in virulence, following injection into the hemocoel of the insect larvae Galleria mellonella [Citation19]. The feuABCD/yuil operon codes in B. cereus for an ABC carrier type protein supposed to allow the transport of the bacillibactin/Fe3 + complex into the cell, with the gene feuA encoding for the specific siderophore binding protein [Citation20]. Like for several other bacteria, the processes involving iron homeostasis-related gene expression in B. cereus, are also under the control of the repressor Fur (Ferric Uptake Regulator), which modulates indirectly pathogenicity during host infection [Citation21–23]. Furthermore, in vitro transcriptomic studies were performed in B. cereus in iron-depleted conditions highlighting genes which are involved in iron homeostasis [Citation24].
However, little is known of the role played by genes related to iron homeostasis during gut infection and colonization in pathogenic Gram-positive bacteria. In the Gram-negative Escherichia coli, it was found that the catecholate type siderophores and their associated transport systems have a role in the colonization of the mouse urinary tract and gut [Citation25,Citation26]. In addition, genes involved in iron uptake confer fitness advantages to Salmonella enterica during growth and colonization in the mouse intestine [Citation27]. Likewise, gut microbiota and probiotic bacteria are reported to be involved in iron uptake in the gut, thereby preventing sustainable colonization of several bacterial species like Salmonella [Citation28,Citation29]. Strategies targeting siderophore acquisition of enteric pathogens have been tested as new therapeutic and preventive strategies [Citation30].
G. mellonella is used as a promising and low-cost infection model since it harbors a relatively complex innate immune system similar to mammals [Citation31,Citation32]. The larval stage has been used to analyze Gram-negative (e.g. Pseudomonas aeruginosa, Escherichia coli) or Gram-positive bacteria (e.g. Staphylococcus aureus, Enterococcus faecalis, Listeria monocytogenes), allowing identification of virulence factors triggering mammalians infections and antimicrobial drugs testing following injection into the hemocoel [Citation33,Citation34]. G. mellonella was also proved to be an appropriate model for B. cereus, B. thuringiensis, Pseudomonas entomophila, and Listeria monocytogenes oral infection studies [Citation35–37] and for a B. cereus IVET (in vivo expression technology) promoter trap screening [Citation38]. The latter approach identified IlsA a unique surface protein involved in iron acquisition [Citation14,Citation15] and revealed expression of other iron regulated factors during infection [Citation38]. To decipher interactions between microorganisms and the host during infection, we have chosen a challenging approach based on laser-capture microdissection (LCM) [Citation39,Citation40]. This technology allows the specific isolation of a target region without impact on the gene expression profile and has been used in different organisms and ecological niches [Citation41,Citation42]. Originally, LCM was used in cancer research [Citation43–45] and then in broad-range disciplines in life sciences using mostly mammals as model. But, so far, only few examples are related to microbiology, for instance, to obtain information on the microbiota species spatial organization in the gut [Citation46–48], and host responses comparing conventional versus germ-free enterocytes [Citation49]. Reports on gene expression of an intracellular bacterial pathogen [Citation50] or plant-microorganisms interactions [Citation51,Citation52] are rare.
In our study, we have developed a method of breeding germ-free Galleria mellonella larvae to avoid measuring commensal microbiota gene expression. We aimed to explore different B. cereus genes, with focus on those reported or supposed as being involved in iron homeostasis. We also selected a few specific virulence factors previously shown to be involved in gut infection along with factors involved in oxidative stress. We wanted to explore the expression of these genes in the insect gut environment as they may play a central role in bacterial settlement and indirectly or directly in virulence in the host gut. LCM was used for selection of bacteria from the intestine lumen at early and late gut colonization from whole snap frozen larvae. The main objective of our study was to analyze bacterial gene expression, but the expression of a few iron and immunity-related genes of the G. mellonella larvae were also analyzed. The expression of the -iron storage and transport proteins ferritin and transferrin, which have similar function in insects and mammals, were measured [B. Y. Citation53–55]. To our knowledge, the use of LCM for a precise gene expression analysis in an extracellular pathogen during gut colonization has never been reported before. Therefore, the approach is innovative and should be relevant for other host pathogen in vivo and in situ gene expression analyses.
Material and Methods:
B. cereus growth conditions for Galleria mellonella infection
Bacillus cereus ATCC 14579 (laboratory stock) was used in this study. For infection and colonization, the strain was cultured in 10 mL volume of LB (Luria-Bertani) broth, with vigorous shaking (190 rpm) at 37°C. At OD600 nm = 1, bacteria were harvested by centrifugation (8000 rpm) and washed twice with sterile phosphate saline buffer (PBS) 1X (filtered on a 0.22 µm membrane, GP Millipore Express® PLUS Membrane).
B. cereus growth and qPCR for in vitro conditions
The B. cereus ATCC 14,579 strain, as control for RT qPCR analyses, was cultured in 10 mL LB or 10 mL LB with an iron chelator, the 2.2’-Bipyridyl (DIP) at 200 µM, with vigorous shaking (190 rpm) at 37°C and collected at their respective mid-log growth phase. Each condition (LB and LB + DIP 200 µM) was performed in three biological replicates. Cultures were then centrifuged at 10,000 rpm during 5 minutes. The supernatants were discarded and pellets were stored at – 80°C before total RNA extraction. Extraction was performed as described by Citation56. The qPCR was performed on QuantStudio™ 12 K Flex [Applied Biosystems, Thermo Fisher Scientific] as described by Citation57. Data analysis was conducted by the comparative threshold cycle method () with the Thermo Fischer Cloud using the statistical test Benjamini-Hochberg false discovery rate procedure.
Germ-free Galleria mellonella set up
All the devices and material used for the preparation of germ-free G. mellonella were cleaned with 70% ethanol prior to a 10-minute UV light (254 nm) exposure in sterile conditions (Microbiological safety cabinet, MSC). Further manipulations including G. mellonella infections were performed within a sterile MSC. To generate germ-free larvae, UV-treated G. mellonella eggs were reared on sterile (Cobalt irradiated intensity 25 kGy (SAFE Company, Augy, France)) beeswax and pollen. Glass jars containing eggs and food were sealed (permitting aeriation with filtering cotton on the lid) and incubated at 27°C in a humidified incubator. Verification of bacterial germ-free (bacteria only) status was assessed by plating on 3 LB agar petri-dishes, with 300 µL suspension of a larvae homogenized in 1 ml sterile PBS (3 larvae/batch) incubated at 37°C for 24 h. In addition, extraction of DNA from the dissected digestive tract was performed for further verification. DNA quantity and quality were assessed (NanoDrop 2000, Thermo Scientific) and PCR amplification of 16S rRNA gene using V3 and V4 primers for bacterial DNA detection was conducted. No amplification of bacterial DNA was found in larvae from the three batches, while amplification was obtained with DNA from normal reared larvae.
Gut colonization estimation and mortality assays in Galleria mellonella
Last instar axenic reared larvae (250–300 mg) were force-fed as previously described [Citation58] with a mixture of mid log phase (OD 600 = 1, LB medium) vegetative B. cereus ATCC 14,579 strain bacteria suspended in trypsin activated Cry1C toxin. This is the so-called synergy model, in which no infection or mortality occurs with the force-feeding of the toxin or bacteria alone, while the association of bacteria and the toxin are able to infect the insect resulting in mortality [Citation37]. Forty larvae were force-fed for each of the three independent experiments. Larval mortality/survival was scored at 3, 16, and 24 hours post force-feeding. To estimate colonization, triplicates of two larvae were analyzed, for a total of 6 larvae per time point or 18 larvae per experiment. The remaining larvae were used to measure the survival rate. The Bacteria used for force-feeding were harvested by centrifugation and the pellet suspended in Cry1C toxin (0.3 mg/mL) at 5 × 10⁸ colony forming unit (CFU)/mL resulting in a 10 µl dose of 5 × 10⁶ CFU and 3 µg Cry1C toxin/larva. Larvae were incubated at 37°C without food. Bacterial colonization was scored by counting B. cereus CFUs in the living insects at T0 (just after) and 3 hours and 16 hours post force-feeding, each sample of 2 larvae were crushed and homogenized with UltraTurax tissue cutter in a final volume of 10 mL sterile water; dilutions were immediately plated onto LB agar. For each sample, three technical replicates were performed to score CFU.
Preparation of frozen Galleria for Laser capture microdissection
As described, the axenic last instar larvae (250–300 mg) were force-fed [Citation58] with the same B. cereus ATCC 14579 mid log phase centrifuged bacteria from LB medium mixed with Cry1C, as in the above colonization experiment. Larvae were first incubated at 37°C and then frozen in isopentane (Sigma-Aldrich) in a Snapfrost equipment (Excilone, France) at 3 and 16 hours post forcefeeding. Control larvae without bacteria were force-fed with 10 µL of either Cry1C toxin (0.3 mg/mL) or sterile PBS, in order to investigate the effect on the peritrophic matrix and gut cells with the toxin alone. No test was run with the bacteria alone since in that case the bacteria would just transit inside the peritrophic matrix space (in the food bolus) to be excreted with the feces after 2 hours [Citation59].
Tissues Preparation for LCM
The cryo-section process was performed in a cryostat (FSE Shandon, ThermoFisher, France) at −20°C and in an RNA-free environment (material treated with RNAzap and 70% ethanol). The frozen infected larvae were stored at −80°C until LCM was performed. For each biological replicate and to obtain enough material for downstream analyses, the second quarter of five larvae were cut out and 10 cross-sections per quarter were collected on Arcturus PEN membrane RNAse-free glass slides (Excilone, France). Approximately 3 to 5 sections were gathered on each slide, and fixed immediately in 75% cold ethanol in the cryostat before further processing. The larval cross-sections (16 µm thick) were then dehydrated and colored by the following protocol [Citation60,Citation61]: 50% ethanol for 20 seconds, homemade ethanolic solution of 1% cresyl violet for 20–30 seconds, 50% ethanol for 20 seconds, 75% ethanol for 30 seconds, 95% ethanol for 40 seconds (twice), 100% ethanol for 1 min (twice), xylene for 5 min (twice). To locate the targeted structures, sections were analyzed under the optical microscope using the XT® Arcturus Technologies microdissection system (Excilone, France).
Laser Capture Microdissection
The LCM process was carried out using the XT® Arcturus Technologies microdissection system and software. Capture was performed using Arcturus CapSure® LCM Macro Caps (Excilone, France). Bacteria present inside the insect gut were identified using the 20X objectives. PEN Membrane Slides allowed the use of standard IR and UV lasers. UV laser was used to cut around the lumen, avoiding epithelial cells, and IR laser was used to capture and stick the samples on the macro caps without contaminating the sample with non-target tissue. Efficiency of microdissection was evaluated by examining the samples after lifting off the CapSure® macro caps. To obtain enough material for downstream analysis, 5 to 10 caps per biological replicate were stored at −80°C.
RNA extraction from LCM samples
For each condition (3 or 16 hours) and biological replicates (three biological replicates overall), the samples sticking over the caps were gently collected using a RNase-free device to remove the film covering the caps, and pooled in the same RNase-free tube. Total RNA was extracted using the Picopure™ RNA Isolation kit (Excilone, France). The protocol recommended by the manufacturer was modified to adapt with Gram-positive bacteria characteristics. To reach an optimal total RNA extraction, the following steps were performed:
i) A volume corresponding to 50 µL of lysozyme solution (10 mM Tris-HCl pH = 8/0.1 mM ethylenediaminetetraacetic acid (EDTA)/1 mg lysozyme) by cap was added in each tube and thoroughly mixed ; ii) Addition of 0.5 µL of a 10% Sodium Dodecyl Sulfate (SDS) solution to the lysate and well mixed; iii) Incubation 5 minutes at room temperature; iv) Addition of 150 µL of Extraction Buffer (provided by manufacturer); v) The lysate was gently aspired 5 times through a RNAse free needle and syringe; vi) Addition of 70% ethanol.
The protocol was ended following the manufacturer procedure. The quality and quantity of the RNA was assessed using an Agilent 2100 Bioanalyzer (Agilent Technologies, Palo Alto, CA) with an RNA6000 Pico Lab Chip and analyzed by the RNA Integrity Number (RIN) algorithm [Citation62].
Targeted genes for Quantitative PCR
For this study, we targeted genes involved in B. cereus iron homeostasis along with other genes implicated in different bacterial processes like tissue damage, oxidative stress, etc. Reference housekeeping genes rpoB, tpi and purH were tested for accurate normalization of data ().
Table 1. Bacillus cereus ATCC 14579 genes targeted in the qPCR analysis classified by function
Primers were designed using Primer Express™ 3 software (Applied Biosystems), adapting the algorithm of primer research for SYBR Green quantitative PCR (qPCR). Primer efficiencies were tested on a cDNA pool obtained from B. cereus cultured in LB medium and LB with an iron chelator, the 2,2’-Bipyridyl (DIP), with vigorous shaking (190 rpm) at 37°C and stopped at OD600nm = 1. Primer efficiencies were tested using standard curves with different concentrations of B. cereus cultures cDNA and melting curve. All primers had at least 85% of efficiency. Two G. mellonella host genes () related to iron homeostasis and nutrition immune responses were analyzed as markers for host reaction to iron modulation during infection: the iron-transport protein transferrin, and the iron storage and transport molecule ferritin 32 kDa subunit present in G. mellonella gut cells [B. S. Citation63]. The chosen G. mellonella reference genes were the 18S rRNA and the elongation factor EF1 as described earlier [Citation64].
Table 2. Galleria mellonella genes targeted in the qPCR analysis classified by function
mRNA amplification and Quantitative PCR (qPCR)
Reverse transcription (RT) to obtain cDNA was performed using the TATAA Grandscript cDNA Synthesis Kit (TATAA Biocenter) according to the manufacturer protocol, to allow RT of low copy number targets, with a GeneAmp PCR System 2400 (PERKIN ELMER).
Before the qPCR, a pre-amplification (PreAmp) step was needed, as the amount of bacterial mRNA was too low in the collected samples to get a correct detection during the SYBR Green qPCR analysis. To perform this pre-amplification, we used the TATAA PreAmp GrandMaster® Mix (TATAA Biocenter). The first step was to prepare a primer pool in nuclease free water (Qiagen) of primers targeting the selected genes. Accordingly, with the manufacturer recommendations, each couple of primers in the primers pool had a final concentration of 50 nM. To test the efficiency of PreAmp, we used the same pool of B. cereus total RNA extracted. The PreAmp mix was then prepared as following for each biological replicate: 25 µL of TATAA PreAmp GrandMaster® Mix; 20 µL of primers pool (20 nM final); 5 µL of undiluted cDNA. The cycling protocol respects the manufacturer recommendations with 18 cycles in a GeneAmp PCR System 2400 (PERKIN ELMER). The PreAmp reliability was tested before the experiments, using two different concentrations of total RNA extracted from a B. cereus cells pool cultured in LB and in LB + DIP 0.2 mM. The concentrations were 50 pg and 0.05 pg of total RNA. RT and PreAmp were performed as described above, and control (cDNA without PreAmp) was analyzed too. The relative Ct gain after qPCR was then determined.
SYBR Green qPCR (SYBR qPCR) was performed following the instructions of TATAA Biocenter, using the QuantStudio™ 12 K Flex (Applied Biosystems by Thermo Fisher Scientific). For each sample, 2 µL of PreAmp cDNA was loaded with 10 µL of TATAA SYBR® GrandMaster® Mix (1X final), 1.2 µL of forward and reverse primer (300 nM each) and 2.6 µL of nuclease free water (provided with the kit). The three steps cycling protocol was as following: Pre-denaturation: 95°C, 30 seconds; Cycling: 95°C, 5 seconds followed by 60°C, 30 seconds; Data collection: 70°C, 10 seconds. Data were primarily analyzed and collected with the QuantStudio™ 12 K Flex Software v1.2.2 and further analyses were performed using the Thermo Fisher Connect™ cloud.
Results
In this study, we wanted to analyze B. cereus gene expression while the bacteria were present in the intestinal lumen or colonizing the intestinal cells before larval mortality. For that purpose, we used the G. mellonella synergy model (developed in our team), for which no or low mortality is observed when G. mellonella is fed with Cry1C toxin or B. cereus alone, while a high mortality is reached when the bacteria are associated with the toxin [Citation37]. The bacteria alone were not tested as it is known that the bacteria alone cannot infect the G. mellonella larva, as they are excreted rapidly along with the peritrophic matrix, when force-fed without Cry1C, and therefore cannot persist and colonize the gut [Citation37, and Citation59].
Galleria mellonella survival and gut colonization of B. cereus following ingestion
Therefore, we measured G. mellonella survival after force-feeding with a suspension of B. cereus and Cry1C toxin. Control was performed with Cry1C toxin alone, and data were recorded immediately (T0), 3 hours (T3), and 16 hours (T16) after force-feeding (). A survival rate of 69% of G. mellonella larvae was observed T16 after B. cereus and toxin ingestion, which is statistically different from the control batch fed with Cry1C toxin only (93% of survival). No difference is recorded at T0 and T3, despite a few dead larvae (95% of survival). In addition, survival at 24 hours was 95% for toxin alone and 49% for the association of bacteria and toxin. To determine bacterial persistence inside the gut in living G. mellonella larva, we chose the time points planned to be used for micro-dissection (3 hours and 16 hours post infection), and for which less than 30% mortality was observed. We assessed the number of B. cereus recovered in the whole larva (). The amount of B. cereus increased throughout the infection time, with a mean value of 3.75 × 10⁶ CFUs (Colony Forming Units) per gram of larvae (about 5 larvae for one gram) at T0, to 6.51 × 10⁶ CFUs per gram of larvae at T3 and 2.77 × 10⁸ CFUs per gram of larvae at T16. Despite an increase of two log value at T16 compared to T0 and T3, this difference was not statistically different due to variation among replicates. Based on these results, we were confident to find B. cereus in alive insect larvae at both T3 and T16 after force-feeding.
Figure 1. Survival and gut colonization level of Galleria mellonella after oral infection with vegetative Bacillus cereus ATCC 14,579 (WT). A) G. mellonella survival was recorded immediately (T0), 3 hours (T3) and 16 hours (T16) after force-feeding with B. cereus WT + Cry1C toxin or toxin alone. B) B. cereus WT persistence inside the whole G. mellonella gut was measured at T0, T3, and T16. Error bars represent standard deviations of three independent experiments. 40 larvae were force-fed per experiment. For CFU counts a total of 18 larvae (3 x 6 larvae) were analyzed per time point. Statistical differences are annotated. The student t-test was performed using RStudio software (n = 3, p < 0.05)
LCM of B. cereus in G. mellonella midgut for qPCR analysis
To compare the expression of B. cereus genes during G. mellonella midgut infection, two time points were selected. Three hours (T3), designed as control to allow bacterial adaptation in the intestinal environment (supposed to be in the lumen before adhesion to the gut epithelium), as well as sixteen hours (T16), when the bacteria should be colonizing the intestinal surface. This observation was based on non-published histology analysis with the B. thuringiensis 407cry- strain, which, like B. cereus 14579, does not carry Cry toxin genes. To decide which part of the intestine to analyze, infected frozen G. mellonella larvae were cut in four equal cross-sections, and the number of B. cereus CFUs inside each section was determined. At T16, bacteria were recovered in each larval section; the majority was in the second section corresponding to the upper part of the midgut (), which we then used for the sampling. To perform LCM, we cut the area containing the bacteria with the UV laser and then glued it to the bottom of the macro cap.
Figure 2. Light microscope observation of stained cryo-sections of germ free G. mellonella larvae, Sections in (A,B,C,D) are without B. cereus, while E,F,G shows the UV-micro-dissection of bacteria in the Larval lumen 3 hours post force-feeding with B. cereus associated with toxin. (a) a sagittal20 µm thick-section of a whole non-infected larvae. The area inside the red square indicates the part from which cross-sections (16 µm thick) were sampled for laser-capture microdissection. (b, c) Cross-sections from a negative control (PBS force-fed) larvae (d) section from larva T3 hours post force-feeding with Cry1C toxin alone (B,C,D are captured with lens: 10×). The figures E, F and G present cross-sections before (e) and (f) after laser-capture microdissection with UV-cutting (F, lens 10×; G, lens 2×). (lum: Lumen; Hem: Hemocoel; Ct: Cuticle; Mg: Midgut; Amg: Anterior midgut; Pmg: Posterior midgut; gEpi: Gut Epethlium (enterocytes); pm: Peritrophic matrix; bac: Bacteria
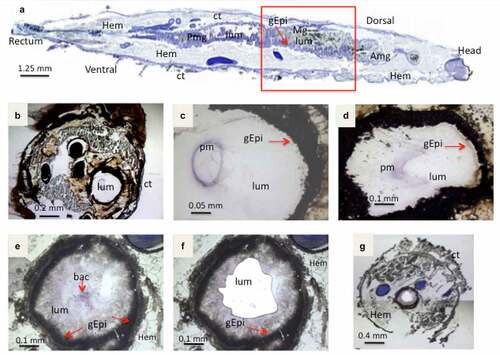
Histology and infection progress
First, larvae from the negative control, force-fed with PBS buffer, were analyzed under the microscope following cresyl violet staining (). The intestinal surface and the peritrophic matrix (violet ring in the lumen) were visualized and looked intact. Larvae treated with Cry1C only showed a modified peritrophic matrix at T3 post ingestion (), suggesting that Cry1C might structurally damage this barrier. The UV-cutting laser was used to collect B. cereussamples inside G. mellonella lumen (). UV dissected sections shown on and g, indicate that a whole area inside the intestinal lumen has been removed.
Figure 3. Light microscope observation of G. mellonella larvae infected with B. cereus associated with Cry1C toxin 3 hours after force-feeding. Cross–section (16 µm) with focus on the midgut lumen, and bacterial localization and morphology . The sections were stained with cresyl violet and dehydrated with ethanol and xylene (a). The majority of the bacteria were found in the midgut lumen and the peritropfic matrix has lost its structure. (A) lens 4×; (b) lens 10×; (c) 20× lens, and (d) 40× lens. lum: intestinal lumen; bac: bacteria; gEpi: Gut Epithelium; pm: Peritrophic matrix
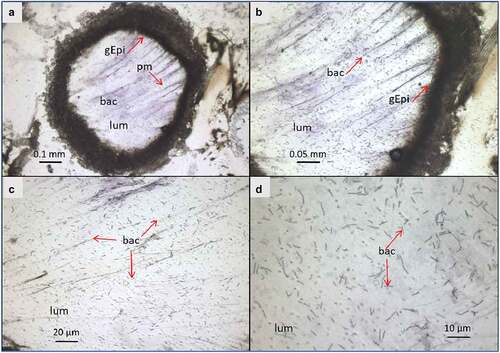
At T3, the bacteria were widespread in the center of the lumen (.E and 3)
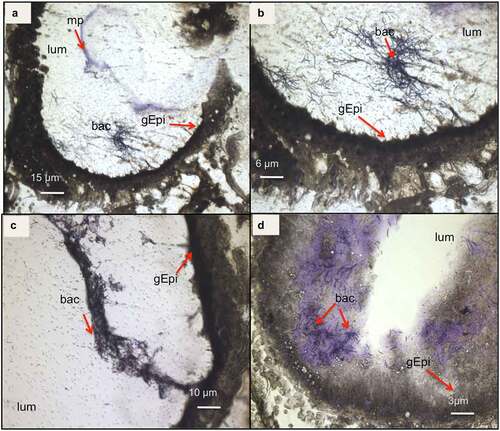
while being, at T16, either closer to the gut epithelial or embedded in detached epithelial cells in the lumen (). At both T3 and T16, B. cereus crossed the peritrophic matrix, which could not be properly identified anymore, probably due to the Cry1C toxin and/or the bacteria associated synergy action [Citation37]. The gut epithelium kept its integrity at T3, while some enterocyte damage was observed at T16, which could enable the bacteria to enter the hemocoel. Differences in bacterial shape and localization in the lumen were noticed when comparing the two time points (). While B. cereus was widespread and more individualized in the gut lumen at the early stage of infection (T3), they tended to concentrate closer to the epithelium at T16, forming aggregates like a potential biofilm. These observations suggest physiological and phenotypical adaptation of B. cereus to this step of infection. Hence, as expected, the bacteria increase the intestinal cell deterioration, which later results in larval disease or mortality due to bacterial proliferation in the hemocoel.
Figure 4. Light microscope observation of G. mellonella larvae infected with B. cereus associated with Cry1C toxin 16 hours after force-feeding. Cross–sections (16 µm) (cresyl violet staining and ethanol and xylene dehydration) with focus on the intestine (midgut). The bacteria appear colored as dark or brighter violet. Different magnifications are shown: (a) 4×; (b)10×; (c) 20×, and (d) 40×. (lum: intestinal lumen; bac: bacteria; gEpi: Gut Epithelium; pm: Peritrophic matrix
RNA extraction and cDNA production
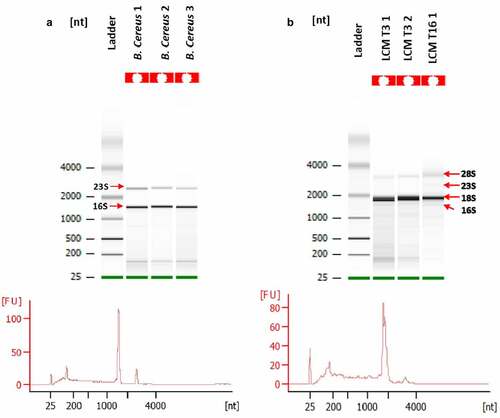
After gathering the collected samples, the quantity and quality of total RNA were assessed. We compared the bioanalyzer results of total RNA (totRNA) collected with LCM to totRNA extracted from a B. cereus planktonic culture stopped at OD600nm = 1 ( and b). Low amount of totRNA was recovered and more inconveniently, the large majority of totRNA was eukaryotic, even though the dissected areas were thoroughly designed to target bacteria and to avoid visible epithelium cells of insect’s gut.
Figure 5. Quality assessment or total RNA (totRNA) samples (Agilent Bioanalyzer). A: totRNA quality of B. cereuscultures; B: totRNA quality of G. mellonella gut infected with B. cereus associated with Cry1C toxin obtained after Laser-Capture Microdissection (LCM) at 3 hours (T3) post force-feeding and 16 hours (T16) post force-feeding. 16S and 23S indicate bacterial ribosomal RNA. 18S and 28S indicate eukaryotic ribosomal RNA
To overcome this very low input of B. cereus total RNA and the presence of eukaryotic RNA, only specific genes were targeted in qPCR after a pre-amplification (PreAmp) step. Target-specific PreAmp is usually performed by multiplex PCR using a predefined primer pool [Citation65]. Thereby, we were able to analyze several target genes from micro-dissected samples. However, the main challenge of the amplification protocol is to preserve the relative transcript levels [Citation39]. Today, several kits are commercialized with very reproducible results. In this study, to validate the PreAmp reliability, two B. cereus housekeeping genes, rpoB and tpi, were chosen. The cDNA analyzed was obtained from mRNA extracted from in vitro cultured B. cereus. For both genes and for two cDNA quantities templates, a Ct gain around 11 Ct was obtained. Indeed, with 50 pg and 0.05 pg cDNA the Ct gain was 11.18 and 10.71 Ct for rpoB respectively and for tpi 11.72 Ct gain was found for 50 pg cDNA and 11.02 Ct for 0.05 pg (). The efficiency and reliability of this kit was therefore established in our conditions with both low-input (50 pg), or very low-input (0.05 pg) of cDNA.
Figure 6. Gene amplification test using two different quantities of cDNA obtained from B. cereus grown in vitro. The cycle threshold (Ct) values are obtained by qPCR for each condition tested are indicated. Difference of Cts (ΔCt) between the control and the pre-amplified (PreAMP) cDNA for each gene and condition are indicated as well. 50 or 0.05 pg: the quantity of cDNA tested in control samples (without pre-amplification); 50 or 0.05 pg PreAMP: the quantity of cDNA tested from PreAMP samples. Each gene exhibits about an 11 Ct gain when preamplified for each quantity tested. Results were obtained from three independent LB cultures and each qPCR analysis was performed with three technical replicates per sample
qPCR expression of iron homeostasis genes from in vitro collected bacteria
Before analyzing the gene expression in vivo, we set up a control measure in order to know how some of the chosen iron homeostasis genes were expressed in vitro, under iron restricted condition. We compared (ΔΔCt) fold change between bacteria collected at mid-log phase growth phase from LB medium and from moderate iron depleted medium (LB + Dip 0.2 mM). The results indicated in Figure S1, show that feuA, entA, fatB were upregulated about 2 fold, asb 1.4 fold and ilsA was 4 fold more upregulated in LB-Dip, compared to LB alone. This indicates that the studied genes, as expected, were more highly expressed in the iron-restricted condition than in iron-rich condition.
qPCR expression of iron homeostasis genes from in vivo collected bacteria
To survey whether genes involved in B. cereus iron homeostasis play a role during gut colonization, we targeted genes that could help to understand the environmental context and physiological stress triggered in B. cereus at both chosen times of host colonization (). The amplification method we performed was thus used to measure B. cereus gene expression at late stage compared to early stage of G. mellonella midgut infection (). The fold change of gene expression at T16 compared to T3 was normalized using three housekeeping genes: rpoB, tpi, and purH. Genes involved in iron homeostasis and controlled or not by Fur (fur appears slightly down-regulated: 0.84 fold change) are down regulated, except feoB, which corresponds to a protein involved in the ferrous (Fe2+) iron transport (1.12 -fold change). Two other genes were overexpressed at T16, hlyII and dps, with expression ratios of 1.86 and 2.60 (fold change) higher, respectively. Interestingly, genes involved in oxidative stress had different behavior. While dps was up-regulated (2.60-fold change), the superoxide dismutase sodA had a level of expression (0.99 -fold change) similar to the early infection stage, and finally the catalase was down-regulated (0.77 -fold change). Also, the genes encoding the virulence factors nheB (non-hemolytic enterotoxin) and inhA2 (metalloprotease), both controlled by the transcriptional activator PlcR, were slightly down regulated (0.74 and 0.80-fold change, respectively). Finally, plcR itself was down regulated (0.65-fold change), as well as the global transcriptional regulator codY (0.50-fold change).
Figure 7. Differential (ΔΔCt) gene expression of B. cereus ATCC 14,579 associated with Cry1C toxin collected at late infection stage (16 hours) compared to early stage (3 hours) post force-feeding in the midgut of germ-free G. mellonella. mRNA extractions were from LCM sections obtained at the two time points. Data are normalized using 3 housekeeping genes (rpoB, tpi, and purH). Error bars indicate the standard deviation of three biological replicates. Secreted virulence factors (inha 2 (metalloprotease), nheB (Non hemolytic enterotoxin); hlyII (hemolysin II); Oxidative stress factors : sodA (superoxidasedismutase); catalase (catalase); dps (ferrtiin–like iron binding protein); Regulators : plcR (virulence regulon transcriptional activator); fur (Ferric uptake regulator (often repressor);codY (Transcriptional repressor). Iron homeostasis factors: isdC (Heme associated transport protein), ilsA (iron regulated leucine–rich protein), feoB (Ferrous iron transport protein); fec (Iron III) dicitrate ABC transporter); fpuA (petrobactin siderophore binding protein); fatB (petrobactin siderophore binding protein); asb (gene from the petrobactin siderophore synthesis locus); feuA (bacillibactin siderophore binding protein); entA (gene from bacillibactin siderophore synthesis locus)
G. mellonella iron homeostasis genes responses
To complete the host-pathogen study, an analysis of the expression of G. mellonella genes identified as important in dealing with iron homeostasis was also conducted. These are the gene encoding the 32 kDa subunit of ferritin, an iron storage and transport protein, and the gene encoding for transferrin, also involved with iron transport protein and considered involved in nutrient immunity. The results () reveal that transcripts of both of these genes are recovered in the lumen of G. mellonella gut. Ferritin is slightly down-regulated at T16 compared to T3 (0.71) while transferrin is slightly upregulated with a 1.68 fold change. The raw Ct values are reported in .
Figure 8. Differential gene expression (ΔΔCt) of two iron related G. mellonella genes. Genes encoding ferritin and transferrin obtained from mRNA at late infection stage (16 hours) compared to early stage (3 hours) in germ-free G. mellonella midgut infected with B. cereus associated with Cry1C toxin. Error bars indicate the standard deviation of three biological replicates
Discussion
The main goal of this study was to achieve an in vivo analysis that could provide additional insight of B. cereus adaptation during intestinal infection, through the help of an insect model. To achieve this, a novel and targeted approach was designed to assess whether well-known genes involved in iron homeostasis, virulence, and adaptation factors were differentially expressed during the intestinal infection process. Indeed, little is known about iron status of entero-pathogenic Gram-positive bacteria in the gut environment: how bacteria adapt in the intestinal lumen, and which bacterial factors are activated when the host cells are damaged. By using the LCM approach, we were able to study in vivo the adaptation of B. cereus during the G. mellonella gut infection, for the first time.
An early stage of infection at 3 hours post-ingestion was chosen, compared to a later stage, at 16 hours. The focus was on genes involved in iron homeostasis; however, other genes known as indicators for specific bacterial metabolic activities were also chosen. Through this approach, an assessment could be made on the bacterial stress in the host environment. Finally, the expression of a few genes encoding virulence factors and two G. mellonella genes involved in host iron homeostasis were also analyzed.
The use of LCM seemed appropriate given the increased interest for this technique to decipher host–pathogen interactions, with respect to microbial aspects [Citation41,Citation42]. Meanwhile, in those papers, the targeted genes were focusing on host responses or identification of microbiota species. To our knowledge, none of these studies were specifically focusing on pathogen gene expression at different time points of gut colonization. Therefore, our study provides evidence for an additional use of LCM for targeted in situ gene expression of an extracellular pathogen.
Numerous kits allowing amplification of low or very-low input RNA from small samples, as well as single cell sequencing methods, have been used and compared to perform RNA sequencing [Citation66,Citation67]. The lack of poly-A tails in prokaryotic RNAs makes it impossible to use an amplification kit based on oligo-dT priming, and therefore reduces the number of available kits for bacteria sampling. Some kits proposing poly-A tailing before amplification have been used in previous studies [Citation52], and adaptation with a poly-A tailing kit before choosing another amplification kit was considered. This was not chosen, as we wanted to avoid an additional step that could bias the analysis. The ratio between total RNA amounts of prokaryotic cells compared to eukaryotic cell signifies an issue. Some techniques, to enrich bacterial mRNA, or to perform RNA sequencing for both bacteria and host cells during infection, have been proposed in that regard [Citation68,Citation69]. Performing RNA sequencing as output of the LCM sampling was too uncertain, since the amount of eukaryotic RNA was much higher compared to the prokaryotic one, with a ratio around 1/1000 in our experiments, as measured by Bioanalyser. These observations indicate the presence of large amount of G. mellonella RNA in the lumen outside the epithelial surface, likely caused by cell apoptosis, gut cell turnover, and cell lysis due to pore forming toxins and proteases [Citation70,Citation71]. Also, these factors, as well as an increased stability or slower turnover of eukaryotic mRNA, compared to the bacterial one, might also be a reason. The qPCR coupled with target-specific pre-amplification used in our study is recognized as a powerful tool to analyze differences in targeted gene expressions [Citation72] starting from a low amount of sample [Citation65]. Therefore, the basis for our analysis should be reliable.
In this study, we hypothesized that the modulation of B. cereus gene expression related to iron homeostasis helps the bacteria to settle during host gut infection. For most of the targeted genes, the expression was down regulated at 16 hours post-infection, compared to the chosen control stage 3 hours post-infection. These results suggest that the apparent lower iron availability at T3 impose higher expression of B. cereus iron-related genes, until the available iron amount in the gut environment is increased, as shown by a lower expression at T16 of iron homeostasis-related genes. Genes involved in iron homeostasis, entA, feuA, fatB, fec, feoB, IlsA, IsdC, (all controlled by Fur), and two Fur-independent genes (fpuA, asb) were thus all down regulated at the later stage of intestinal infection (T16), except feoB, which did not change. It has been previously shown that in vitro, Fur-controlled genes involved in iron uptake are down-regulated in iron replete conditions, except the asb operon, which encodes the siderophore petrobactin [Citation24].
We also performed a control experiment in vitro to be compared with the fold-change values we obtained from the in vivo collected bacteria. Hence, the level of targeted B. cereus gene expression involved in iron homeostasis, from cultures in iron chelated medium, was compared to expression in iron rich Luria-Bertani medium (Figure S1, Table S1 and S3). The results indicated an overall higher expression in iron-chelated medium. Interestingly, the level of differential expression recorded in the in vitro control and in our in vivo study has comparable values (around twofold change). Therefore, these results may underline that iron homeostasis is tightly regulated and that many genes involved in iron uptake and export are continuously expressed at a certain level, in the host gut.
However, the expression of genes does not directly indicate a role in adaptation or virulence. Meanwhile, it was previously shown in G. mellonella mortality tests that the mutant of both entA (first gene of the operon expressing the siderophore bacillibactin synthesis) and ilsA (a ferritin and hemoglobin surface binding protein) conferred less mortality than the Bc ATCC14579 parental strain [Citation15,Citation19] following hemocoel infection. In the present study, both entA and ilsA were expressed in the gut. Hence, we suggest that both bacillibactin and IlsA might take part in bacterial adaptation in the gut and not only after reaching the hemocoel, as was previously suggested for IlsA based on transcriptional fusion between the ilsA promoter and gfp or lacZ plasmid born reporter constructions. Indeed, fluorescence or β-galactosidase activity was only observed in the hemocoel and not in the gut [Citation15,Citation38]; this discrepancy might be due to the higher sensitivity of qPCR analysis. Indeed, only a minor gene expression can result in PCR amplification while the transcriptional promoter reporter fusion requires a certain level of promoter activity and a good stability of the reporter molecules.
In the following discussion, we aim at highlighting the function of other studied factors and associate their expression with host adaptation or host damage. In late infection stage, the upregulation of feoB appears not different from the early stage (1.4 and 1.2 vs. 0.7 for the third). The membrane protein FeoB was identified as a G protein with GTPase activity [Citation73], allowing import of ferrous iron in bacteria [Citation74]. These results suggest that B. cereus can use this system in iron uptake supposing that ferrous iron is present in the insect gut environment.
To prevent damages caused by reactive oxygen species (ROS) released in the environment, bacteria have to use strategies for DNA repair, lipid membranes, or proteins protection [Citation75]. The bacterioferritin Dps is involved in iron storage and protects bacteria from oxidative stress in vivo [Citation76]. In our conditions, this gene harbors the largest positive differential expression at the late stage of infection (T16). It indicates that inside the gut, the oxidative stress is increasing, probably due to host cell degradation, hence releasing molecules of ferrous iron in the environment, which reacts with oxygen to produce reactive oxygen species (ROS) by Fenton reaction. Two other genes were targeted as indicators for oxidative stress inside G. mellonella gut along the infection process: the superoxide dismutase sodA and a catalase gene. It is known that both of these factors are protecting bacteria from ROS, especially superoxide radicals and H2O2 [Citation77], and could be up or down regulated in Gram-positive bacteria depending on the metal released in the environment [Citation78]. Here, while the catalase gene was down-regulated, sodA varied among replicates (1.1, 1.3, and 0.5 – fold change), revealing an expression of almost similar level at the two time points. Therefore, our results do not clearly indicate an increased oxidative stress at late compared to early colonization, but the increased expression of dps tells that at T16 probably more iron is available and storage is needed to prevent damage in B. cereus.
In vivo assays in G. mellonella following injection of B. thuringiensis into the hemolymph were previously performed to study the level of expression of the Hemolysin II (hlyII) and its importance in virulence [Citation71,Citation79]. To our knowledge, hlyII expression has not been tested during oral infection in G. mellonella. In our study, hlyII is overexpressed in late infection stage compared to the beginning of infection. This gene is under control of its own regulator HlyIIR, and the major iron regulator Fur [Citation22,Citation80]. HlyII expression is induced in the hemocoel with low iron and glucose availability [Citation71,Citation81] allowing the bacteria to access nutrients and promoting growth by degrading host phagocytes and erythrocytes [Citation82]. Even though fur is slightly down regulated at T16, the bacteria are still expressing hlyII when they are close to the epithelium cells. The resulting enterocyte cell lysis may then provide nutrients for the bacteria. The pore-forming activity of HlyII on G. mellonella gut cells remains to be studied, but one might speculate that the increased production of HlyII resulting in gut cell damage would release ferrous iron, which could be imported by the Feo system, as known for Gram negative enterobacteria [Citation16].
It was earlier published that the metalloprotease InhA2 has a role in B. thuringiensis virulence following oral infection of G. mellonella, most likely to help to cross the gut barrier [Citation83]. Our results show that expression of inhA2 is slightly decreased at late infection stage compared to early infection stage (fold change: 0.8). These results indicate that the epithelium degradation probably started early during infection. Interestingly, the gene encoding its transcriptional activator, PlcR, is also down regulated at T16. PlcR is known to be a sensor for certain environmental factors expressed in vitro at the early stationary phase [Citation84]. The expression of PlcR regulated genes during G. mellonella gut infection was expected since the PlcR regulon is important for full virulence of B. thuringiensis and B. cereus, following oral infection in G. mellonella [Citation37]. Furthermore, studies focusing on the activation of the PlcR-PapR quorum sensor system in another insect indicate that PlcR-PapR dependent genes should be activated in vivo [Citation85].
Although this study was designed to decipher variations in bacterial gene expression, we also looked at host ferritin and transferrin gene transcripts. These proteins have major roles in host iron homeostasis, but also in response to infections [Citation64]. Ferritin serves in insects as both storage and transport for thousands of Fe3+ iron and transferrin for transport and delivery of Fe2+ to the host cell [Citation54]. These molecules are also considered as host immune response effectors and are therefore expressed as soon as the host encounters a pathogen. In our analysis, we can simply state that we observe expression of the genes encoding transferrin and ferritin at both time points in the presence of the pathogen. Hence, further work is required, especially with non-infected larvae to enlarge the knowledge on host responses modulation with and without intestinal pathogens and intestinal microbiota.
In conclusion, this study set up a model giving a new insight to B. cereus colonization and in vivo and in situ adaptation during gut infection. We demonstrate that this challenging LCM approach is feasible to investigate bacterial gene expression, even with a low amount of bacterial RNA collected. Genes involved in iron homeostasis could play a key role for bacterial colonization and development inside the gut, since these genes are expressed at both early and later gut colonization. However, the relative roles of the encoded factors remain to be studied for several of them. Furthermore, this study is opening perspectives for larger transcriptome analyses for both bacteria and the host in order to get a host pathogen crosstalk analysis. G. mellonella is largely used as an alternative to mammalian models of infection at the innate cellular and humoral defense level [Citation34]. We show here that it is also useful for in-depth study of pathogenic gut bacteria. Moreover, the possibility to use germ-free G. mellonella larvae makes this infection model even more attractive and could reduce the number of experimental mammals. Only few studies using mammals to explore B. cereus virulence and gene expression or toxin detection are available [Citation9,Citation86,Citation87]; whether the observation here performed in G. mellonella is reliable for B. cereus mammal intestinal infection remains open. Nevertheless, this study shows the expression of the enterotoxin component NheB in a gut environment and it would be interesting to analyze the expression of other B.cereus enterotoxins as well.
Supplemental Material
Download Zip (707 KB)Acknowledgments
This work was supported by INRAE, MICA department and partly funded by the CryMuc Project 11-MERES-RISKOGM-3-CVS-59 Ministry of Environmental affairs. L. Consentino received a three-year PhD doctoral MRT grant from the ministry of French higher education, delivered from Doctoral School ABIES at AgroParisTech –University Paris Saclay. The authors thank Christophe Buisson for help with the insect force-feeding experiments and Jennifer Upfold for final English proofreading. The authors are also thankful for the many valuable comments from anonymous reviewers.
Disclosure statement
No potential conflict of interest was reported by the authors.
Supplementary material
Supplemental data for this article can be accessed here
Additional information
Funding
References
- Andrews SC, Robinson AK, Rodríguez-Quiñones F. Bacterial iron homeostasis. FEMS Microbiol Rev. 2003;27(2–3):215–237.
- Touati D. MINIREVIEW iron and oxidative stress in bacteria 1. Arch Biochem Biophys. 2000;373(1):1–6.
- Bradley JM, Le Brun NE, Moore GR. Ferritins: furnishing proteins with iron topical issue in honor of R.J.P. Williams. JBIC Journal of Biological Inorganic Chemistry. 2016;21(1):13–28.
- Nairz M, Schroll A, Sonnweber T, et al. The struggle for iron - a metal at the host-pathogen interface. Cell Microbiol. 2010;12(12):1691–1702.
- Nobles CL, Maresso AW. The theft of host heme by Gram-positive pathogenic bacteria. Metallomics. 2011;3(8):788–796.
- Sheldon JR, Heinrichs DE, Whitfield C. Recent developments in understanding the iron acquisition strategies of gram positive pathogens. FEMS Microbiol Rev. 2015;39(4):592–630.
- Liu Z, Reba S, Chen W-D, et al. Regulation of mammalian siderophore 2,5-DHBA in the innate immune response to infection. J Exp Med. 2014;211(6):1197–1213.
- Glasset B, Herbin S, Guillier L, et al. Bacillus cereus-induced food-borne outbreaks in France, 2007 to 2014: epidemiology and genetic characterisation. Eurosurveillance. 2016;21(48):48.
- Stenfors Arnesen LP, Fagerlund A, Granum PE. From soil to gut: bacillus cereus and its food poisoning toxins. FEMS Microbiol Rev. 2008;32(4):579–606.
- Bhandari V, Ahmod NZ, Shah HN, et al. Molecular signatures for Bacillus species: demarcation of the Bacillus subtilis and Bacillus cereus clades in molecular terms and proposal to limit the placement of new species into the genus Bacillus. Int J Syst Evol Microbiol. 2013;63(PART7):2712–2726.
- Ehling-Schulz M, Lereclus D, Koehler TM. The Bacillus cereus group: bacillus species with pathogenic potential. Microbiol Spectr. 2019;7(3):1–35.
- Guinebretière M-H, Thompson FL, Sorokin A, et al. Ecological diversification in the Bacillus cereus Group. Environ Microbiol. 2008;10(4):851–865.
- Ivanova N, Sorokin A, Anderson I, et al. Genome sequence of Bacillus cereus and comparative analysis with Bacillus anthracis. Nature. 2003;423(6935):87–91.
- Abi-Khalil E, Segond D, Terpstra T, et al. Heme interplay between IlsA and IsdC: two structurally different surface proteins from Bacillus cereus. Biochim Biophys Acta. 2015;1850(9):1930–1941.
- Daou N, Buisson C, Gohar M, et al. IlsA, a unique surface protein of Bacillus cereus required for iron acquisition from heme, hemoglobin and ferritin. PLoS Pathog. 2009;5(11):11.
- Lau CKY, Krewulak KD, Vogel HJ. Bacterial ferrous iron transport: the Feo system. FEMS Microbiol Rev. 2016;40(2):273–298.
- Braun V, Hantke K. Recent insights into iron import by bacteria. Curr Opin Chem Biol. 2011;15(2):328–334.
- Hotta K, Kim C-Y, Fox DT, et al. Siderophore-mediated iron acquisition in Bacillus anthracis and related strains. Microbiology. 2010;156(7):1918–1925.
- Segond D, Abi Khalil E, Buisson C, et al. Iron acquisition in bacillus cereus: the roles of IlsA and bacillibactin in exogenous ferritin iron mobilization. PLoS Pathog. 2014;10(2):2.
- Zawadzka AM, Abergel RJ, Nichiporuk R, et al. Siderophore-mediated iron acquisition systems in bacillus cereus: identification of receptors for anthrax virulence-associated petrobactin. Biochemistry. 2009;48(16):3645–3657.
- Fillat MF. The fur (ferric uptake regulator) superfamily: diversity and versatility of key transcriptional regulators. Arch Biochem Biophys. 2014;546:41–52.
- Harvie DR, Ellar DJ. A ferric dicitrate uptake system is required for the full virulence of Bacillus cereus. Curr Microbiol. 2005;50(5):246–250.
- Porcheron G, Dozois CM. Interplay between iron homeostasis and virulence: fur and RyhB as major regulators of bacterial pathogenicity. Vet Microbiol. 2015;179(1–2):2–14.
- Hayrapetyan H, Siezen R, Abee T, et al. Comparative genomics of iron-transporting systems in Bacillus cereus strains and impact of iron sources on growth and biofilm formation. Front Microbiol. 2016;7(JUN):1–13.
- Pi H, Jones SA, Mercer LE, et al. Role of catecholate siderophores in Gram-Negative bacterial colonization of the mouse gut. PLoS ONE. 2012;7(11):1–8.
- Watts RE, Totsika M, Challinor VL, et al. Contribution of siderophore systems to growth and urinary tract colonization of asymptomatic bacteriuria escherichia coli. Infect Immun. 2012;80(1):333–344.
- Costa LF, Mol JPS, Silva APC, et al. Iron acquisition pathways and colonization of the inflamed intestine by Salmonella enterica serovar Typhimurium. Int J Med Microbiol. 2016;306(8):604–610.
- Deriu E, Liu JZ, Pezeshki M, et al. Probiotic bacteria reduce salmonella typhimurium intestinal colonization by competing for iron. Cell Host Microbe. 2013;14(1):26–37.
- Deschemin J-C, Noordine M-L, Remot A, et al. The microbiota shifts the iron sensing of intestinal cells. The FASEB Journal. 2016;30(1):252–261.
- Sassone-Corsi M, Chairatana P, Zheng T, et al. Siderophore-based immunization strategy to inhibit growth of enteric pathogens. Proc Natl Acad Sci U S A. 2016;113(47):13462–13467.
- Mikonranta L, Dickel F, Mappes J, et al. Lepidopteran species have a variety of defence strategies against bacterial infections. J Invertebr Pathol. 2017;144:88–96.
- Ramarao N, Nielsen-Leroux C, Lereclus D. The insect Galleria mellonella as a powerful infection model to investigate bacterial pathogenesis. J Vis Exp. 2012;70:1–7.
- Senior NJ, Bagnall MC, Champion OL, et al. Galleria mellonella as an infection model for campylobacter jejuni virulence. J Med Microbiol. 2011;60(5):661–669.
- Tsai CJ-Y, Loh, Proft T. Galleria mellonella infection models for the study of bacterial diseases and for Jacelyn Mei San.antimicrobial drug testing. Virulence. 2016;7(3):214–229.
- Fedhila S, Buisson C, Dussurget O, et al. Comparative analysis of the virulence of invertebrate and mammalian pathogenic bacteria in the oral insect infection model Galleria mellonella. J Invertebr Pathol. 2010;103(1):24–29.
- Mukherjee K, Raju R, Fischer R, et al. Galleria Mellonella as a model host to study gut microbe homeostasis and brain infection by the human pathogen listeria monocytogenes. Adv Biochem Eng Biotechnol. 2013;135. DOI:10.1007/10_2013_203.
- Salamitou S, Ramisse F, Brehelin M, et al. The plcR regulon is involved in the opportunistic properties of Bacillus thuringiensis and Bacillus cereus in mice and insects. Microbiology. 2000;146(11):2825–2832.
- Fedhila S, Daou N, Lereclus D, et al. Identification of Bacillus cereus internalin and other candidate virulence genes specifically induced during oral infection in insects. Mol Microbiol. 2006;62(2):339–355.
- Bevilacqua C, Ducos B. Laser microdissection: a powerful tool for genomics at cell level. Mol Aspects Med. 2018;59:5–27.
- Espina V, Wulfkuhle JD, Calvert VS, et al. Laser-capture microdissection. Nat Protoc. 2006;1(2):586–603.
- Hooper LV. Laser microdissection: exploring host–bacterial encounters at the front lines. Curr Opin Microbiol. 2004;7(3):290–295.
- Podgorny OV, Lazarev VN. Laser microdissection: a promising tool for exploring microorganisms and their interactions with hosts. J Microbiol Methods. 2017;138:82–92.
- Domazet B, Maclennan GT, Lopez-Beltran A, et al. Laser capture microdissection in the genomic and proteomic era: targeting the genetic basis of cancer. Int J Clin Exp Pathol. 2008;1(6):475–488.
- Emmert-Buck MR, Bonner RF, Smith PD, et al. Laser capture microdissection. Science. 1996;274(5289):998–1001.
- Legres LG, Janin A, Masselon C, et al. Beyond laser microdissection technology: follow the yellow brick road for cancer research. Am J Cancer Res. 2014;4(1):1–28.
- De Hertogh G, Lemmens B, Verhasselt P, et al. Assessment of the microbiota in microdissected tissues of Crohn’s disease patients. Int J Inflam. 2012. DOI:10.1155/2012/505674
- Lavelle A, Lennon G, O’Sullivan O, et al. Spatial variation of the colonic microbiota in patients with ulcerative colitis and control volunteers. Gut. 2015;64(10):1553–1561.
- Nava GM, Friedrichsen HJ, Stappenbeck TS. Spatial organization of intestinal microbiota in the mouse ascending colon. The ISME Journal. 2011;5(4):627–638.
- Chowdhury SR, King DE, Willing BP, et al. Transcriptome profiling of the small intestinal epithelium in germfree versus conventional piglets. BMC Genomics. 2007;8(1):215.
- Vannucci FA, Foster DN, Gebhart CJ. Laser microdissection coupled with RNA-seq analysis of porcine enterocytes infected with an obligate intracellular pathogen (Lawsonia intracellularis). BMC Genomics. 2013;14(1):1.
- Ramsay K, Jones MICHAELGK, Wang Z. Laser capture microdissection: a novel approach to microanalysis of plant-microbe interactions. Mol Plant Pathol. 2006;7(5):429–435.
- Roux B, Rodde N, Jardinaud M-F, et al. An integrated analysis of plant and bacterial gene expression in symbiotic root nodules using laser-capture microdissection coupled to RNA sequencing. The Plant Journal. 2014;77(6):817–837.
- Kim BY, Lee KS, Yoon HJ, et al. Expression profile of the iron-binding proteins transferrin and ferritin heavy chain subunit in the bumblebee Bombus ignitus. Comparative Biochemistry and Physiology Part B: Biochemistry and Molecular Biology. 2009;153(2):165–170.
- Tang X, Zhou B. Iron homeostasis in insects: insights from Drosophila studies. IUBMB Life. 2013;65(10):863–872.
- Wojda I. Immunity of the greater wax moth Galleria mellonella. Insect Sci. 2017;24(3):342–357.
- Gélis-Jeanvoine S, Canette A, Gohar M, et al. Genetic and functional analyses of krs, a locus encoding kurstakin, a lipopeptide produced by Bacillus thuringiensis. Res Microbiol. 2017;168(4):356–368.
- Réjasse A, Gilois N, Barbosa I, et al. Temperature-dependent production of various PlcR-controlled virulence factors in Bacillus weihenstephanensis strain KBAB4. Appl Environ Microbiol. 2012;78(8):2553–2561.
- Bouillaut L, Ramarao N, Buisson C, et al. FlhA influences bacillus thuringiensis PlcR-regulated gene transcription, protein production, and virulence. Applied and Environmental Microbiology. 2005;71(12):8903–8910.
- Qin J, Tong Z, Zhan Y, et al. A Bacillus thuringiensis chitin-binding protein is involved in insect peritrophic matrix adhesion and takes part in the infection process. Toxins (Basel). 2020;12(4):4.
- Bevilacqua C, Makhzami S, Helbling JC, et al. Maintaining RNA integrity in a homogeneous population of mammary epithelial cells isolated by laser capture microdissection. BMC Cell Biol. 2010;11:1–13.
- Bonnet A, Bevilacqua C, Benne F, et al. Transcriptome profiling of sheep granulosa cells and oocytes during early follicular development obtained by Laser Capture Microdissection. BMC Genomics. 2011;12(1):417.
- Schroeder A, Mueller O, Stocker S, et al. The RIN: an RNA integrity number for assigning integrity values to RNA measurements. BMC Mol Biol. 2006;7(1):1–14.
- Kim BS, Lee CS, Seol JY, et al. Cloning and expression of 32 kDa ferritin from Galleria mellonella. Arch Insect Biochem Physiol. 2002;51(2):80–90.
- Dubovskiy IM, Grizanova EV, Whitten MMA, et al. Immuno-physiological adaptations confer wax moth Galleria mellonella resistance to Bacillus thuringiensis. Virulence. 2016;7(8):860–870.
- Andersson D, Akrap N, Svec D, et al. Properties of targeted preamplification in DNA and cDNA quantification. Expert Rev Mol Diagn. 2015;15(8):1085–1100.
- Shanker S, Paulson A, Edenberg HJ, et al. Evaluation of commercially available RNA amplification kits for RNA sequencing using very low input amounts of total RNA. Journal of Biomolecular Techniques : JBT. 2015;26(1):4–18.
- Ziegenhain C, Vieth B, Parekh S, et al. Comparative analysis of single-cell RNA sequencing methods. Mol Cell. 2017;65(4):631–643.e4.
- Kumar N, Lin M, Zhao X, et al. Efficient enrichment of bacterial mRNA from host-bacteria total RNA samples. Sci Rep. 2016;6(1):1–10.
- Westermann AJ, Gorski SA, Vogel J. Dual RNA-seq of pathogen and host. Nature Rev Microbiol. 2012;10(9):618–630.
- Fedhila S, Nel P, Lereclus D. The InhA2 metalloprotease of bacillus thuringiensis strain 407 is required for pathogenicity in insects infected via the oral route. J Bacteriol. 2002;184(12):3296–3304.
- Tran S-L, Guillemet E, Lereclus D, et al. Iron regulates Bacillus thuringiensis haemolysin hlyII gene expression during insect infection. J Invertebr Pathol. 2013;113(3):205–208.
- Regier N, Frey B. Experimental comparison of relative RT-qPCR quantification approaches for gene expression studies in poplar. BMC Mol Biol. 2010;11. DOI:10.1186/1471-2199-11-57.
- Marlovits TC, Haase W, Herrmann C, et al. The membrane protein FeoB contains an intramolecular G protein essential for Fe(II) uptake in bacteria. Proc Natl Acad Sci U S A. 2002;99(25):16243–16248.
- Kim H, Lee H, Shin D. The FeoA protein is necessary for the FeoB transporter to import ferrous iron. Biochem Biophys Res Commun. 2012;423(4):733–738.
- Ezraty B, Gennaris A, Barras F, et al. Oxidative stress, protein damage and repair in bacteria. Nature Rev Microbiol. 2017;15(7):385–396.
- Karas VO, Westerlaken I, Meyer AS. The DNA-binding protein from starved cells (Dps) utilizes dual functions to defend cells against multiple stresses. J Bacteriol. 2015;197(19):3206–3215.
- Valko M, Morris H, Cronin M. Metals, toxicity and oxidative stress. <![CDATA[Current Medicinal Chemistry]]>. 2005;12(10):1161–1208.
- Behera M, Dandapat J, Rath CC. Effect of heavy metals on growth response and antioxidant defense protection in Bacillus cereus. J Basic Microbiol. 2014;54(11):1201–1209.
- Cadot C, Tran S-L, Vignaud M-L, et al. InhA1, NprA, and HlyII as candidates for markers to differentiate pathogenic from nonpathogenic bacillus cereus strains. J Clin Microbiol. 2010;48(4):1358–1365.
- Sineva E, Shadrin A, Rodikova EA, et al. Iron regulates expression of Bacillus cereus Hemolysin II via global regulator Fur. J Bacteriol. 2012;194(13):3327–3335.
- Guillemet E, Tran S-L, Cadot C, et al. Glucose 6P Binds and Activates HlyIIR to Repress Bacillus cereus Haemolysin HlyII Gene Expression. PLoS ONE. 2013;8(2):1–10.
- Tran S-L, Ramarao N. Bacillus cereus immune escape: a journey within macrophages. FEMS Microbiol Lett. 2013;347(1):1–6.
- Fedhila S, Gohar M, Slamti L, et al. The Bacillus thuringiensis PlcR-Regulated Gene inhA2 Is Necessary, but Not Sufficient, for Virulence. J Bacteriol. 2003;185(9):2820–2825.
- Gohar M, Faegri K, Perchat S, et al. The PlcR virulence regulon of Bacillus cereus. PLoS ONE. 2008;3(7):1–9.
- Zhou L, Slamti L, Lereclus D, et al. Optimal response to quorum-sensing signals varies in different host environments with different pathogen group size. mBio. 2020;11(3):e00535–20.
- Rolny IS, Minnaard J, Racedo SM, et al. Murine model of Bacillus cereus gastrointestinal infection. J Med Microbiol. 2014;63(12):1741–1749.
- Wilcks A, Hansen BM, Hendriksen NB, et al. Fate and effect of ingested Bacillus cereus spores and vegetative cells in the intestinal tract of human-flora-associated rats. FEMS Immunol Med Microbiol. 2006;46(1):70–77.