
 ?Mathematical formulae have been encoded as MathML and are displayed in this HTML version using MathJax in order to improve their display. Uncheck the box to turn MathJax off. This feature requires Javascript. Click on a formula to zoom.
ABSTRACT
The relation between religiosity and well-being is one of the most researched topics in the psychology of religion, yet the directionality and robustness of the effect remains debated. Here, we adopted a many-analysts approach to assess the robustness of this relation based on a new cross-cultural dataset ( participants from 24 countries). We recruited 120 analysis teams to investigate (1) whether religious people self-report higher well-being, and (2) whether the relation between religiosity and self-reported well-being depends on perceived cultural norms of religion (i.e., whether it is considered normal and desirable to be religious in a given country). In a two-stage procedure, the teams first created an analysis plan and then executed their planned analysis on the data. For the first research question, all but 3 teams reported positive effect sizes with credible/confidence intervals excluding zero (median reported
). For the second research question, this was the case for 65% of the teams (median reported
). While most teams applied (multilevel) linear regression models, there was considerable variability in the choice of items used to construct the independent variables, the dependent variable, and the included covariates.
KEYWORDS:
1. Introduction
The relation between religion and well-being has been a topic of debate for centuries. While Freud considered religion a “universal obsessional neurosis” and Nietzsche called Christianity “the greatest misfortune of humanity,” the recent scientific literature has painted a more positive picture of religion's effect on (mental) health (e.g., Gebauer et al., Citation2017; George et al., Citation2002; Koenig & Larson, Citation2001; Plante & Sherman, Citation2001; Seybold & Hill, Citation2001; Thoresen, Citation1999; Zimmer et al., Citation2016). Individual religiosity has, for instance, been related to less depression (Smith et al., Citation2003), more happiness (Abdel-Khalek, Citation2006; Lewis & Cruise, Citation2006), higher life satisfaction (Lim & Putnam, Citation2010), and even lower mortality (Ebert et al., Citation2020; Stavrova, Citation2015). At the same time, the robustness, universality, and methodological specificity of the religion—well-being relation remains an outstanding question. In this project, we adopted a many-analysts approach to investigate two research questions using a new large cross-cultural dataset featuring participants from 24 countries. Specifically, we recruited 120 teams to conduct analyzes in order to answer the following two research questions: (1) “Do religious people self-report greater well-being?,” and (2) “Does the relation between religiosity and self-reported well-being depend on perceived cultural norms regarding religion?.” In the subsequent sections, we will first introduce our theoretical framework, dataset, and the many-analysts approach, before describing the key results with respect to the stated research questions and the varying approaches taken by the many-analysts teams. A general discussion of the project and the results is included in the closing article (CitationHoogeveen et al., Citation2022).
1.1. Theoretical background
The literature on the psychology of religion is replete with positive correlations between (self-rated) religiosity and mental health (Abdel-Khalek, Citation2006; George et al., Citation2002; Koenig & Larson, Citation2001; Plante & Sherman, Citation2001; Seybold & Hill, Citation2001; Smith et al., Citation2003; Thoresen, Citation1999; Zimmer et al., Citation2016; see Koenig, Citation2009 for a review). At the same time, meta-analyzes indicate that the relation between religion and well-being is often small (around r = .1; Bergin, Citation1983; Hackney & Sanders, Citation2003; Koenig & Larson, Citation2001). In addition, it has been argued that positive associations are found only for particular measures and operationalizations of these constructs (Hackney & Sanders, Citation2003; Poloma & Pendleton, Citation1989). A recent meta-analysis of longitudinal studies reported that, out of eight religiosity/spirituality measures, only participation in public religious activities and the importance of religion were statistically significantly related to self-rated mental health, which was operationalized as distress, life satisfaction, well-being, and quality of life (Garssen et al., Citation2020).
Furthermore, the type of religiosity (i.e., intrinsic vs. extrinsic; positive vs. negative religious coping) and religious status (religious vs. uncertain) appear to moderate the relationship between religion and mental well-being (Smith et al., Citation2003; Villani et al., Citation2019). For instance, extrinsic religious orientation (i.e., when people primarily use their religious community as a social network, whereas personal religious beliefs are secondary) and negative religious coping (i.e., when people have internal religious guilt or doubts) have been shown to be negatively related to well-being (Abu-Raiya, Citation2013; Weber & Pargament, Citation2014). Yet other research suggests that it is precisely the social aspect of religious service attendance and congregational friendships that explains how religiosity is positively associated with life satisfaction (Lim & Putnam, Citation2010). Moreover, the direction of the religiosity—mental health relation remains unclear; while engaging in religious activities might make people happier, people with better mental health might also be more likely to engage in public, social events.
Additionally, there is large variability in the extent to which religion is ingrained in culture and social identity across the globe (Kelley & de Graaf, Citation1997; Ruiter & van Tubergen, Citation2009). Accordingly, when investigating the association between religiosity and well-being, it may be necessary to take into account the cultural norms related to religiosity within a society. Being religious may contribute to self-rated health and happiness when being religious is perceived to be a socially expected and desirable option (Diener et al., Citation2011; Ebert et al., Citation2020; Gebauer et al., Citation2017; Stavrova, Citation2015; Stavrova et al., Citation2013). This makes sense from the literature on person-culture fit (Dressler et al., Citation2007): a high person-culture fit indicates good agreement between one's personal values and beliefs and the beliefs that are shared by one's surrounding culture. A fruitful way to measure cultural norms is through the shared, intersubjective perception of the beliefs and attitudes that are prevalent in a society (Chiu et al., Citation2010; Zou et al., Citation2009). Intersubjective norms of religiosity, for instance, refer to the shared perception of the importance of religion within a society or culture. Rather than expressing the importance of religious beliefs and behaviors in one's own personal life, intersubjective norms of religiosity (henceforth: cultural norms of religiosity) uncover the perceived importance of religious beliefs and behaviors for the average person within a culture. Religious individuals may be more likely to benefit from being religious when their convictions and behaviors align with perceived cultural norms. For countries in which religion is more trivial or even stigmatized, the relation between religiosity and well-being may be absent or even reversed. Relatedly, in secular countries, religion might be practiced relatively often by minority groups, which has been shown to attenuate the positive association between religious involvement and well-being (Hayward & Elliott, Citation2014; Huijts & Kraaykamp, Citation2011; May & Smilde, Citation2016; Okulicz-Kozaryn, Citation2010).
1.2. A many-analysts approach
In the current project, we aim to shed light on the association between religion and well-being and the extent to which different theoretically- or methodologically-motivated analytic choices affect the results. To this end, we initiated a many-analysts project, in which several independent analysis teams analyze the same dataset in order to answer a specific research question (e.g., Bastiaansen et al., Citation2020; Boehm et al., Citation2018; Botvinik-Nezer et al., Citation2020; Silberzahn & Uhlmann, Citation2015; van Dongen et al., Citation2019). A many-analysts approach has been proposed as a way to mitigate the influence of individual-researcher biases (e.g., confirmation bias by the proponent of a theory or disconfirmation bias by the skeptic), especially since the analysis teams are not typically invested in the outcome. More generally, a many-analysts study is arguable less vulnerable to publication bias toward publishing only significant rather than null results, which may lower the (unconscious) tendency toward p-hacking by individual analysts. A many-analysts approach can balance out the effects of researcher bias while still allowing for expertize-based analytic decisions such as reasonable preprocessing steps, variable exclusion, and model specification. As such, it enables one to assess the robustness of outcomes and quantify variability based on theory-driven analysis decisions and plausible statistical models. Specifically, we believe that the more consistent the results from different analysis teams are, the more confident we can be in the conclusions we draw from the results. A many-analysts approach may be preferable to an exhaustive multiverse analysis (Steegen et al., Citation2016) that might simply include the full spectrum of options, including those that are theoretically and methodologically unrealistic.
The idea of inviting different analysis teams to answer the same research question using the same data is relatively novel (Silberzahn & Uhlmann, Citation2015; see Aczel et al., Citation2021 for general guidelines); we are aware of three papers in neuroscience (Botvinik-Nezer et al., Citation2020; Fillard et al., Citation2011; Maier-Hein et al., Citation2017), one in microeconomics (Huntington-Klein et al., Citation2021), and eight in psychology, three of which pertain to cognitive modeling (Boehm et al., Citation2018; Dutilh et al., Citation2019; Starns et al., Citation2019) while the remaining five are from other fields of psychology (Bastiaansen et al., Citation2020; Salganik et al., Citation2020; Schweinsberg et al., Citation2021; Silberzahn et al., Citation2018; van Dongen et al., Citation2019). Most similar to the current work are the projects that applied a many-analysts approach to perform statistical inference on the relation between two variables, such as skin color and red cards in soccer (Silberzahn et al., Citation2018), scientist gender and verbosity (Schweinsberg et al., Citation2021), or amygdala activity and stress (van Dongen et al., Citation2019). While the exact focus of previous many-analysts projects varied (e.g., experience sampling, fMRI preprocessing, predictive modeling, proof of the many-analysts concept), the take-home messages were rather consistent: all papers showed that different yet equally justifiable analytic choices result in very different outcomes, sometimes with statistically significant effects in opposite directions (e.g., Schweinsberg et al., Citation2021; Silberzahn et al., Citation2018). In addition, it has proved difficult to pinpoint the exact sources of variability due to the fact that analytic approaches differed in many respects simultaneously (e.g., exclusion criteria, inclusion of covariates etc.). Nevertheless, the outcomes of these previous projects suggest that choices of statistical model (Silberzahn et al., Citation2018), statistical framework (van Dongen et al., Citation2019), (pre)processing software (Botvinik-Nezer et al., Citation2020), and the variables themselves (Schweinsberg et al., Citation2021) exert substantial effects on the results and conclusions.
We believe a many-analysts approach is uniquely suited to address various concerns in the study of religion and well-being. First, the relation between religion and health has been researched for decades with hundreds of qualitative reports, cross-sectional and longitudinal studies, and even randomized controlled trials with religious/spiritual interventions for mental health issues (Captari et al., Citation2018; Harris et al., Citation2018; Koenig et al., Citation2020; Rosmarin et al., Citation2010). Yet new studies keep emerging (e.g., Chang et al., Citation2021; Luo & Chen, Citation2021; Simkin, Citation2020) and the debate seems far from settled (see for instance the recent special issue in the International Journal for the Psychology of Religion; van Elk, Citation2021). Second, both “religion” and “well-being” are broad and multifaceted constructs that are sensitive to different measures and operationalizations, which might result in both quantitatively and qualitatively different conclusions (Hackney & Sanders, Citation2003; Poloma & Pendleton, Citation1989). Third, the standard way to assess robustness of an effect or association is often through meta-analysis, but the fragmentation of the literature on the religion—health link and methodological heterogeneity between studies challenge the use and validity of meta-analyzes in this domain (Koenig et al., Citation2021). In general, meta-analyzes may suffer from several drawbacks such as publication bias and sensitivity to arbitrary methodological choices (e.g., different meta-analytic techniques can result in different conclusions; de Vrieze, Citation2018; van Elk et al., Citation2015). Moreover, the estimated effect sizes in meta-analyzes might be as much as three times larger than in preregistered multiple-site replication studies (Kvarven et al., Citation2020). Fourth, the discussion on the potential health-benefits of religion has been muddied by concerns about researcher interests and biases. That is, it has been argued that scholars of religion might be biased by their own (religious) beliefs (Ladd & Messick, Citation2016; Swigart et al., Citation2020; Wulff, Citation1998) or by the fact that a substantial amount of research in the science of religion is funded by religiously-oriented organizations such as the John Templeton Foundation (Bains, Citation2011; Wiebe, Citation2009).Footnote1 Inviting independent analysts from various backgrounds including but not restricted to religious studies attenuates this potential concern. Moreover, in addition to quantifying variability, with a sufficiently large number of analysis teams one can also investigate factors that might explain observed variability, such as those related to theoretical or methodological expertize and prior beliefs (Aczel et al., Citation2021).Footnote2
In addition to the theoretical rationale for using a many-analysts approach to answer the research questions at hand, we also consider the current dataset particularly appropriate for such an approach. That is, the complexity of the data allows for many justifiable choices for the operationalization of the variables and the statistical approach to be employed. While the questions posed to the participants in the cross-cultural study could no longer be changed, the specific method of derivation for the religiosity and well-being scores was at the discretion of the many analysts. At the same time, the research questions and data structure (cross-sectional correlational data) were sufficiently intuitive and manageable to inspire many researchers in the fields of (social) psychology, religious studies, health science, and general methodology to propose an analysis.
Finally, we believe that our project involves a combination of elements that extend existing many-analysts work. First, we collected new data for this project with the aim to provide new evidence for the research questions of interest, as opposed to using an existing dataset that has been analyzed before. Second, we targeted both researchers interested in methodology and open science, as well as researchers from the field of the scientific study of religion and health to encourage both methodologically sound and theoretically relevant decisions (see the section “Analysis teams”). Third, in comparison to previous many-analysts projects in psychology, the current project includes a lot of teams (i.e., 120 vs. 4, 12, 14, 17, 27, 29, and 70 teams, though note that a machine learning project included 160 analyst teams; Salganik et al., Citation2020). Fourth, we applied a two-step procedure that ensured a purely confirmatory status of the analyzes: in stage 1, all teams first either completed a preregistration or specified an analysis pipeline based on a blinded version of the data. After submitting the plan to the OSF, teams received the real data and executed their planned analyzes in stage 2 (see Sarafoglou et al., Citation2022 for more details on and an empirical investigation of preregistration vs. data blinding based on the present data). Fifth, the many-analysts approach itself was preregistered prior to cross-cultural data collection (see osf.io/xg8y5), although the details of the processing and analysis of the many-analysts data were not preregistered.
1.3. The dataset
The dataset provided to the analysts featured data from participants from 24 countries collected in 2019. The data were collected as part of the cross-cultural religious replication project (see also Hoogeveen et al., Citation2021; Hoogeveen & van Elk, Citation2018). The dataset contained measures of religiosity, well-being, perceived cultural norms of religion, as well as some demographic items. The full dataset, the data documentation file, and original questionnaire can be found on the OSF project page (osf.io/qbdce/).
1.3.1. Participants
Participants were recruited from university student samples, from personal networks, and from (demographically representative) samples accessed by panel agencies and online platforms (MTurk, Kieskompas, Sojump, TurkPrime, Lancers, Qualtrics panels, Crowdpanel, and Prolific). Participants were compensated for participation by financial remuneration, the possibility for a reward through a raffle, course credits, or received no compensation. Everyone aged 18 years or above could participate.Footnote3 Participants were required to answer all multiple choice questions, and hence there were no missing data (except for 36 people who did not provide a numeric age and 995 people who chose not to answer the item on sexual satisfaction, as this was the only item for which participants were not required to provide an answer.) The countries were convenience-sampled (i.e., through personal networks), but were selected to cover six continents and include different ethnic and religious majorities. The final sample included individuals who identified as Christian (), Muslim (
), Hindu (
), Buddhist (
), Jewish (
), or were part of another religious group (
). Finally,
of participants did not identify with any religion. See Tables and in Appendix 1 for the full descriptive statistics of the dataset.
1.3.2. Measures
Personal religiosity was measured using nine standardized self-report items taken from the World Values Survey (WVS; World Values Survey, Citation2010), covering religious behaviors (institutionalized such as church attendance and private such as prayer/meditation), beliefs, identification, values, and denomination. The well-being measure consisted of 18 self-report items from the validated short version of Quality of Life scale, as used by the World Health Organization (WHOQOL-BREF; WHOQOL Group, Citation1998). Included items cover general health and well-being, as well as the domains of physical health, psychological health and social relationships. Specific items evaluated: the quality of life in general, and satisfaction of overall health (general); pain, energy, sleep, mobility, activities, dependence on medication, and work capability (physical domain); life enjoyment, concentration, self-esteem, body-image, negative feelings, and meaningfulness (psychological domain); as well as personal relationships, social support, and sexual satisfaction (social domain). In addition to the raw scores for each item, we also provided an overall mean, as well as three means per subscale, following the calculation instructions in the WHOQOL-BREF manual. Cultural norms of religiosity were measured with two items assessing participants' perception of the extent to which the average person in their country considers a religious lifestyle and belief in God/Gods/spirits important (Wan et al., Citation2007). Finally, demographics were measured at the individual level (i.e., age, gender, level of education, subjective socioeconomic status (SES), and ethnicity) whereas GDP per capita (current US$, World Bank Group, Citation2017), sample type (e.g., university students, online panels), and means of compensation (e.g., course credit, monetary reward) were determined at the country/sample level. Items were reverse-coded when applicable. Personal religiosity items were additionally rescaled to the 0-1 range to make them contribute equally to an average religiosity score since the items were measured on different scales (e.g., a 1–8 Likert scale or a “yes/no” item, which was coded as “no” and “yes”
).Footnote4 GDP was provided as a raw value as well as standardized at the country level.
2. Disclosures
2.1. Data, materials, and preregistration
At the start of this project we did not envision a particular statistical analysis to be executed across the reported results from the individual teams, and therefore we did not preregister any statistical inference procedure. However, at an earlier stage, we did preregister our own hypotheses regarding the research questions that were posed to the analysis teams (see osf.io/zyu8c/). This preregistration also anticipates the many-analysts approach, yet does not specify the exact details of the project. In this preregistration document, we indicated that the analysis teams would first receive a blinded version of the data, but we later decided that half of the teams would work with blinded data and the other half would write their own preregistration (see Sarafoglou et al., Citation2022). Note that we did not include our own estimated effect sizes in the results as shown below. Our results, however, do corroborate the overall pattern of results from the analysis teams. Interested readers can access our preregistered analysis of the research questions on the OSF (osf.io/vy8z7/).
All documents provided to the analysis teams (dataset, documentation, questionnaire), as well as the administered surveys, the anonymized raw and processed data (including relevant documentation), and the R code to conduct all analyzes (including all figures), can be found on the project page on the OSF (osf.io/vy8z7/). Identifying information (such as names, email-addresses, universities) was removed from all free-text answers. See also Table for an overview of all resources.
Table 2. Overview of project stages and resources.
2.2. Reporting
We report how we determined our sample size, all data exclusions, and all manipulations in the study. However, it should be noted that this project also involved an empirical evaluation of analysis blinding, which is reported in another paper (i.e., Sarafoglou et al., Citation2022). Here, we only describe measures relevant to the theoretical research questions and the many-analysts approach. The description of the remaining measures that were only used for the experimental analysis proposal manipulation can be found in Sarafoglou et al. (Citation2022).
2.3. Ethical approval
The study was approved by the local ethics board of the University of Amsterdam (registration number: 2019-PML-12707). All participants were treated in accordance with the Declaration of Helsinki. See Appendix 1 for details on the ethical approval for the cross-cultural data collection.
3. Methods
3.1. Analysis teams
The analysis teams were recruited through advertisements in various newsletters and email lists (e.g., the International Association for the Psychology of Religion (IAPR), International Association for the Cognitive Science of Religion (IACSR), Society for Personality and Social Psychology (SPSP), and the Society for the Psychology of Religion and Spirituality (Div. 36 of the APA)), on social media platforms (i.e., blogposts and Twitter), and through the authors' personal network. We invited researchers of all career stages (i.e., from doctoral student to full professor). Teams were allowed to include graduate and undergraduate students in their teams as long as each team also included a PhD candidate or a more senior researcher. Initially, N = 173 teams signed up to participate in the many-analysts project. From those teams, N = 127 submitted an analysis plan and N = 120 completed the project. The members from each analysis team were offered co-authorship on the main manuscript. No individual researcher or team was excluded from the study.
The number of analysts per team ranged from 1 to 7, with most teams consisting of 1 (41%) or 2 (33%) analysts (median = 2). The different career stages and domains of expertize featured in the analysis teams are given in Table . In addition, Figure shows the self-rated collective knowledge about the topic of religion and well-being and about methodology and statistics. As becomes evident, most of the analysis teams had more methodological and/or statistical expertize than substantive expertize; of the teams reported considerable expertize with regard to methods and statistics compared to
with regard to religion and well-being,
compared to
was neutral, and
compared to
reported little to no knowledge, respectively.
Figure 1. Responses to the survey questions on self-rated topical and methodological knowledge. The top bar represents the teams' answers about their knowledge regarding religion and well-being and the bottom bar represents the teams' answers about their knowledge regarding methodology and statistics. For each item, the number to the left of the data bar (in brown/orange) indicates the percentage of teams that reported little to no knowledge. The number in the center of the data bar (in grey) indicates the percentage of teams that were neutral. The number to the right of the data bar (in green/blue) indicates the percentage of teams that reported (some) expertize.
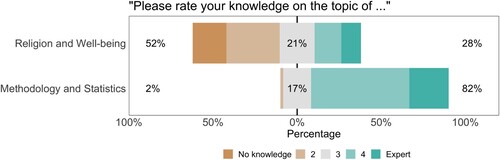
Table 1. Career stages and domains of expertize featured in the 120 analysis teams.
3.2. Sampling plan
For a separate component of the project (see Sarafoglou et al., Citation2022), the preregistered sample size target was set to a minimum of 20 participating teams, which was based on the recruited analysis teams in the many-analysts project from Silberzahn et al. (Citation2018). However, we did not set a maximum number of participating teams. The recruitment of analysis teams was ended on December 22, 2020.
3.3. Materials
3.3.1. Surveys
The analysts received three surveys, here referred to as the pre-survey, the mid-survey, and the post-survey. In the pre-survey, participating teams indicated the career stages and domains of expertize featured in their team, self-rated their (collective) theoretical and methodological knowledge (5-pt Likert scale), and anticipated the likelihood of the effects of interest (7-pt Likert scale). In the mid-survey, teams were asked about the experienced effort, frustration, workload in hours spent on the project, and the extent to which this workload was lower or higher than expected for the analysis planning phase (i.e., stage 1; 7-pt Likert scales). In the post-survey, the teams provided the results of their analyzes and again indicated their experiences during the analysis executing phase (i.e., stage 2). Specifically, per research question, teams were asked about their statistical approach, the operationalization of the independent variable(s) and dependent variable(s), included covariates, analytic sample size, (unit of) effect size, p-value or Bayes factor, and additional steps they took for the analysis. Furthermore, for both research questions, the teams gave a subjective conclusion about the evidence for the effect (i.e., “good evidence for a relation,” “ambiguous evidence,” or “good evidence against a relation”), about the practical meaningfulness/relevance of the effect (based on the data; “yes” or “no”), and indicated again the likelihood of the effects of interest (on a 7-pt Likert scale). Additionally, teams indicated the appropriateness of their statistical approach (7-pt Likert scale), the suitability of the dataset for answering each research question (7-pt Likert scale), and whether or not they deviated from their planned analysis. In case this last question was answered affirmatively, they specified with regard to which aspects they deviated (i.e., hypotheses, included variables, operationalization of the independent variable(s), operationalization of the dependent variable(s), exclusion criteria, statistical test, statistical model, direction of the effect). Finally, teams again reported the experienced effort, frustration, workload in hours and the extent to which this workload was lower or higher than expected for stage 2 (on 7-pt Likert scales).
3.4. Procedure
After signing up, participating teams received a document outlining the aim of the project, the timeline, a short theoretical background with respect to the research questions, and a description of the dataset. Then, after completing the pre-survey, teams could access the full data documentation, the questionnaire as presented to the participants of the cross-cultural study, and either a blinded version of the data or a preregistration template, depending on which condition they had been assigned to. Teams could then design their analysis and upload their documents on their own team page on the OSF (deadline: December 22nd, 2020). The project leaders “froze” the stage 1 documents and sent the link to the mid-survey. Upon completion of this survey, teams automatically received access to the real data. They could execute and upload their final analysis scripts on the OSF until February 28th, 2021. Teams were encouraged to also upload a document summarizing their results, but this was not mandatory. Finally, all teams completed the post-survey. See Table for an overview of the procedure.
4. Results
Here, we report the key results of the project. Specifically, we evaluate the teams' reported effect sizes and their subjective conclusions about the research questions (i.e., the primary results). In addition, we provide descriptive results about the many-analysts aspect (i.e., the secondary results: variability in analytic approaches, included variables, and the teams' experiences across the two different stages). Finally, we assessed whether or not the reported effect sizes are related to subjective beliefs about the likelihood of the research questions.
4.1. Primary results
Teams could report any effect size metric of their choosing, but we noted that we preferred a beta coefficient (i.e., a fully standardized coefficient; z-scored predictors and outcomes) to allow for a comparison between teams. As we correctly anticipated that (1) most teams would conduct linear regression analyzes (see Table ) and (2) both the (scale of the) independent and dependent variables might vary across teams, we considered a beta coefficient the most suitable effect size metric. Note that our request for beta coefficients as effect size metrics may have affected the teams' choice of statistical model and encouraged them to use regression models that generate beta coefficients. For teams that did not provide a (fully) standardized coefficient, we recalculated the beta based on the respective team's analysis script whenever possible. Specifically, for (multilevel) linear regression models we used the effectsize package or the jtools package to extract standardized coefficients in R. For analyzes in SPSS and non-standard models in R, we standardized the data manually prior to executing the analyzes. Finally, many teams reported multiple effect sizes, as they either separately considered multiple predictors (e.g., religious beliefs and religious behaviors) and/or multiple dependent variables (e.g., psychological well-being and physical well-being). In that case, we asked the teams to provide us with one primary effect size they considered most relevant to answer the research question or to select one randomly. In the Online Appendix, we additionally list (1) effect sizes for the different subscales of the well-being measure as reported by the teams and (2) effect sizes from teams that could not provide a beta coefficient (e.g., machine learning models).
Table 3. Analytic approaches taken by the analysis teams.
4.1.1. Research question 1: “do religious people self-report higher well-being?”
We were able to extract 99 beta coefficients from the results provided by the 120 teams that completed stage 2.Footnote5 As shown in Figure , the results are remarkably consistent: all 99 teams reported a positive beta value, and for all teams the confidence/credible interval excludes zero. The median reported beta is 0.120 and the median absolute deviation is 0.036. Furthermore,
of the teams concluded that there is good evidence for a positive relation between religiosity and self-reported well-being. Notably, although the teams were almost unanimous in their evaluation of research question 1, only eight of the 99 teams reported combinations of effect sizes and confidence/credibility intervals that matched those from another team (i.e., four effect sizes were reported twice). Do note that in contrast to the unanimity in results based on the beta coefficients, out of the 21 teams for whom a beta coefficient could not be calculated, 3 teams reported evidence against the relation between religiosity and well-being: 2 teams used machine learning and found that none of the religiosity items contributed substantially to predicting well-being and 1 team used multilevel modeling and reported unstandardized gamma-weights for within- and between-country effects of religiosity whose confidence intervals included zero (see the Online Appendix).
Figure 2. Beta coefficients for the effect of religiosity on self-reported well-being (research question 1) with 95% confidence or credible intervals. Green/blue points indicate effect sizes of teams that subjectively concluded that there is good evidence for a positive relation between individual religiosity and self-reported well-being, grey points indicate effect sizes of teams that subjectively concluded that the evidence is ambiguous, and brown/orange points indicate effect sizes of teams that subjectively concluded that there is good evidence against a positive relation between individual religiosity and self-reported well-being. The betas are ordered from smallest to largest.
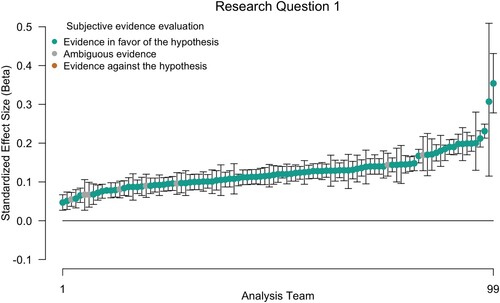
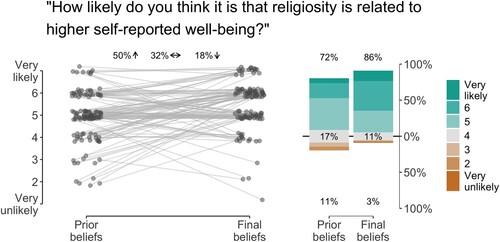
Figure displays the average prior and final beliefs about the likelihood of the hypothesis. Researchers' prior beliefs about religiosity being positively related to self-reported well-being were already high (M = 4.90 on the 7-point Likert scale), but were raised further after them having conducted the analysis (M = 5.49 on the 7-point Likert scale). Specifically, before seeing the data, of the teams considered it likely that religiosity is related to higher self-reported well-being. This percentage increased to
after having seen the data, while
were neutral and
considered it unlikely. Finally,
of teams indicated the relation to be relevant or meaningful based on these data.
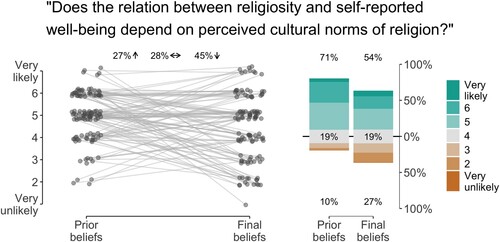
Figure 3. Responses to the survey questions about the likelihood of hypothesis 1. The left side of the figure shows the change in beliefs for each analysis team. Fifty percent of the teams considered the hypothesis somewhat more likely after having analyzed the data than prior to seeing the data, 18% considered the hypothesis less likely after having analyzed the data, and 32% did not change their beliefs. Likelihood was measured on a 7-point Likert scale ranging from “very unlikely” to “very likely.” Points are jittered to enhance visibility. The right side of the figure shows the distribution of the Likert response options before and after having conducted the analyzes. The number at the top of the data bar (in green/blue) indicates the percentage of teams that considered the hypothesis (very) likely, the number in the center of the data bar (in grey) indicates the percentage of teams that were neutral, and the number at the bottom of the data bar (in brown/orange) indicates the percentage of teams that considered the hypothesis (very) unlikely.
4.1.2. Research question 2: “does the relation between religiosity and self-reported well-being depend on perceived cultural norms of religion?”
Out of the 120 teams who completed stage 2 we were able to extract 101 beta coefficients for research question 2. As shown in Figure the results for research question 2 are more variable than for research question 1; 97 out of 101 teams reported a positive beta value and for 66 teams () the confidence/credible interval excluded zero. The median reported effect size is 0.039 and the median absolute deviation is 0.022. Furthermore,
of the teams concluded that there is good evidence for an effect of cultural norms on the relation between religiosity and self-reported well-being. Again, most reported effect sizes were unique; only 3 out of the 101 reported combination of effect size and confidence/credible intervals appeared twice.
Figure 4. Beta coefficients for the effect of cultural norms of the relation between religiosity and self-reported well-being (research question 2) with 95% confidence or credible intervals. Green/blue points indicate effect sizes of teams that subjectively concluded that there is good evidence for the hypothesis that the relation between individual religiosity and self-reported well-being depends on the perceived cultural norms of religion, grey points indicate effect sizes of teams that subjectively concluded that the evidence is ambiguous, and brown/orange points indicate effect sizes of teams that subjectively concluded that there is good evidence against the hypothesis that the relation between individual religiosity and self-reported well-being depends on the perceived cultural norms of religion. The betas are ordered from smallest to largest.
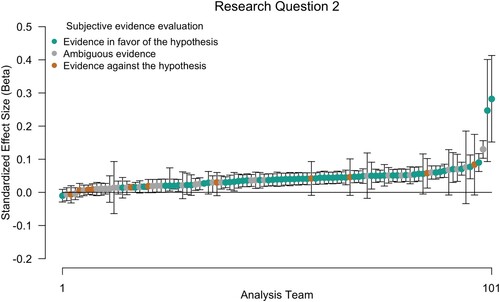
Figure shows the researchers' average prior and final beliefs about the likelihood of the second hypothesis. As for research question 1, prior beliefs about the hypothesis were rather high. However, in contrast to research question 1, conducting the analysis lowered beliefs about the likelihood of hypothesis 2. Specifically, before seeing the data, of the teams considered it likely that the relation between religiosity and self-reported well-being depends on perceived cultural norms of religion. This percentage dropped to
after having seen the data, while
were neutral and
considered it unlikely. Finally, only about half of the teams (
) indicated the effect of cultural norms to be relevant or meaningful based on these data.
Figure 5. Responses to the survey questions about the likelihood of hypothesis 2. The left side of the figure shows the change in beliefs for each analysis team. Twenty-seven percent of the teams considered the hypothesis somewhat more likely after having analyzed the data than prior to seeing the data, 45% considered the hypothesis less likely having analyzed the data, and 28% did not change their beliefs. Likelihood was measured on a 7-point Likert scale ranging from “very unlikely” to “very likely.” Points are jittered to enhance visibility. The right side of the figure shows the distribution of the Likert response options before and after having conducted the analyzes. The number at the top of the data bar indicates the percentage of teams that considered the hypothesis (very) likely, the number in the center of the data bar (in grey) indicates the percentage of teams that were neutral, and the number at the bottom of the data bar (in brown/orange) indicates the percentage of teams that considered the hypothesis (very) unlikely.
4.2. Secondary results
In addition to evaluating the overall results for the two main research questions, we also assessed perceived suitability of the data and analytic approaches, variability in analytical approaches (i.e., statistical models), variable inclusion, and teams' experiences during the two stages of the project.
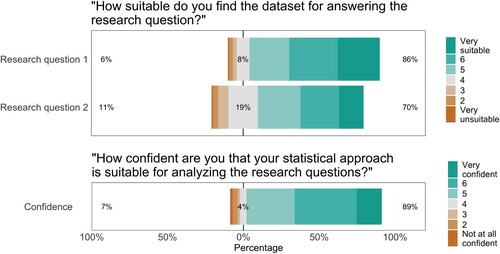
4.2.1. Perceived suitability of dataset
At the end of the project, all teams reported how suitable they found the current dataset for answering the research questions. As shown at the top of Figure , most teams considered the data (very) suitable for answering the research questions: for research question 1, found the data suitable,
neutral, and
unsuitable; for research question 2,
found the data suitable,
neutral, and
unsuitable.
Figure 6. Responses to the survey questions about the suitability of the dataset for answering the research questions (top) and the teams' confidence in their analytic approach (bottom). For question 1, the top bar represents the teams' answers with respect to research question 1 and the bottom bar represents the teams' answers for research question 2. For each item, the number to the left of the data bar (in brown/orange) indicates the percentage of teams that considered the data (very) unsuitable/were not (at all) confident in their approach. The number in the center of the data bar (in grey) indicates the percentage of teams that were neutral. The number to the right of the data bar (in green/blue) indicates the percentage of teams that considered the data (very) suitable/were (very) confident in their approach.
4.2.2. Analytic approaches
Table displays the different statistical approaches used in the project, as well as the percentage of teams that employed the respective approach. While a total of 25 different statistical methods was mentioned, (multilevel) linear regression was clearly the dominant approach. Specifically, of the teams used linear regression, another
used multilevel linear regression, and the remaining
used a different approach.
In general, teams were confident that their chosen statistical approach was appropriate for analyzing the research questions; as shown at the bottom of Figure , of the teams indicated to be (very) confident,
was neutral, and
was not (at all) confident.Footnote6
4.2.3. Variable inclusion
For each team we coded which of the items provided in the dataset were included as (1) dependent variable, (2) independent variable, and (3) covariates in the analysis for each research question.Footnote7
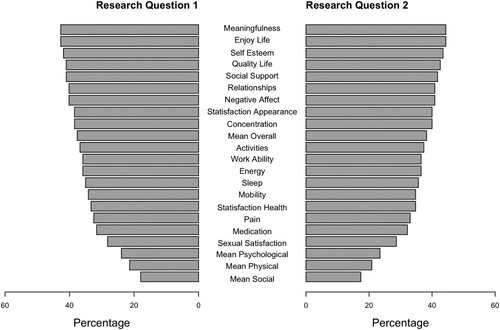
4.2.3.1 Dependent variable
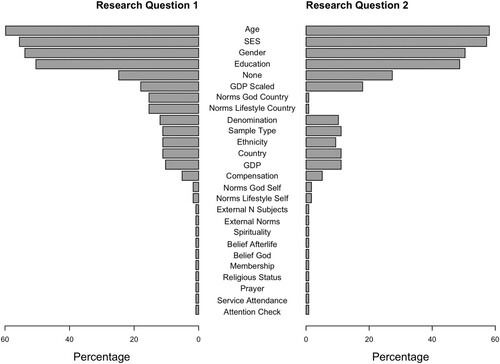
The subjective well-being measure consisted of three subscales (psychological, physical, social), as well as two general items. In the dataset, we provided responses for all 18 individual items as well as an overall mean and one mean for each of the three subscales. Teams could decide to either use any of the provided averages or combine specific items themselves (e.g., take the mean, median, sum). In addition, some teams conducted a factor analysis and used one or multiple extracted factors as the dependent variable. In this case, we coded which items were used as input for the factor analysis. Figure shows the included items as dependent variable aggregated over all teams for research question 1 and research question 2. For research question 1, the most frequently used items are enjoying life and meaningfulness (included by over of the teams). Note that all but four teams used the same dependent variable for research question 1 and 2.Footnote8 In Appendix 2, we show the included items separately for each team.
Figure 7. Items included as dependent variables for research question 1 (on the left) and research question 2 (on the right). Note that the averages for the well-being subscales (“Mean Psychological,” “Mean Social,” “Mean Physical”), as well as the overall average (“Mean Overall”) were provided by the MARP team.
4.2.3.2 Independent variable
The religiosity measure consisted of 9 primary items on response scales ranging from dichotomous to 8-points and the cultural norms of religiosity measure consisted of two items on a 5-point scale. Averages were not provided in the dataset, but could be created by the teams themselves. Figure shows the included items as independent variable aggregated over all teams for research question 1 and research question 2. In Appendix 2, we show the included items separately for each team.
Figure 8. Items included as independent variables for research question 1 (on the left) and research question 2 (on the right). Variables indicated as “external” refer to variables that are based on data not provided by the MARP team.
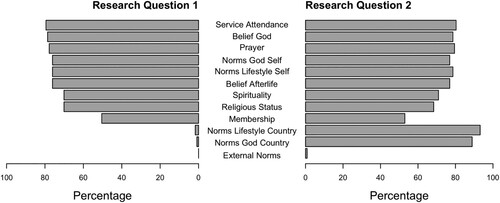
For research question 1 (i.e., the relation between religiosity and self-reported well-being), over of the teams operationalized the independent variable by including the items frequency of service attendance, belief in God/Gods, frequency of prayer, belief in afterlife, personal importance of a religious lifestyle, or personal importance of belief in God. The remaining three religiosity items were used less frequently:
of the teams included the item religious status (religious/not religious/atheist) and spirituality, while only
included religious membership.
For research question 2 (i.e., the effect of perceived cultural norms on the relation between religiosity and self-reported well-being), all but four teams used the interaction term between their chosen religiosity measure and their chosen cultural norms measure as the independent variable.Footnote9 More teams operationalized cultural norms using the item importance of a religious lifestyle in their country () than importance of belief in God/Gods in their country (
). Here again, over
of the teams operationalized the independent variable by including the items frequency of service attendance, belief in God, frequency of prayer, belief in afterlife, personal importance of a religious lifestyle, or personal importance of belief in God, whereas the items religious status (religious/not religious/atheist) and spirituality were included by about
and
of the teams, respectively; only
of the teams included religious membership. Note that almost all teams used the same religiosity measure for research question 1 and research question 2.
4.2.3.3 Covariates
Teams were free to include as covariates in their models any of the measured demographic variables (e.g., age, socio-economic status), country-level variables (e.g., gross domestic product—GDP) or sample characteristics (e.g., general public or student sample, means of compensation). Figure displays the included items as covariates aggregated over all teams for research question 1 and research question 2. The most frequently included covariates are age (), socio-economic status (
), gender (
), and education (
). Note that per team the choice of covariates was largely equal across research questions, with the exception that the cultural norms items were occasionally added as covariates for research question 1 while they were part of the independent variable for research question 2.
Figure 9. Items included as covariates for research question 1 (on the left) and research question 2 (on the right). Variables indicated as “external” refer to covariates that are based on data not provided by the MARP team.
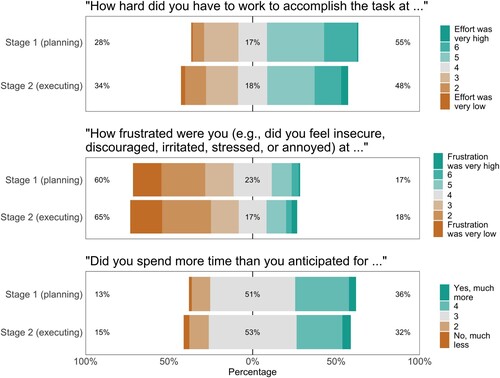
4.2.4. Teams' experiences
Although most teams indicated that effort was (very) high, the majority also reported that frustration was (very) low and that they spent as much time as anticipated (see Figure ). That is, in stage 1, of the teams reported (very) high effort,
were neutral, and
reported (very) low effort. For stage 2,
of the teams reported (very) high effort,
were neutral, and
reported (very) low effort. In stage 1,
of the teams reported (very) high frustration,
were neutral, and
reported (very) low frustration. In stage 2,
of the teams reported (very) high frustration,
were neutral, and
reported (very) low frustration. The median time spent on the analyzes was 8 hours for both stages, although the range was quite wide: 1 to 80 hours for stage 1 and 30 minutes to 140 hours for stage 2. Most teams anticipated as much time as they spent:
for stage 1 and
for stage 2. In stage 1,
spent (much) more time than anticipated and
spent (much) less time. In stage 2,
spent (much) more time than anticipated and
spent (much) less time.
Figure 10. Responses to the survey questions about effort (top), frustration (middle), and workload (bottom). For each question, the top bar represents the teams' answers about stage 1 (planning) and the bottom bar represents the teams' answers about stage 2 (executing). For each item, the number to the left of the data bar (in brown/orange) indicates the percentage of teams that considered effort/frustration/workload (very) low. The number in the center of the data bar (in grey) indicates the percentage of teams that were neutral. The number to the right of the data bar (in green/blue) indicates the percentage of teams that considered effort/frustration/workload (very) high.
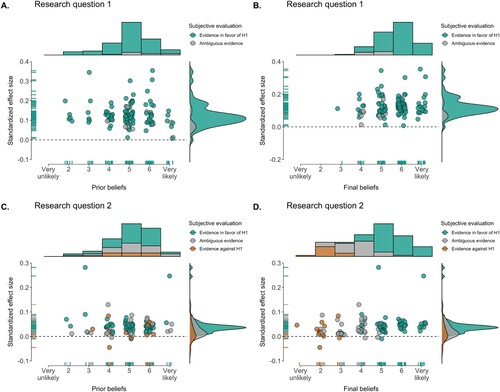
4.2.5. Correlation between effect sizes and subjective beliefs
Following Silberzahn et al. (Citation2018) we explored whether the reported effect sizes were positively related to subjective beliefs about the plausibility of the research question before and after analyzing the data. This hypothesis was tested against the null-hypothesis that there is no relation between reported effect sizes and subjective beliefs. As the subjective beliefs were measured on a 7-point Likert scale, we used a rank-based Spearman correlation test with a Uniform prior (van Doorn et al., Citation2020).
For research question 1, we obtained strong evidence against a positive relation between prior beliefs about the plausibility of the research question and the reported effect sizes: ;
,
, 95% credible interval [−0.37, −0.04]. In addition, we found moderate evidence against a positive relation between posterior beliefs about the plausibility of the research question and the reported effect sizes:
;
,
, 95% credible interval [−0.08, 0.27].
For research question 2, we found moderate evidence against a positive relation between prior beliefs about the plausibility of the research question and the reported effect sizes: ;
,
, 95% credible interval [−0.16, 0.18]. For the posterior beliefs, however, we obtained strong evidence in favor of a positive relation between posterior beliefs about the plausibility of the research question and the reported effect sizes:
,
, 95% credible interval [0.15, 0.46].
To further investigate changes in belief over the course of the project, we assessed the correlation between the reported effect sizes and the change in belief (i.e., the difference between posterior and prior beliefs for both research questions). For research question 1, there was basically no evidence for or against a positive relation between effect size and change in belief: ,
, 95% credible interval [0.01, 0.33]. For research question 2 on the other hand, we obtained moderate evidence that effect sizes were positively related to change in subjective belief about the plausibility of the hypothesis:
,
, 95% credible interval [0.07, 0.39].
These results regarding prior beliefs provide no indication that expectations and confirmation bias influenced the teams' results. For the posterior beliefs, on the other hand, it seems that the teams updated their beliefs about the plausibility of research question 2 based on the results of their analyzes. Note, however, that based on the scatterplot in Figure (D), we should not put too much weight on this finding, as it may be partly driven by two outliers. For research question 1, the updating of beliefs may not have happened because prior beliefs about research question 1 were already in line with the outcomes, i.e., most teams expected and reported evidence for a positive relation between religiosity and well-being, with little variation between teams.
Figure 11. Reported effect sizes (beta coefficients) and subjective beliefs about the likelihood of the hypothesis. A. shows the relation between effect size and prior beliefs for research question 1, B. shows the relation between effect size and final beliefs for research question 1, C. shows the relation between effect size and prior beliefs for research question 2, and D. shows the relation between effect size and final beliefs for research question 2. Points are jittered on the x-axis to enhance visibility. The dashed line represents an effect size of 0. The data are separated by subjective evaluation of the evidence; green/blue points reflect the conclusion that there is good evidence for the hypothesis, grey points reflect the conclusion that the evidence is ambiguous, and brown/orange points indicate the conclusion that there is good evidence against the hypothesis. Histograms at the top represent the distribution of subjective beliefs and the density plots on the right represent the distribution of reported effect sizes.
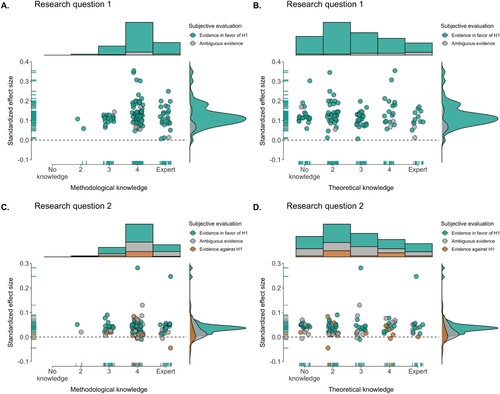
Finally, we assessed whether reported effect sizes were related to self-reported expertize. Here, we used a Uniform prior and an undirected test. This hypothesis was tested against the null-hypothesis that reported effect sizes and self-reported expertize were not related. For research question 1, we found moderate evidence against a correlation between effect sizes and methodological knowledge (
;
,
, 95% credible interval [−0.17, 0.21]) and weak evidence against a correlation between effect sizes and theoretical knowledge (
;
,
, 95% credible interval [−0.31, 0.03]). For research question 2, we again obtained moderate evidence against a relation between effect sizes and methodological knowledge (
;
,
, 95% credible interval [−0.17, 0.20]) and moderate evidence against a correlation between effect sizes and theoretical knowledge (
;
,
, 95% credible interval [−0.24, 0.09]). See Figure for scatterplots of the data.
Figure 12. Reported effect sizes (beta coefficients) and self-reported team expertize. A. shows the relation between effect size for research question 1 and methodological knowledge, B. shows the relation between effect size for research question 1 and theoretical knowledge, C. shows the relation between effect size and for research question 2 and methodological knowledge, and D. shows the relation between effect size for research question 2 and theoretical knowledge. Points are jittered on the x-axis to enhance visibility. The dashed line represents an effect size of 0. The data are separated by subjective evaluation of the evidence; green/blue points reflect the conclusion that there is good evidence for the hypothesis, grey points reflect the conclusion that the evidence is ambiguous, and brown/orange points indicate the conclusion that there is good evidence against the hypothesis. Histograms at the top represent the distribution of reported expertize and the density plots on the right represent the distribution of reported effect sizes.
5. Summary
In the current project, 120 analysis teams were given a large cross-cultural dataset (, 24 countries) in order to investigate two research questions: (1) “Do religious people self-report higher well-being?” and (2) “Does the relation between religiosity and self-reported well-being depend on perceived cultural norms of religion?.” In a two-stage procedure, the teams first proposed an analysis and then executed their planned analysis on the data.
Perhaps surprisingly in light of previous many-analysts projects, results were fairly consistent across teams. For research question 1 on the relation between religiosity and self-reported well-being, all but three teams reported a positive effect size and confidence/credible intervals that exclude zero. For research question 2, the results were somewhat more variable: of the teams reported a positive effect size for the moderating influence of cultural norms of religion on the association between religiosity and self-reported well-being, with
of the confidence/credible intervals excluding zero. While most teams used (multilevel) linear regression, there was considerable variability in the choice of items used to construct the independent variable, the dependent variable, and the included covariates.
A further discussion of these results including limitations and broader implications, as well as a reflection on the many-analysts approach is covered in the closing article (CitationHoogeveen et al., Citation2022). There, we also address the commentaries written by some of the analysis teams.
Author contributions
Contributorship was documented with CRediT taxonomy using tenzing (Holcombe et al., Citation2020). Conceptualization: S.H., A.S., M.v.E., and E.-J.W.Data curation: S.H. and A.S.Formal analysis: S.H., A.S., B.A., Y. Aditya, A.J.A., P.J.A., S. Alzahawi, Y. Amir, F.-V.A., O.K.A., Q.D.A., A. Baimel, M.B.-I., M. Balsamo, S.B., F.B., M. Becerra, B.B., J. Beitner, T. Bendixen, J.B.B., M.I.B., J. Billingsley, T. Bortolini, H.B., A. Bret, F.L.B., J. Brown, C.C.B., J. Buczny, J. Bulbulia, S. Caballero, L.C., C.L.C., M.E.G.V.C., S.J.C., S. Claessens, M.C.P., A.B.C., D.L.C., S. Czoschke, C.C., E.D.D.U., Ö.D., A.D.R., H.D., J.D.R., Y.A.d.V., K.K.D., B.J.D., D.J.D., J.K.D., T.D., L.D., M.D., Y.D., T.E., P.A.E., A.E., C.T.E., S. Farahmand, H.F., M.F., A.A.F., K.F., R.F., D.F.-T., Z.F., S. Frick, L.K.F., D.G., E. Gerdin, L.G., O.G., E. Gielens, V.G., H.R.H., I.H., P.H.P.H., C.E.H., B.C.H., L.E.H., M.I., H.I., M.L.I., C.-G.I., O.I., D.I., B.J., K.A.J., J.J., J.A.K., K.K.H., E.K., B.A.K., L.A.K., S. Kelchtermans, J.M.K., R.A.K., B.K., M.L.K., M.K., D.K., J.K., S. Kritzler, A.-M.K., T.K., T.L.L., R.L., G.A.L.F., A.L., B.J.L., R.F.L., P.L., J.L., P.Ł., A.L.L., E.M., G.M.M.-R., M. Maier, D.R.M., N.M., M. Martinie, I.M., S.E.M., A.L.M., P. McAleer, T.M., M. McCullough, C.M.M., A.A.M., K.K.M., B. Mercier, P. Mitkidis, B. Monin, J.W.M., D.M., J. Morgan, J. Murphy, G.M., C.N., T.N., L.N., N.H., G.N., P.N., A.N., M.B.N., A.O.-C., L.O., Y.G.P., J.O.P., H.I.P., H.P., H.K.P., M. Pinus, S.P., V.P., M. Porubanova, M.J.P., J.M.P., M.A.P., J.P., C.P., B.G.P., J.Q.P., M.L.R., G.R., A. Roberts, L.M.R.L., R.M.R., P.R., N.R., S.-M.K.S., J.Y.S., C. Schaumans, B. Schivinski, M.C.S., S.A.S., M. Schnuerch, M.R.S., V.S., S. Sebben, S.C.S., B. Seryczyńska, U.S., M. Simsek, W.W.A.S., E.R.S., W.J.S., M. Späth, C. Spörlein, W.S., A.H.S., S. Stuber, J.S., C. Suwartono, S. Syropoulos, B. Szaszi, P.S., L.T., R.T.T., B.T., C.M.T., J.T., S.D.T., A.-M.U., R.C.M.V.A., M.A.L.M.v.A., P.V.C., O.R.V.d.A., I.V.d.C., J.V.d.N., N.N.N.v.D., C.J.V.L., V.v.M., D.v.R., C.J.J.v.Z., L.A.V., B. Većkalov, B. Verschuere, M.V., F.V., A.V., V.V., L.V.D.E.V., S. Watanabe, C.J.M.W., K.W., S. Wiechert, Z.W., M.W., C.V.O.W., D.W., X.Y., D.J.Y., O.Y., N.Z., Y.Z., and J.Z.Funding acquisition: A.S., M.v.E., E.-J.W., S. Altay, N.L., R.M., and R.M.R.Investigation: S.H., A.S., M.v.E., E.-J.W., S. Altay, T. Bendixen, R.B., K.H., R.M., L.Q., A. Rabelo, J.E.R., R.M.R., R.W., and D.X.Methodology: S.H., A.S., M.v.E., and E.-J.W.Project administration: S.H., A.S., M.v.E., and E.-J.W.Supervision: M.v.E. and E.-J.W.Validation: S.H. and A.S.Visualization: S.H., A.S., and P.J.A.Writing—original draft: S.H., A.S., M.v.E., and E.-J.W.Writing—review & editing: P.A.E., P.H.P.H., R.M., C.M.M., J. Murphy, T.N., J.E.R., R.M.R., S.C.S., B.T., R.C.M.V.A., M.A.L.M.v.A., and C.J.M.W.
Supplementary material
Download PDF (329.4 KB)Acknowledgments
We thank Arik Cheshin, Claudio Gentili, Raluca Georgescu, Christopher Kavanagh, Alejandra Neely, Hugh Turpin, and Filip Uzarevic for their assistance in creating the material and collecting the cross-cultural data.
Disclosure statement
The authors declare that there were no conflicts of interest with respect to the authorship or the publication of this article.
Additional information
Funding
Notes
1 Ironically, so is the present project.
2 Note that we acknowledge that another important problem in the literature on religion and well-being concerns the issue of causality. However, as our project uses non-experimental cross-sectional data, this issue cannot immediately be addressed in the current study (but see Grosz et al., Citation2020; Rohrer, Citation2018 for a perspective on causal inference in non-experimental studies).
3 Note that we did not exclude the 19 participants who indicated they were younger than 18 (but some of the analysis teams did exclude these participants).
4 When teams indicated that they preferred the raw data, we provided the function to back-transform the data.
5 One team misinterpreted the scoring of the items and hence miscoded the direction of the effect. As they subsequently also based their subjective conclusions on the incorrect results, we excluded the reported effect sizes, subjective evaluation, and prior+final beliefs about the likelihood of the hypotheses for this team.
6 Note that out of the 8 teams reporting not being confident, 2 did not submit a final analysis and 2 did not provide a usable effect size.
7 Please see the document “variable mapping” on the OSF (osf.io/qbdce/) for how the items correspond to the item names in the datafile.
8 Two of the four teams that did not use the same dependent variable for research question 1 and 2 only conducted an analysis for research question 1.
9 The four teams that did not use an interaction in their evaluation of research question 2 either used the main effect of cultural norms on well-being or the main effect of religiosity on well-being (while controlling for cultural norms).
References
- Abdel-Khalek, A. M. (2006). Measuring happiness with a single-item scale. Social Behavior and Personality: An International Journal, 34(2), 139–150. https://doi.org/10.2224/sbp.2006.34.2.139
- Abu-Raiya, H. (2013). On the links between religion, mental health and inter-religious conflict: A brief summary of empirical research. The Israel Journal of Psychiatry and Related Sciences, 50(2), 130–139.
- Aczel, B., Szaszi, B., Nilsonne, G., Albers, C. J., van Assen, M. A., Bastiaansen, J. A., Benjamin, D., Boehm, U., Botvinik-Nezer, R., Bringmann, L. F., Busch, N. A., Caruyer, E., Cataldo, A. M., Cowan, N., Delios, A., van Dongen, N. N., Donkin, C., van Doorn, J. B., Dreber, A., …Wagenmakers, E. J. (2021, November). Consensus-based guidance for conducting and reporting multi-analyst studies. eLife, 10, Article e72185. https://doi.org/10.7554/eLife.72185
- Bains, S. (2011, January). Questioning the integrity of the John Templeton foundation. Evolutionary Psychology, 9(1), 92–115. https://doi.org/10.1177/147470491100900111
- Bastiaansen, J. A., Kunkels, Y. K., Blaauw, F. J., Boker, S. M., Ceulemans, E., Chen, M., Chow, S.-M., de Jonge, P., Emerencia, A. C., Epskamp, S., Fisher, A. J., Hamaker, E. L., Kuppens, P., Lutz, W., Meyer, M. J., Moulder, R., Oravecz, Z., Riese, H., Rubel, J., …Bringmann, L. F. (2020, October). Time to get personal? the impact of researchers choices on the selection of treatment targets using the experience sampling methodology. Journal of Psychosomatic Research, 137, Article 110211. https://doi.org/10.1016/j.jpsychores.2020.110211
- Bergin, A. E. (1983). Religiosity and mental health: A critical reevaluation and meta-analysis. Professional Psychology: Research and Practice, 14(2), 170–184. https://doi.org/10.1037/0735-7028.14.2.170
- Boehm, U., Annis, J., Frank, M. J., Hawkins, G. E., Heathcote, A., Kellen, D., Krypotos, A.-M., Lerche, V., Logan, G. D., Palmeri, T. J., D. van Ravenzwaaij, Servant, M., Singmann, H., Starns, J. J., Voss, A., Wiecki, T. V., Matzke, D., & Wagenmakers, E.-J. (2018, December). Estimating across-trial variability parameters of the diffusion decision model: Expert advice and recommendations. Journal of Mathematical Psychology, 87, 46–75. https://doi.org/10.1016/j.jmp.2018.09.004
- Botvinik-Nezer, R., Holzmeister, F., Camerer, C. F., Dreber, A., Huber, J., Johannesson, M., Kirchler, M., Iwanir, R., Mumford, J. A., Adcock, R. A., Avesani, P., Baczkowski, B. M., Bajracharya, A., Bakst, L., Ball, S., Barilari, M., Bault, N., Beaton, D., Beitner, J., …Schonberg, T. (2020, June). Variability in the analysis of a single neuroimaging dataset by many teams. Nature, 582(7810), 84–88. https://doi.org/10.1038/s41586-020-2314-9
- Captari, L. E., Hook, J. N., Hoyt, W., Davis, D. E., McElroy-Heltzel, S. E., & Worthington, Jr., E. L. (2018). Integrating clients' religion and spirituality within psychotherapy: A comprehensive meta-analysis. Journal of Clinical Psychology, 74(11), 1938–1951. https://doi.org/10.1002/jclp.2018.74.issue-11
- Chang, M.-C., Chen, P.-F., Lee, T.-H., Lin, C.-C., Chiang, K.-T., Tsai, M.-F., Kuo, H.-F., & Lung, F.-W. (2021, March). The effect of religion on psychological resilience in healthcare workers during the coronavirus disease 2019 pandemic. Frontiers in Psychology, 12, Article 628894. https://doi.org/10.3389/fpsyg.2021.628894
- Chiu, C. Y., Gelfand, M. J., Yamagishi, T., Shteynberg, G., & Wan, C. (2010). Intersubjective culture: The role of intersubjective perceptions in cross-cultural research. Perspectives on Psychological Science, 5(4), 482–493. https://doi.org/10.1177/1745691610375562
- de Vrieze, J. (2018). The metawars. Science, 361(6408), 1184–1188. https://doi.org/10.1126/science.361.6408.1184
- Diener, E., Tay, L., & Myers, D. G. (2011). The religion paradox: If religion makes people happy, why are so many dropping out? Journal of Personality and Social Psychology, 101(6), 1278–1290. https://doi.org/10.1037/a0024402
- Dressler, W. W., Balieiro, M. C., Ribeiro, R. P., & Santos, J. E. D. (2007). Cultural consonance and psychological distress: Examining the associations in multiple cultural domains. Culture, Medicine and Psychiatry, 31(2), 195–224. https://doi.org/10.1007/s11013-007-9046-2
- Dutilh, G., Annis, J., Brown, S. D., Cassey, P., Evans, N. J., Grasman, R. P. P. P., Hawkins, G. E., Heathcote, A., Holmes, W. R., Krypotos, A.-M., Kupitz, C. N., Leite, F. P., Lerche, V., Lin, Y.-S., Logan, G. D., Palmeri, T. J., Starns, J. J., Trueblood, J. S., van Maanen, L., …Donkin, C. (2019, August). The quality of response time data inference: A blinded, collaborative assessment of the validity of cognitive models. Psychonomic Bulletin & Review, 26(4), 1051–1069. https://doi.org/10.3758/s13423-017-1417-2
- Ebert, T., Gebauer, J. E., Talman, J. R., & Rentfrow, P. J. (2020). Religious people only live longer in religious cultural contexts: A gravestone analysis. Journal of Personality and Social Psychology, 119(1), 1–6. https://doi.org/10.1037/pspa0000187
- Fillard, P., Descoteaux, M., Goh, A., Gouttard, S., Jeurissen, B., Malcolm, J., Ramirez-Manzanares, A., Reisert, M., Sakaie, K., Tensaouti, F., Yo, T., J. F. Mangin, & Poupon, C. (2011, May). Quantitative evaluation of 10 tractography algorithms on a realistic diffusion MR phantom. NeuroImage, 56(1), 220–234. https://doi.org/10.1016/j.neuroimage.2011.01.032
- Garssen, B., Visser, A., & Pool, G. (2020, February). Does spirituality or religion positively affect mental health? meta-analysis of longitudinal studies. The International Journal for the Psychology of Religion, 31(1), 4–20. https://doi.org/10.1080/10508619.2020.1729570
- Gebauer, J. E., Sedikides, C., Schönbrodt, F. D., Bleidorn, W., Rentfrow, P. J., Potter, J., & Gosling, S. D. (2017). The religiosity as social value hypothesis: A multi-method replication and extension across 65 countries and three levels of spatial aggregation. Journal of Personality and Social Psychology, 113(3), e18–e39. https://doi.org/10.1037/pspp0000104
- George, L. K., Ellison, C. G., & Larson, D. B. (2002, July). Explaining the relationships between religious involvement and health. Psychological Inquiry, 13(3), 190–200. https://doi.org/10.1207/S15327965PLI1303_04
- Grosz, M. P., Rohrer, J. M., & Thoemmes, F. (2020, September). The taboo against explicit causal inference in nonexperimental psychology. Perspectives on Psychological Science, 15(5), 1243–1255. https://doi.org/10.1177/1745691620921521
- Hackney, C. H., & Sanders, G. S. (2003). Religiosity and mental health: A meta–analysis of recent studies. Journal for the Scientific Study of Religion, 42(1), 43–55. https://doi.org/10.1111/jssr.2003.42.issue-1
- Harris, J. I., Usset, T., Voecks, C., Thuras, P., Currier, J., & Erbes, C. (2018, September). Spiritually integrated care for PTSD: A randomized controlled trial of “Building spiritual strength”. Psychiatry Research, 267, 420–428. https://doi.org/10.1016/j.psychres.2018.06.045
- Hayward, R. D., & Elliott, M. (2014, March). Cross-national analysis of the influence of cultural norms and government restrictions on the relationship between religion and well-being. Review of Religious Research, 56(1), 23–43. https://doi.org/10.1007/s13644-013-0135-0
- Holcombe, A. O., Kovacs, M., Aust, F., & Aczel, B. (2020). Documenting contributions to scholarly articles using CRediT and Tenzing. PLoS One, 15(12), Article e0244611. https://doi.org/10.1371/journal.pone.0244611
- Hoogeveen, S., Altay, S., Bendixen, T., Berniunas, R., Bulbulia, J., Cheshin, A., Gentili, C., Georgescu, R., Gervais, W., Haaf, J., Hagel, K., Kavanagh, C., Levy, N., McKay, R., Neely-Prado, A., Qiu, L., Ross, R., & van Elk, M. (2021). The Einstein effect: Global evidence for scientific source credibility effects and the influence of religiosity. PsyArXiv.
- Hoogeveen, S., Sarafoglou, A., van Elk, M., & Wagenmakers, E. J. (2022). Many-analysts religion project: Reflection and conclusion. Religion, Brain & Behavior. https://doi.org/10.1080/2153599X.2022.2070263
- Hoogeveen, S., & van Elk, M. (2018). Advancing the cognitive science of religion through replication and open science. Journal for the Cognitive Science of Religion, 6(1-2), 158–190. https://doi.org/10.1558/jcsr.39039
- Huijts, T., & Kraaykamp, G. (2011, March). Religious involvement, religious context, and self-assessed health in Europe. Journal of Health and Social Behavior, 52(1), 91–106. https://doi.org/10.1177/0022146510394950
- Huntington-Klein, N., Arenas, A., Beam, E., Bertoni, M., Bloem, J. R., Burli, P., Chen, N., Greico, P., Ekpe, G., Pugatch , T., Saavedra, M., & Stopnitzky, Y. (2021). The influence of hidden researcher decisions in applied microeconomics. Economic Inquiry, 59(3), 944–960. https://doi.org/10.1111/ecin.v59.3
- Kelley, J., & de Graaf, N. D. (1997). National context, parental socialization, and religious belief: Results from 15 nations. American Sociological Review, 62(4), 639–659. https://doi.org/10.2307/2657431
- Koenig, H. G. (2009). Research on religion, spirituality, and mental health: A review. The Canadian Journal of Psychiatry, 54(5), 283–291. https://doi.org/10.1177/070674370905400502
- Koenig, H. G., Al-Zaben, F., & VanderWeele, T. J. (2020, September). Religion and psychiatry: Recent developments in research. BJPsych Advances, 26(5), 262–272. https://doi.org/10.1192/bja.2019.81
- Koenig, H. G., Hill, T. D., Pirutinsky, S., & Rosmarin, D. H. (2021, January). Commentary on “Does spirituality or religion positively affect mental health?” The International Journal for the Psychology of Religion, 31(1), 27–44. https://doi.org/10.1080/10508619.2020.1766868
- Koenig, H. G., & Larson, D. B. (2001, January). Religion and mental health: Evidence for an association. International Review of Psychiatry, 13(2), 67–78. https://doi.org/10.1080/09540260124661
- Kvarven, A., Strømland, E., & Johannesson, M. (2020, April). Comparing meta-analyses and preregistered multiple-laboratory replication projects. Nature Human Behaviour, 4(4), 423–434. https://doi.org/10.1038/s41562-019-0787-z
- Ladd, K. L., & Messick, K. J. (2016). A brief history of the psychological study of the role(s) of religion. In Psychological specialties in historical context: Enriching the classroom experience for teachers and students (pp. 204–216). Society for the Teaching of Psychology. http://teachpsych.org/ebooks/
- Lewis, C. A., & Cruise, S. M. (2006, June). Religion and happiness: Consensus, contradictions, comments and concerns. Mental Health, Religion & Culture, 9(3), 213–225. https://doi.org/10.1080/13694670600615276
- Lim, C., & Putnam, R. D. (2010, December). Religion, social networks, and life satisfaction. American Sociological Review, 75(6), 914–933. https://doi.org/10.1177/0003122410386686
- Luo, W., & Chen, F. (2021, December). The salience of religion under an atheist state: Implications for subjective well-being in contemporary China. Social Forces, 100(2), 852–878. https://doi.org/10.1093/sf/soab049
- Maier-Hein, K. H., Neher, P. F., Houde, J.-C., Côté, M.-A., Garyfallidis, E., Zhong, J., Chamberland, M., Yeh, F.-C., Lin, Y.-C., Ji, Q., Reddick, W. E., Glass, J. O., Chen, D. Q., Feng, Y., Gao, C., Wu, Y., Ma, J., He, R., Li, Q., & Descoteaux, M. (2017, November). The challenge of mapping the human connectome based on diffusion tractography. Nature Communications, 8(1), 1349. https://doi.org/10.1038/s41467-017-01285-x
- May, M., & Smilde, D. (2016, June). Minority participation and well-being in majority catholic nations: What does it mean to be a religious minority? Journal of Religion and Health, 55(3), 874–894. https://doi.org/10.1007/s10943-015-0099-1
- Okulicz-Kozaryn, A. (2010, March). Religiosity and life satisfaction across nations. Mental Health, Religion & Culture, 13(2), 155–169. https://doi.org/10.1080/13674670903273801
- Plante, T. G., & Sherman, A. C. (2001). Faith and health: Psychological perspectives. Guilford Press.
- Poloma, M. M., & Pendleton, B. F. (1989). Exploring types of prayer and quality of life: A research note. Review of Religious Research, 31(1), 46–53. https://doi.org/10.2307/3511023
- Rohrer, J. M. (2018, March). Thinking clearly about correlations and causation: Graphical causal models for observational data. Advances in Methods and Practices in Psychological Science, 1(1), 27–42. https://doi.org/10.1177/2515245917745629
- Rosmarin, D. H., Pargament, K. I., Pirutinsky, S., & Mahoney, A. (2010, October). A randomized controlled evaluation of a spiritually integrated treatment for subclinical anxiety in the jewish community, delivered via the internet. Journal of Anxiety Disorders, 24(7), 799–808. https://doi.org/10.1016/j.janxdis.2010.05.014
- Ruiter, S., & van Tubergen, F. (2009). Religious attendance in cross-national perspective: A multilevel analysis of 60 countries. American Journal of Sociology, 115(3), 863–895. https://doi.org/10.1086/603536
- Salganik, M. J., Lundberg, I., Kindel, A. T., Ahearn, C. E., Al-Ghoneim, K., Almaatouq, A., Altschul, D. M., Brand, J. E., Carnegie, N. B., Compton, R. J., Datta, D., Davidson, T., Filippova, A., Gilroy, C., Goode, B. J., Jahani, E., Kashyap, R., Kirchner, A., McKay, S., …McLanahan, S. (2020, April). Measuring the predictability of life outcomes with a scientific mass collaboration. Proceedings of the National Academy of Sciences, 117(15), 8398–8403. https://doi.org/10.1073/pnas.1915006117
- Sarafoglou, A., Hoogeveen, S., & Wagenmakers, E.-J. (2022). Comparing analysis blinding with preregistration in the many-analysts religion project. PsyArXiv. https://doi.org/10.31234/osf.io/6dn8f
- Schweinsberg, M., Feldman, M., Staub, N., van den Akker, O. R., R. C. M. van Aert, van Assen, M. A. L. M., Liu, Y., Althoff, T., Heer, J., Kale, A., Mohamed, Z., Amireh, H., Venkatesh Prasad, V., Bernstein, A., Robinson, E., Snellman, K., Amy Sommer, S., Otner, S. M. G., Robinson, D., …E. Luis Uhlmann (2021, July). Same data, different conclusions: Radical dispersion in empirical results when independent analysts operationalize and test the same hypothesis. Organizational Behavior and Human Decision Processes, 165, 228–249. https://doi.org/10.1016/j.obhdp.2021.02.003
- Seybold, K. S., & Hill, P. C. (2001, February). The role of religion and spirituality in mental and physical health. Current Directions in Psychological Science, 10(1), 21–24. https://doi.org/10.1111/1467-8721.00106
- Silberzahn, R., & Uhlmann, E. L. (2015). Many hands make tight work. Nature, 526(7572), 189–191. https://doi.org/10.1038/526189a
- Silberzahn, R., Uhlmann, E. L., Martin, D. P., Anselmi, P., Aust, F., Awtrey, E., Bahník, Š., Bai, F., Bannard, C., Bonnier, E., Carlsson, R., Cheung, F., Christensen, G., Clay, R., Craig, M. A., Dalla Rosa, A., Dam, L., Evans, M. H., Flores Cervantes, I., …Nosek, B. A. (2018). Many analysts, one data set: Making transparent how variations in analytic choices affect results. Advances in Methods and Practices in Psychological Science, 1(3), 337–356. https://doi.org/10.1177/2515245917747646
- Simkin, H. (2020, September). The centrality of events, religion, spirituality, and subjective well-being in Latin American Jewish immigrants in Israel. Frontiers in Psychology, 11, Article 576402. https://doi.org/10.3389/fpsyg.2020.576402
- Smith, T. B., McCullough, M. E., & Poll, J. (2003). Religiousness and depression: Evidence for a main effect and the moderating influence of stressful life events. Psychological Bulletin, 129(4), 614–636. https://doi.org/10.1037/0033-2909.129.4.614
- Starns, J. J., Cataldo, A. M., Rotello, C. M., Annis, J., Aschenbrenner, A., Bröder, A., Cox, G., Criss, A., Curl, R. A., Dobbins, I. G., Dunn, J., Enam, T., Evans, N. J., Farrell, S., Fraundorf, S. H., Gronlund, S. D., Heathcote, A., D. W. Heck, Hicks, J. L., …Wilson, J. (2019, December). Assessing theoretical conclusions with blinded inference to investigate a potential inference crisis. Advances in Methods and Practices in Psychological Science, 2(4), 335–349. https://doi.org/10.1177/2515245919869583
- Stavrova, O. (2015). Religion, self-rated health, and mortality: Whether religiosity delays death depends on the cultural context. Social Psychological and Personality Science, 6(8), 911–922. https://doi.org/10.1177/1948550615593149
- Stavrova, O., Fetchenhauer, D., & Schlösser, T. (2013). Why are religious people happy? the effect of the social norm of religiosity across countries. Social Science Research, 42(1), 90–105. https://doi.org/10.1016/j.ssresearch.2012.07.002
- Steegen, S., Tuerlinckx, F., Gelman, A., & Vanpaemel, W. (2016). Increasing transparency through a multiverse analysis. Perspectives on Psychological Science, 11(5), 702–712. https://doi.org/10.1177/1745691616658637
- Swigart, K. L., Anantharaman, A., Williamson, J. A., & Grandey, A. A. (2020, July). Working while liberal/conservative: A review of political ideology in organizations. Journal of Management, 46(6), 1063–1091. https://doi.org/10.1177/0149206320909419
- Thoresen, C. E. (1999, May). Spirituality and health: Is there a relationship? Journal of Health Psychology, 4(3), 291–300. https://doi.org/10.1177/135910539900400314
- van Dongen, N. N. N., van Doorn, J. B., Gronau, Q. F., D. van Ravenzwaaij, Hoekstra, R., Haucke, M. N., Lakens, D., Hennig, C., R. D. Morey, Homer, S., Gelman, A., Sprenger, J., & Wagenmakers, E.-J. (2019, March). Multiple perspectives on inference for two simple statistical scenarios. The American Statistician, 73(sup1), 328–339. https://doi.org/10.1080/00031305.2019.1565553
- van Doorn, J., Ly, A., Marsman, M., & Wagenmakers, E. J. (2020, December). Bayesian rank-based hypothesis testing for the rank sum test, the signed rank test, and Spearman's ρ. Journal of Applied Statistics, 47(16), 2984–3006. https://doi.org/10.1080/02664763.2019.1709053
- van Elk, M. (2021, January). Assessing the religion-health relationship: Introduction to the meta-analysis by Garssen et al., and two commentaries. The International Journal for the Psychology of Religion, 31(1), 1–3. https://doi.org/10.1080/10508619.2021.1877029
- van Elk, M., Matzke, D., Gronau, Q., Guang, M., Vandekerckhove, J., & E. J. Wagenmakers (2015). Meta-analyses are no substitute for registered replications: A skeptical perspective on religious priming. Frontiers in Psychology, 6, 1365. https://doi.org/10.3389/fpsyg.2015.01365
- Villani, D., Sorgente, A., Iannello, P., & Antonietti, A. (2019). The role of spirituality and religiosity in subjective well-being of individuals with different religious status. Frontiers in Psychology, 10. https://doi.org/10.3389/fpsyg.2019.01525
- Wan, C., Chiu, C. y., Tam, K. P., Lee, S. l., Lau, I. Y. M., & Peng, S. (2007). Perceived cultural importance and actual self-importance of values in cultural identification. Journal of Personality and Social Psychology, 92(2), 337–354. https://doi.org/10.1037/0022-3514.92.2.337
- Weber, S. R., & Pargament, K. I. (2014, September). The role of religion and spirituality in mental health. Current Opinion in Psychiatry, 27(5), 358–363. https://doi.org/10.1097/YCO.0000000000000080
- WHOQOL Group (1998). Development of the world health organization WHOQOL-BREF quality of life assessment. Psychological Medicine, 28(3), 551–558. https://doi.org/10.1017/S0033291798006667
- Wiebe, D. (2009). Religious biases in funding religious studies research? Religio: Revue Pro Religionistiku, 17(2), 125–140.
- World Bank Group (2017). World bank group – international development, poverty, & sustainability [Web Page]. http://www.worldbank.org/.
- World Values Survey (2010). Wave 6 official aggregate v. 20150418. worldvaluessurvey.org. Asep/JDS Madrid.
- Wulff, D. M. (1998, June). Rethinking the rise and fall of the psychology of religion. In Religion in the making (pp. 181–202). Brill.
- Zimmer, Z., Jagger, C., Chiu, C. T., Ofstedal, M. B., Rojo, F., & Saito, Y. (2016, December). Spirituality, religiosity, aging and health in global perspective: A review. SSM – Population Health, 2, 373–381. https://doi.org/10.1016/j.ssmph.2016.04.009
- Zou, X., Tam, K. P., Morris, M. W., Lee, S. l., Lau, I. Y. M., & Chiu, C. y. (2009). Culture as common sense: Perceived consensus versus personal beliefs as mechanisms of cultural influence. Journal of Personality and Social Psychology, 97(4), 579–597. https://doi.org/10.1037/a0016399
AppendicesAppendix 1.
Descriptives of the dataset
A.1. Ethical approval cross-cultural data collection
Data collection for the cross-cultural study was approved by the local ethics committee at the Psychology Department of the University of Amsterdam (Project #2018-SP-9713). Additional approval was obtained from local IRBs at the Adolfo Ibáñez University (Chile), the Babes-Bolyai University (Romania), the James Cook University (Singapore), Royal Holloway, University of London (UK), the University of Connecticut (US), and the Max Planck Society, as well as the Senate Department for Education, Youth and Family from the Ministry of Education in Berlin (Germany). All participants were treated in accordance with the Declaration of Helsinki.
Table A1. Descriptive statistics of the cross-cultural data.
Table A2. Religious denomination in the cross-cultural data.
Appendix 2.
Variable inclusion
Here we show the variable inclusion for each team; Table displays the included items for the dependent variable for research question 1 and Table displays the included items for the dependent variable for research question 2. Table displays the included items for the independent variable for research question 1 and Table displays the included items for the independent variable for research question 2. Table displays the included items as covariates for research question 1 and Table displays the included items as covariates for research question 2.
Table A3. Items included as dependent variables for research question 1 by each team.
Table A3. Continued.
Table A4. Items included as dependent variables for research question 2 by each team.
Table A4. Continued.
Table A5. Items included as independent variables for research question 1 by each team.
Table A5. Continued.
Table A6. Items included as independent variables for research question 2 by each team.
Table A6. Continued.
Table A7. Covariates included for research question 1 by each team.
Table A7. Continued.
Table A8. Covariates included for research question 2 by each team.
Table A8. Continued.