
 ?Mathematical formulae have been encoded as MathML and are displayed in this HTML version using MathJax in order to improve their display. Uncheck the box to turn MathJax off. This feature requires Javascript. Click on a formula to zoom.
Abstract
The forests in Central Kalimantan, Indonesia have been heavily impacted by logging, mining, fires, and other degradation activities for over 30 years. To address this, the Indonesian government has promoted community-based forest management schemes. One such scheme, called Hutan Kemasyarakatan (HKm), has introduced Sengon (Paraserianthes falcataria) in smallholder plantations in Rungan Barat, Gunung Mas, Central Kalimantan. However, accurate estimation of biomass is crucial for carbon sequestration credits, but there are no specific allometric models for estimating Sengon above-ground biomass (AGB) in this area. To create a site-specific AGB allometric model for Sengon, 23 trees were felled to collect fresh biomass data. Various tree variables, such as diameter at breast height: 1.3 m (DBH), total height, merchantable height, and stem bole volume were measured for each sample tree. The average wood basic density of Sengon at the study site was also calculated. A total of nine alternative candidate regression equations were fitted and tested to select the best-fit AGB allometric model. Also, to assess the adaptedness of the identified AGB allometric model, comparisons with the models from literature, and comparisons between two interchangeable methodologies (i.e. direct biomass allometric model and biomass expansion factor (BEF)-based biomass estimation) were undertaken. This study has developed a regression function, denoted as to estimate the AGB of Sengon trees in smallholder plantations in Central Kalimantan, Indonesia. The formulated regression function demonstrated better estimation performance compared to common pantropical and regional AGB allometric models. In terms of the BEF-biomass approach, the AGB estimation derived from Smalian’s volume was relatively accurate, close to the mean AGB obtained by the formulated model in this study. In summary, this study proposes using the developed model, based solely on DBH, to accurately estimate AGB and carbon sequestration potential in Sengon trees. The accurate estimation of AGB using this model has additional advantages, including facilitating carbon credit acquisition and informing long-term management decisions.
1. Introduction
Climate change and its repercussions have sparked concerns in national development proposals on a global scale, with forests being regarded as a critical nature-based solution for combating climate change (Osaka et al. Citation2021; Stefanakis et al. Citation2021). In particular, developing countries predominantly experience the burden of climate change’s harmful consequences due to fragility, lack of adequate endurance, and poor adaptability (Nath and Behera Citation2011; Makundi Citation2014). The transition of tropical forests into agricultural land and overexploitation of forested land substantially disrupts global carbon cycles in a negative way and exacerbates the forested land cover change that accounts for between 10% and 20% of total carbon emissions (Pachauri and Reisinger Citation2007; van der Werf et al. Citation2009).
On the forests of Indonesia’s Borneo island (Kalimantan), extreme disturbance factors, such as logging, shifting cultivation, palm-oil plantations, peatland fires, and so on are prevalent (Curran et al. Citation2004; Sandker et al. Citation2007; Hansen et al. Citation2009; Ferraz et al. Citation2018). As a result, its forested areas declined by 78% between 1973 and 2003 (Page et al. Citation2009). Kalimantan’s existing forests are categorized primarily into two types: (1) Intact forests, which are mostly located at higher altitudes, out of the range of logging corporations, and (2) Low-land fragmented forests, which extend to swamps and include agroforestry, plantations, scrublands, and farmlands (Ferraz et al. Citation2018). Central Kalimantan was reported to experience devastating deforestation in Indonesia (Broich et al. Citation2011; Suwarno et al. Citation2015), where more than 30 years of extensive logging, mining, and other forms of degradation have seriously affected all forest ecosystems (Kronseder et al. Citation2012; Moeliono and Limberg Citation2012). The Central Kalimantan province lost almost 0.9 million ha of forest between 2000 and 2008 (Broich et al. Citation2011; Suwarno et al. Citation2015). However, in 2018, Central Kalimantan exhibited one of the lowest rates of deforestation among the Indonesian provinces, with a rate of 0.38% that was 81% lesser than the 1990–2012 deforestation baseline. Also, as of 2018, Central Kalimantan had accumulated 7.8% of Indonesia’s total tropical forest biomass carbon (Earth Innovation Institute Citation2020). The Indonesian government’s commitment to sustainably managing and utilizing forest resources is accountable for such a decline in deforestation, which is demonstrated by the certification of sustainable forest management to prevent illegal logging, the reinforcement of a customized law enforcement unit, the resolution of land disputes, and the upholding of community land rights and forest tenure (Ministry of Environment and Forestry Citation2020). Forests in Indonesia are administered by the Ministry of Environment and Forestry across several Forest Management Units (Kesatuan Pengelolaan Hutan: KPHs). The Protection Forest Management Unit: Kesatuan Pengelolaan Hutan Lindung (KPHL) is one of the important categories of KPH. The Indonesian government launched Hutan Kemasyarakatan (HKmFootnote1) scheme in 2001 as a follow-up to the KPHL, which means “Community Forests/Social Forests”, to curb increased forest degradation, enhance the conservation of remnant forests, and promote local livelihoods (Pender et al. Citation2008; Fisher et al. Citation2018). The HKm scheme allows local people to cultivate on state-owned deforested land designated as Protection Forest or Production Forest (Pender et al. Citation2008).
The German organizations, named Fairventures Worldwide (FW) and Fairventures Social Forestry (FSF), operate in Central Kalimantan to restore degraded landscapes, sustain timber production, enhance livelihoods, and produce carbon credits pursuant to the HKm scheme of the Indonesian government and small-scale farmers’ perceptions. FW and FSF are committed to supporting local forest concession holders in terms of logistics (e.g. providing quality seedings) and technical aspects of forest management operation, as well as the provision of carbon sequestration credits from international markets since it has a significant impact on climate change mitigation. As a part of this sustainable commitment to restore degraded forested areas in Rungan Barat, Gunung Mas, Central Kalimantan, Sengon has been largely introduced by FW and FSF with the engagement of local farmers to meet the objectives of livelihood security of local communities and national ecosystem conservation (Fairventures Worldwide Citation2021; Fairventures Social Forestry Citation2022). Sengon has acquired widespread concern as a fast-growing multipurpose plantation species in Indonesia on both private smallholder plantations and public lands for industrial and rehabilitation purposes (Nawir et al. Citation2007). Nevertheless, accessing carbon credits, which is considered to be a viable green income stream for those Sengon plantations, completely depends on the accurate estimation of biomass and corresponding carbon.
The framework for climate change mitigation prioritizes enhancing access to financing through global carbon markets as a means of reducing deforestation and forest degradation and increasing forest carbon stock (Aukland et al. Citation2003; Ebeling and Yasué Citation2008). For countries intending to respond to climate change mitigation through various forest projects, the estimation of forest carbon stock is essential (Böttcher et al. Citation2009; Birdsey et al. Citation2013). Also, the Paris Agreement promotes developing nations to respond to climate change mitigation by lowering emissions from deforestation and forest degradation, safeguarding existing carbon storage, and further enhancing forest carbon stock (Grassi et al. Citation2017). These mechanisms have paved the ground for the emergence of credible and practical approaches for estimating biomass carbon in a variety of land use systems, including plantation forests. Also, accurate estimation of tree biomass is required to comprehend forest structure, amount of carbon sequestered, forest productivity, and forest’s contribution to alleviating contemporary climate change issues, (Westman and Rogers Citation1977; Chambers et al. Citation2001; Saint-André et al. Citation2005; Zianis et al. Citation2005; Henry et al. Citation2013; Pachauri et al. Citation2014), as well as to make sustainable forest management decisions (Peng Citation2000). The most basic practice for assessing biomass carbon stock in a forest is to use valid allometric equations for individual tree biomass estimation (Gibbs et al. Citation2007; van Breugel et al. Citation2011). Accordingly, allometric equations are being widely employed to estimate individual tree biomass, and eventually the biomass carbon in a forest area (Sileshi Citation2014; Traoré et al. Citation2018; Kebede and Soromessa Citation2018; Mukuralinda et al. Citation2021). In addition, enhancing forest carbon sequestration, maintaining biodiversity, and supporting the livelihoods of forest-dependent communities lead to the implementation of innovative carbon credit market mechanisms, such as Reducing Emissions from Deforestation and Forest Degradation (REDD+) (Mugasha et al. Citation2013). REDD+, a result-based approach, focuses on carbon stock accounting as the most critical outcome metric for the provision of remuneration (Köhl et al. Citation2020). Due to Indonesia’s participation in the worldwide REDD + program, the assessment of forest carbon stock and stock fluctuations has emerged as a popular research area in Indonesia (Anitha et al. Citation2015). For accurate quantification, monitoring, and reporting of the consequences or advantages of REDD + operations, precise biomass allometric equations are imperative (Gibbs et al. Citation2007; Somogyi et al. Citation2007). Until now, considering the composites of tropical forest species, several biomass pantropical allometric models have been developed (Haase and Haase Citation1995; Brown Citation1997; Nelson et al. Citation1999; Chambers et al. Citation2001; Ketterings et al. Citation2001; Chave et al. Citation2005; Pearson et al. Citation2005; Chave et al. Citation2014). Although the use of common pantropical allometric models straightforwardly estimates tree biomass and carbon stock for a wide range of species, the application of previously reported pantropical allometric models results in considerable bias in biomass estimation (Clark et al. Citation2001; Pilli et al. Citation2006; Basuki et al. Citation2009; van Breugel et al. Citation2011; Alvarez et al. Citation2012; Hossain et al. Citation2021). As reported, even though Chave et al.’s (Citation2005, Citation2014) equation functions admirably in a few locations in South-East Asia (Rutishauser et al. Citation2013) and Africa (Vieilledent et al. Citation2012; Fayolle et al. Citation2013), the preponderance of other studies reveal greater uncertainty in biomass prediction than those formulated locally (Basuki et al. Citation2009; Kenzo et al. Citation2009; van Breugel et al. Citation2011; Alvarez et al. Citation2012; Goodman et al. Citation2014). Furthermore, biomass differs depending on site characteristics (Alvarez et al. Citation2012), forest type (Rutishauser et al. Citation2013), wood density (Enquist et al. Citation1999), life history (Henry et al. Citation2010), crown size (Goodman et al. Citation2014), and climatic zones (Brown et al. Citation1989). Irrespective of biomass allometric equations, biomass expansion factor (BEF) and wood basic density (WBD) can also be used to convert the stem volume into total above-ground biomass (AGB) of a tree when AGB allometric equations of a species are unavailable (Somogyi et al. Citation2007; Lisboa et al. Citation2018).
In Indonesia, out of the available biomass allometric models, 47% were developed for varieties of natural forest ecosystems (i.e. dryland forest, peat swamp forest, and mangrove forest); while 52% were developed for plantation forest ecosystems (including community forests). Also, the vast majority of studies on biomass estimation took place in plantation forests in Java (Krisnawati et al. Citation2012). Central Kalimantan, on the other hand, has a paucity of information regarding forest inventories (Kronseder et al. Citation2012). In terms of available species-specific biomass allometric models in the Indonesian plantation forest ecosystem, Mangium (Acacia mangium) contributes 14%, followed by Puspa (Schimi awllichii) at 6%, Tusam (Pinus merkusii) at 5%, and Sengon (Paraserianthes falcataria) at 5% (Krisnawati et al. Citation2012). There are two commonly reported allometric models for estimating AGB of Sengon trees across the Indonesian plantations. These models were developed in Java, specifically in Jateng (Rusolono Citation2006) and Jatim (Siregar Citation2007). Despite the rapid introduction and establishment of Sengon plantations in Central Kalimantan, which has substantial site and environmental variations from Java, there are still no allometric regression functions that can be utilized to provide accurate biomass estimation for Sengon. It is, thus, indispensable to develop such a biomass allometric model in Central Kalimantan for Sengon. The objectives of this study are: (1) to find a best-fit allometric equation to estimate the AGB of Sengon, (2) to compare the formulated best-fit AGB allometric equation with common pantropical AGB allometric equations and Sengon’s existing AGB allometric equations in the Indonesian plantation ecosystem, and (3) to evaluate the efficiency of AGB estimation by using an alternative approach: employing the BEF-biomass method that incorporates stem bole volume and WBD.
2. Materials and method
2.1. Study area
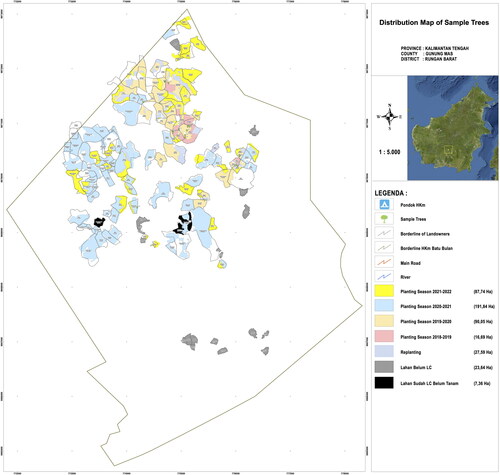
This study was conducted in Rungan Barat, Gunung Mas, Central Kalimantan, Indonesia, in smallholder plantations sanctioned by the HKm scheme of the Indonesian government with which FSF has contracted (1°10’04.9”S and 113°28’18.2”E). The entire study area consists of dispersed plantation stands from four planting seasons (i.e. 2018–2019, 2019–2020, 2020–2021, and 2021–2022), spanning approximately 400 ha and managed by FSF with the active engagement of local concession holder farmers (). The vegetation of the studied smallholder plantation forest stands is dominated by three tree species: Sengon (Paraserianthes falcataria), Jabon (Anthocephalus cadamba), and Acacia (Acacia mangium). However, the composition of the plantation stands is predominantly monoculture of Sengon trees and more areas of the plantable patches are expected to be established mostly with the economically important species. Local farmers have long prioritized the monoculture of Sengon because of its high quality and demand for industrial wood, and various agroforestry techniques are being tested on an increasing scale with the species. Nonetheless, the overall HKm terrain consists of fragmented secondary forests, contiguous secondary forests, plantations, farmlands, shrublands, barren lands, and old-growth intact forests at high altitudinal elevations. The study site is located near Palangka Raya, the capital city of Central Kalimantan. This region experiences a tropical rainforest climate with an average annual temperature of 26.3 °C, which is around 1.57 °C higher than the average for Indonesia. The annual precipitation in Palangka Raya is around 2666 mm (Climate-data.org Citation2022).
Figure 1. Study area.
2.2. AGB estimation methods
In this study, two methods were adopted to estimate AGB of Sengon. These included direct estimation from formulated allometric model and indirect estimation from stem bole/merchantable volume using BEF.
2.2.1. Destructive sampling and direct estimation of AGB
A destructive technique was employed, as illustrated in Hossain et al. (Citation2016)’s manual on biomass allometric equation development, to assess the AGB of all individual sample trees. A reconnaissance survey, followed by a standard circular forest inventory plot (15 m radius) in each age-graded plantation stand at the study site (), was performed prior to the destructive biomass assessment to obtain baseline information on probable size distributions (i.e. diameter classes) of Sengon. Once the population of Sengon had been categorized into six DBH (Diameter at Breast Height: 1.3 m) classes covering all the age gradations: 2–6 cm, 6–10 cm, 10–14 cm, 14–18 cm, 18–21 cm, and ≥ 21 cm, a preferential sampling technique was applied to sample four trees from the first five DBH classes and three trees from the last DBH class (hence, a total of 23 trees) for destructive biomass assessment, with the intention of representing trees from all DBH classes while avoiding defective trees and edge effects. The sample trees were then felled as close to the ground level as practicable and separated into three components: stem bole (up to merchantable height), branch (diameter ≥ 2 cm), and foliage (twigs: < 2 cm in diameter, flowers, fruits, and seeds). Before felling a tree, the DBH and total height (TH) were measured. The Merchantable Height (MH) of the tree was measured once it had been felled.
The fresh weight of each tree component for all sample trees was measured in the field using a digital hanging weighing balance (max. 300 kg, precision 0.1 kg). For each tree component, a total of six to nine sub-samples ranging from 0.064 to 1.545 kg were weighed in the field using a digital weighing balance (max. 7 kg, precision 0.0001 kg) and taken to the laboratory for oven drying. The dry weight of the stem bole, branch, and foliage sub-samples was determined in the laboratory by drying them for 10 days at 105 °C in an oven until a constant weight was achieved. A digital laboratory weighing balance (max. 3 kg, precision 0.00001 kg) was used to record the dry weight of each sub-sample.
The following formula was used to determine the fresh-to-dry weight conversion ratio of each tree component:
The fresh weight of each tree component of a sample tree was multiplied by the average conversion ratio obtained from respective component sub-samples to assess the dry weight (biomass) as follows:
Subsequently, the total AGB of a sample tree was assessed by adding the biomass of each tree component as follows:
2.2.2. Indirect estimation of AGB using conversion factor
The indirect method of estimating AGB involves the conversion of stem bole/merchantable volume to total AGB using BEF. This process requires the determination of the WBD, which reflects the amount of carbon stored in a given volume of stem bole and accounts for the variation in the tree species density. The method for calculating WBD was based on the approach described by Malimbwi et al. (Citation1994) and Lisboa et al. (Citation2018). To determine the WBD, two square specimens measuring 6 × 6 × 6 cm3 were randomly selected from the parts of the stem bole (bottom, middle, and top) and branch among the sample trees. Overall, we sampled a total of eight square specimens from the stem bole and branch components. Those specimens were then taken to the laboratory, where they were oven-dried at 105 °C and weighed. Thereafter, each of the specimens was immersed in water for one week to restore its wet/fresh volume. Using the water displacement method, each specimen was submerged in a 2-L container that was successively leveled with an accuracy of 0.1 cm3 to obtain the value for fresh volume by recording the amount of water displaced. Finally, the WBD was calculated as the average ratio of the dry weight to the fresh volume of the specimens, as described in the following equation:
(1)
(1)
where WBD = wood basic density (kg m−3); sdw = specimen dry weight (kg); sfv = specimen fresh volume (m3).
2.2.2.1. Assessment of BEF
The value for BEF was determined as the average ratio of total dry weight (total AGB) to stem bole dry weight (stem bole biomass) of all destructively sampled trees as in the following equation:
(2)
(2)
where TDW (kg) = total (stem bole, branch, and foliage) dry weight; SDW (kg) = stem bole dry weight; n = number of sample trees.
Source: Lisboa et al. (Citation2018).
2.2.2.2. Stem bole volume estimation
To determine the merchantable volume (otherwise, stem bole volume) of each sample tree, the stem was cut into 1 m billets for larger trees and 0.5 m billets for smaller trees until the merchantable height, which marks the beginning of permanent leaf containing lateral branches, was reached. Smalian’s formula was used to determine the volume of each stem billet as it was employed in similar investigations (e.g. Henry et al. Citation2010; Lisboa et al. Citation2018; Hossain et al. Citation2021; Oluwajuwon Citation2022) (EquationEquation (3)(3)
(3) ). The volumes of all the billets were summed to determine the merchantable volume of each sample tree. Additionally, the merchantable volume of each individual sample tree was determined using the models developed by Siswanto (Citation2008) for Sengon in the Indonesian plantation ecosystem (EquationEquations (4)
(4)
(4) and Equation(5)
(5)
(5) ). This was to assess the comparative performance of using Smalian’s method and existing volume models in providing volume estimates for a more accurate total AGB evaluation through the BEF-biomass method.
(3)
(3)
Here, V = volume (m3); π = 3.14; L = length of the log billet (m); D1 = diameter at the thicker end (m); D2 = diameter at the thinner end (m).
(4)
(4)
(5)
(5)
Here, V = merchantable volume (m3); DBH = diameter at breast height: 1.3 m (cm); TH = total height (m).
Source: Siswanto (Citation2008).
2.2.2.3. Indirect BEF-biomass estimation
Using the indirect method, the total AGB of all sample trees was estimated by converting the stem bole volume using the biomass conversion and expansion factor (BCEF), which is obtained from the product of WBD and BEF (EquationEquations (6)(6)
(6) and Equation(7)
(7)
(7) ). BCEF accounts for the variation in biomass distribution among different tree components and helps to appropriately convert the stem bole volume and biomass to the total AGB.
(6)
(6)
Here, BCEF = biomass conversion and expansion factor (kg m−3); WBD = wood basic density (kg m−3); BEF = biomass expansion factor.
Source: Guangyi et al. (Citation2017).
(7)
(7)
Here, W = total AGB (kg); V = stem bole/merchantable volume (m3); BCEF = biomass conversion and expansion factor (kg m−3).
Source: Pajtík et al. (Citation2011).
2.6. Data analysis
2.6.1. Model selection
A total of nine commonly employed regression forms in biomass estimation modeling for forest trees were evaluated as potential models for estimating the total AGB of Sengon trees (Brown Citation1997; Nelson et al. Citation1999; Hossain et al. Citation2015; Magalhães and Seifert Citation2015; Guedes et al. Citation2018; Lisboa et al. Citation2018; Sanquetta et al. Citation2018; Daba and Soromessa Citation2019; Mahmood et al. 2020, 2021) (). These regression models were fitted using nonlinear methods without any log-linear transformation of the equations, with the aim to identify the best-fit allometric equation for accurately estimating the AGB of Sengon. Some of the models only incorporate DBH, while others include both DBH and TH. The best-fit equation was the one with the lowest Akaike information criterion (AIC), Bayesian information criterion (BIC), root mean square error (RMSE), and mean percentage error (MPE) (EquationEquations (8)–(11)) (Chave et al. Citation2005; Sileshi Citation2014; Mugasha et al. Citation2016; Lisboa et al. Citation2018; Hossain et al. Citation2021). The Shapiro–Wilk and Runs tests were conducted to assess the residuals’ normality and autocorrelation of the best-fit equation, respectively. However, where required, less regard was given to the normality assumption of the residuals where no indication of autocorrelation was detected, following Lisboa et al. (Citation2018). The “nlstools” package of the statistical software R (4.2.0) was employed to compute all of the regression parameters and coefficients (R Core Team Citation2022). Since the nonlinear function was considered without any linear transformation of complex equations, R2 and Adjusted R2 were not considered as model selection criteria.
(8)
(8)
(9)
(9)
(10)
(10)
(11)
(11)
Table 1. Candidate models for biomass allometric equation development.
Here, n = number of trees; Yp = predicted value from model; Yo = observed value in field measurement; = mean of the observed value; K = number of parameters estimated.
2.6.2. Model evaluation and comparison
The efficiency of pantropical AGB allometric models, existing AGB allometric models in the Indonesian plantation environment for Sengon (), and AGB allometric model developed in this study was assessed by comparing them to observed field biomass through RMSE, MPE, and model efficiency (ME) metrics (EquationEquations (10)–(12)) (Mayer and Butler Citation1993; Kachamba et al. Citation2016; Lisboa et al. Citation2018; Hossain et al. Citation2021). Two-tailed paired t-tests were performed to assess the significant variances in biomass estimation between the developed AGB allometric model in this study and AGB allometric models considered from the literature. Two-tailed Wilcoxon rank (paired samples) tests were further performed to assess the variations in biomass prediction between the two interchangeable methods: (1) Using the direct biomass allometric equation, and (2) Using the BEF-biomass method.
(12)
(12)
Table 2. Considered models for comparison.
Here, n = number of trees; Yp = predicted value from model; Yo = observed value in field measurement; = mean of the observed value.
3. Results
3.1. Biomass allometric model
The computed coefficients and model selection parameters for the candidate AGB models are listed in . The correlation between observed and predicted biomass values is shown in , while the distribution of residuals is presented in . Among the nine regression equations considered in this study (), seven of them (MD1–MD5 and MH1–MH2) used either DBH or TH as explanatory variables, while the remaining equations (MDH1–MDH2) considered both DBH and TH. All the regression models recorded statistically significant slopes (p < 0.05) at a 95% confidence interval, except MDH2 with nonsignificant estimate for TH (p > 0.05). Nevertheless, based on the model selection criteria, MD2 and MDH2 were found to have performed reasonably better than the other models owing to their lower values of AIC (138.84 and 138.91) and BIC (142.24 and 143.45), respectively. Conversely, MD3 and MH2 were attributed to the least performance metrics with as high RMSE values as 32.38 and 35.22, respectively (). MD2 and MDH2 were therefore primarily shortlisted as the potential best-fit models. Furthermore, in order to determine the overall best model between the two power models, we examined the significance of integrating the TH parameter in MDH2, which was the only difference between the two models. It was observed that although MDH2 had a lower RMSE value of 4.17, its regression intercept and slope for TH were not statistically significant at a 95% confidence interval. This indicates that there is no strong statistical justification for favoring the double-entry model over the DBH-based MD2 model.
Figure 2. Observed vs predicted plots of the AGB candidate models.
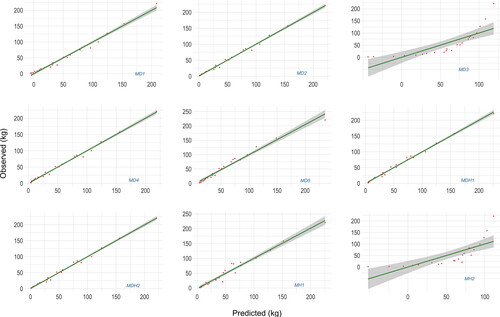
Figure 3. Residuals’ distribution of the AGB candidate models.
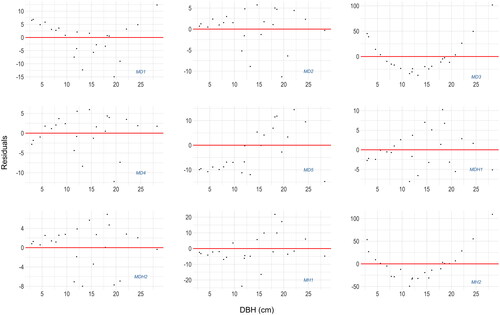
Table 3. Computed coefficients and comparative statistics of the AGB candidate models.
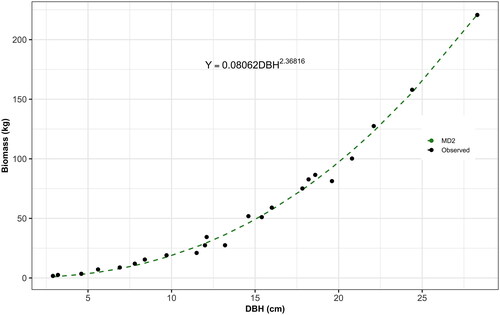
Overall, MD2 model was chosen as the best-fit AGB allometric model () for Sengon in smallholder plantations in Central Kalimantan, Indonesia. This decision was based on the lower AIC and BIC values compared to MDH2, the nonsignificant slope reported for TH in MDH2, the nonsignificant regression intercept of MDH2, and the challenges of measuring TH in a forested environment. The validation of the linearity assumption between observed and predicted biomass values for MD2 () and the absence of evidence for autocorrelation in its residuals (Runs, p > 0.05) provide further confirmation of the statistical credence of the model. The normality of the residuals was not a principal assumption considered in this study, as it is not strictly applicable in biological growth conditions, nonlinear regression fitting cases, or when no autocorrelation of residuals is already confirmed.
Figure 4. Identified AGB allometric model: MD2 (power function).
3.2. Comparison of biomass allometric models
The predictive accuracy metrics of the AGB allometric models considered from the literature and the model identified in this study (MD2) are presented in and . In this study context, models from the literature were tested and their predicted AGB had an RMSE ranging from 18.03 to 129. The equation from Chave et al. (Citation2005, Citation2014) provided a reasonable estimate of AGB, comparable to other commonly used pantropical models we considered (RMSE = 10.07, ME = 0.97, and MPE = 7.29%) ( and ). Although its performance was not significantly different from MD2 (t-test, p > 0.05), it slightly overestimated the AGB (). This relatively good fit may be attributed to its higher degree of generalizability of the model across various pantropical forest types and its comprehensive representation of diverse growth patterns and dataset despite its original development from tropical natural forest contexts. On the other hand, the pantropical equation by Pearson et al. (Citation2005) exhibited a substantial overestimation trend with the highest level of bias (RMSE = 129, ME = −4.57, and MPE = −117.21%), followed by Brown (Citation1997) with RMSE = 111.77, ME = −3.18, and MPE = −107.70% ( and ). When compared with MD2, both models (Brown Citation1997; Pearson et al. Citation2005) reported statistically significant differences (t-test, p < 0.05) (). Considering existing AGB allometric models specific to Sengon in Indonesian (Java) plantations, Siregar (Citation2007) and Rusolono (Citation2006) tended to overestimate AGB compared to MD2 (), although the differences were not statistically significant (t-test, p > 0.05) (). In comparison with Rusolono (Citation2006), Siregar (Citation2007) recorded a lower RMSE (18.03) and higher ME (0.89); approaching the predictive accuracy of MD2 and Chave et al. (Citation2005, Citation2014). However, the absolute MPE (9.66%) by Rusolono (Citation2006) was lower than the absolute MPE (43.12%) by Siregar (Citation2007) ().
Figure 5. Graphical representation of the predictive accuracy of the allometric model identified in this study (MD2) against those considered from the literature.
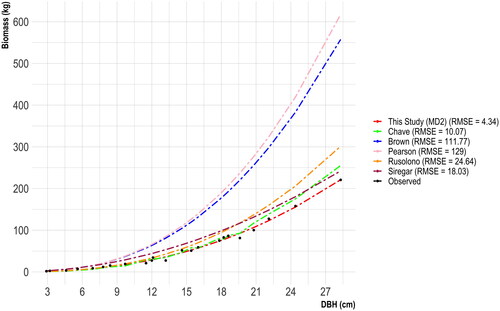
Figure 6. Illustration of the statistical significances among the AGB allometric models under consideration (*significant at α = 0.05, ns: not statistically significant at α = 0.05).
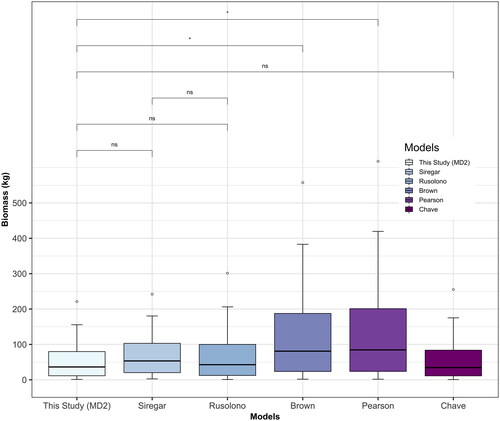
Table 4. Predictive accuracy metrics of the model identified in this study (MD2) and the models considered from the literature.
3.3. Indirect biomass estimation
The AGB of each sample tree was estimated indirectly using BEF, WBD, and stem bole volume, which was computed as a part of this study (EquationEquations (5)(5)
(5) and Equation(6)
(6)
(6) ). The stem bole volume was estimated employing Smalian’s formula (EquationEquation (2)
(2)
(2) ) and two existing merchantable volume models developed by Siswanto (Citation2008) in the Indonesian plantation context (). This indirect approach of AGB estimation was performed to assess whether there was any significant discrepancy between the identified AGB allometric model (MD2) and the indirect approach. The average BEF and WBD values (mean ± SE) obtained in this study were 1.69 ± 0.05 and 282.52 ± 12.39 kg m−3, respectively. The maximum AGB (mean ± SE) was estimated from the stem bole volume computed by Siswanto (B) with an average of 82.03 ± 17.73 kg. This was followed by Siswanto (A) (76.22 ± 16.46 kg) and Smalian (51.22 ± 10.31 kg). The mean AGB estimated using Smalian’s volume was lower than the mean value obtained by MD2 (55.11 ± 11.68 kg); yet, it was the closest compared to the other two Siswanto’s estimates (). Generally, there was no significant difference in predicting AGB between the considered approaches of determining stem bole volume and MD2 (Wilcoxon, p > 0.05) (). This elucidates the rationale for choosing the WBD and BEF values computed in this study over literature values, as well as validates the accuracy of the proposed AGB allometric model (MD2) for Sengon in the study context.
Figure 7. Illustration of the statistical significances among the indirect methods of AGB estimation in comparison to this study model (MD2).
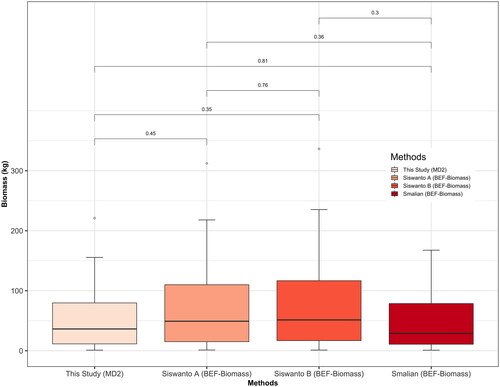
Table 5. Descriptive statistics of BEF, WBD and stem bole volume, and the AGB estimation using BEF-biomass method and this study model (MD2).
4. Discussion
4.1. Biomass allometric model
In this study, a biomass allometric model for Sengon in smallholder plantations, Central Kalimantan, Indonesia, was developed to estimate total AGB (hence, AGB carbon stock). Accurate AGB estimation through allometric models is a widely recognized approach for understanding the benefits of forest restoration or management actions in mitigating climate change. It also plays a crucial role in securing financial support from international carbon markets as part of national- and community-level livelihood strategies (Aukland et al. Citation2003; Chave et al. Citation2005; Gibbs et al. Citation2007; Somogyi et al. Citation2007; Ebeling and Yasué Citation2008; Böttcher et al. Citation2009; Birdsey et al. Citation2013; Henry et al. Citation2013; Chave et al. Citation2014). In general, fitting bivariate allometric equations to datasets can be challenging, requiring measures to standardize and enhance analytical methods (Packard et al. Citation2011; Xiao et al. Citation2011; Taskinen and Warton Citation2013; Packard Citation2014; Sileshi Citation2014). For instance, the ubiquitous log-linear transformation of complex regression equation forms is assumed to influence the predictive accuracy (Krisnawati et al. Citation2012; Sileshi Citation2014) while fitting the dataset in spite of the ability to enhance homoscedasticity of residuals (Sileshi Citation2014; Saha et al. Citation2021). In contrast, the findings of this study support the use and suitability of nonlinear regression functions to link dependent and independent variables without considerable alterations, such as natural log-linear transformation. Their predictive accuracy could vary depending on the specific type of regression function used (Litton and Kauffman Citation2008; Sileshi Citation2014; Lisboa et al. Citation2018). The selected AGB allometric model in this study (MD2) aligns well with the findings of several other studies which concluded that a nonlinear power regression equation with DBH as the sole explanatory variable provides more accurate AGB estimates (Brown Citation1997; Mugasha et al. Citation2013; Mate et al. Citation2014; Mwakalukwa et al. Citation2014; Kachamba et al. Citation2016; Mugasha et al. Citation2016; Lisboa et al. Citation2018). Other researchers have also highlighted the superior efficiency of power equations in estimating AGB regardless of the number of predictors involved (Niklas Citation2006; Hauk et al. Citation2015). These reports support the notion that plant growth is a multiplicative and nonlinear process in nature (West et al. Citation1999; Marquet et al. Citation2005; Packard Citation2014).
Dendrometric variables, such as tree diameter and height, are commonly regarded as independent variables in biomass allometric models (Brown Citation1997; Chave et al. Citation2005; Pearson et al. Citation2005; Ravindranath and Ostwald Citation2007; Pearson et al. Citation2013; Chave et al. Citation2014). In the fitted model (MD2) recommended in this study, tree height was not included as an explanatory variable. While some researchers argue that using DBH as the only independent variable results in a reliable biomass allometric model (Williams et al. Citation2005; Kebede and Soromessa Citation2018), other studies have found that including tree height improves estimate accuracy and model fit (Chave et al. Citation2005; Tumwebaze et al. Citation2013). However, the findings of this study indicate that including both DBH and TH as explanatory variables (MDH1 and MDH2) did not significantly improve the predictive accuracy compared to MD2 (). This is parallel to the findings of Jenkins et al. (Citation2003), Johansson (Citation1999), Lisboa et al. (Citation2018), and Porte et al. (Citation2002). According to Ebuy et al. (Citation2011), a model that solely employs DBH is more suitable for handling data from forest inventories. Unlike DBH, height is not directly measured in forest inventories, which makes it more susceptible to measurement errors and unstandardized height measurement (Sileshi Citation2014; Lisboa et al. Citation2018; Magalhães et al. Citation2021). Information on tree height is particularly important in diameter-height and BEF models, which serve purposes other than direct computation of AGB (Lisboa et al. Citation2018; Mahmood et al. 2020). Despite having a higher probability of prediction, models that incorporate tree height might consequence in biased results due to measurement errors in tree height (Magalhães et al. Citation2021). Although Chave et al. (Citation2005) employed tree height to estimate AGB in pantropical moist forests, Feldpausch et al. (Citation2012) emphasized that doing so led to a 13% underestimation of carbon storage.
In cases where tree height is preferred to be integrated in biomass modeling, it is commonly taken into account either as a separate variable in addition to DBH (as in MDH2) or as a combined variable (DBH2×TH) (as in MDH1) (Sileshi Citation2014; Magalhães et al. Citation2021). In our study, including tree height separately as a second variable (MDH2) performed better than the combined (). While this finding is consistent with Magalhães et al. (Citation2021), Monika et al. (Citation2015), and Vahedi et al. (Citation2014), it contradicts Bi et al. (Citation2004) and Carvalho and Parresol (Citation2003), who reported that the model with a combined predictor (DBH2×TH) produced better estimations. Beyond the variables considered in this study, other predictors that could be used to develop and improve the accuracy of biomass allometric models include wood density, crown ratio, and taper attributes (Temesgen et al. Citation2015), depending on the desired precision and the accessibility of these variables in the inventory contexts.
The precision of biomass estimation should be improved by formulating equations that compensate for the causes of variance in the allometric coefficients (Brown et al. Citation1989; Chave et al. Citation2014; Mukuralinda et al. Citation2021). In this study, since the sample trees were taken from the same ecoregion, wood density was not taken into account as an additional independent variable while developing the model, which is aligned with Magalhães et al. (Citation2021).
4.2. Comparison of biomass allometric models
It is imperative to contrast the application of a site- and species-specific model for estimating AGB with that of the common pantropical and regional allometric AGB models in order to validate the accurate estimation of biomass. Since tropical forests have a higher species diversity, generalized allometric models for tropical species have drawn a great deal of attention. There have been a number of models for predicting AGB that involve mixtures of tropical species (Haase and Haase Citation1995; Brown Citation1997; Nelson et al. Citation1999; Chambers et al. Citation2001; Ketterings et al. Citation2001; Chave et al. Citation2005, Citation2014; Pearson et al. Citation2005). Among these models, the most well-known are those developed by Brown (Citation1997), Chave et al. (Citation2005, Citation2014), and Pearson et al. (Citation2005), and were considered in this study. We compared the pantropical allometric AGB models with the developed site- and species-specific AGB model (MD2) following ME, RMSE, and MPE. The most widely used pantropical model by Chave et al. (Citation2005, Citation2014) was observed to be more accurate than the other considered pantropical models, even though it slightly overestimated biomass in this study (). This result is in agreement with the hypothesis that Chave et al.’s (Citation2005, Citation2014) model performs well for different forest types in several regions in South-East Asia (Rutishauser et al. Citation2013) and Africa (Vieilledent et al. Citation2012; Fayolle et al. Citation2013). The pantropical AGB allometric models from Pearson et al. (Citation2005) and Brown (Citation1997) did not match the context of the study; however, according to Lisboa et al. (Citation2018), Brown’s (Citation1997) model was tested well fitted in a mountain moist forest in Mozambique.
Biomass accounting using allometric models is complicated due to the major influences of various factors, such as tree species, topography, temperature, and rainfall (Chave et al. Citation2014). Moreover, the applicability of allometric models can be explained by factors like habitat type (i.e. forests, plantations, or agroforestry), tree growth forms, and site characteristics (Brown et al. Citation1989; Brown Citation1997; Chave et al. Citation2005; Henry et al. Citation2010; Alvarez et al. Citation2012; Rutishauser et al. Citation2013). However, Gibbs et al. (Citation2007) asserted that developing a biomass allometric equation particular to a species or site would not typically increase the accuracy of AGB estimation. Contrary to the findings of Gibbs et al. (Citation2007), this study’s results, regarding the performance of the common pantropical models, are consistent with the findings of several other studies (Clark et al. Citation2001; Pilli et al. Citation2006; Basuki et al. Citation2009; van Breugel et al. Citation2011; Alvarez et al. Citation2012; Ngomanda et al. Citation2014; Hossain et al. Citation2021), who found that the pantropical models did not accurately capture the variability of biomass estimation on the global scale. Two of the pantropical models that had been put to the test (i.e. Brown Citation1997; Pearson et al. Citation2005) demonstrated such, while Chave et al.’s (Citation2005, Citation2014) moist pantropical model did better than them and could be used in this study region provided a site-adapted wood density value is considered ( and ). Regardless, our proposed model (MD2) provides comparatively more accurate estimation, is more convenient and is best suited for the Sengon forests in the Kalimantan region. When the existing AGB models for Sengon developed by Rusolono (Citation2006) and Siregar (Citation2007) in Java were considered, a trend of overestimation was observed (). This indicates that these models were not well suited for estimating AGB in Sengon smallholder plantations in Central Kalimantan, where pronounced climatic and site differences exist compared to the Java province where the models were developed, regardless of statistical difference.
4.3. Indirect biomass estimation
Estimating the biomass of a comparatively larger area, such as the entire country or a specific region, might be impractical using the site- and species-specific allometric models for each species (Brown Citation1997; Komiyama et al. Citation2005; Mahmood et al. Citation2016). In these circumstances, the wood density, BEF, stem volume, and form factor are used to estimate the AGB (Nogueira et al. Citation2008; Lisboa et al. Citation2018; Mahmood et al. 2020), as demonstrated in this study. The previously recorded wood density for Sengon at the Indonesian plantation site: 271 kg/m3 (Budiman et al. Citation2020) and 230–500 kg/m3 (Varis Citation2011) can be compared with the average WBD obtained in this study (0.28 g/cm3 or 282.52 kg/m3) (). Muller‐Landau (Citation2004) recommended that the site average WBD value should be weighted by wood volume for biomass computations, thus validating the use of 282.52 kg/m3 as WBD for estimating Sengon AGB in this study.
In contrast to the previously recorded BEF value for Sengon in Indonesia: 1.34 (Rusolono Citation2006) and the BEF value suggested by the Intergovernmental Panel on Climate Change (IPCC) for tropical broadleaf species: 3.4 (2.0–9.0) (Penman et al. Citation2003), this study computed an average BEF of 1.69 (). Although the BEF estimate at the study location was lower than the IPCC’s value for tropical broadleaf forest stands, it was comparable to the value reported by Rusolono (Citation2006). Tropical forests, as opposed to temperate forests, have larger tree crowns, which, according to Brown (Citation2002), leads to higher BEF for a given volume and tree size. The average BEF for primary, secondary, and nonproductive rainforests in Sri Lanka, as per Brown et al. (Citation1989), were 2.02, 2.26, and 4.48, respectively. These figures indicate that the mean BEF found in this study is even lower than the values for Sri Lanka’s primary and secondary forests, possibly as a result of frequent management interventions at the FSF plantation site, where trees prefer to grow taller with clear boles rather than large crown sizes. However, the mean BEF value computed in this study is comparable to the mean BEF value found by Segura and Kanninen (Citation2005) in Costa Rica’s tropical humid forest (1.60).
In order to assess the applicability of existing merchantable volume models (Siswanto Citation2008) for the studied species in the Indonesian plantation context, as well as Smalian’s volume in estimating AGB, the BEF and WBD for Sengon were initially estimated at the site level, similar to Lisboa et al. (Citation2018). Apart from statistical difference, the two existing merchantable volume models tended to overestimate AGB with a relatively greater deviation from the developed AGB allometric model (MD2) in this study. This is consistent with Lisboa et al. (Citation2018)’s findings on the relatively higher biomass accounting tendency of indirect BEF-biomass approaches. However, Smalian’s volume somewhat underestimated AGB, close to the accuracy of the model (MD2), which is in opposition to the results of Lisboa et al. (Citation2018). The accuracy of the suggested model (MD2) is further confirmed by this closer estimation of AGB utilizing Smalian’s volume coupled with site-adapted mean BEF and WBD values. Thus, in addition to the developed biomass model (MD2), this study recommends the use of merchantable volume derived from Smalian’s formula with computed WBD and BEF values at the site and species level in AGB estimation.
5. Conclusion and recommendations
Developing accurate allometric equations is crucial for estimating tree biomass in forest environments, as it indirectly aids in monitoring and assessing the global carbon cycle. However, employing the general pantropical allometric equations poses a drawback in accurately estimating biomass for specific species. This issue becomes particularly problematic for the estimation of carbon stock in tropical forests in Asia or South-East Asia due to their biological heterogeneity and variety of species. The primary objective of this study was to develop biomass allometric model for the total AGB estimation of Sengon in smallholder plantations, Central Kalimantan, Indonesia. This served as an initial step toward accurately computing AGB carbon stock, and ultimately providing carbon compensation from global carbon markets. The best-fit AGB allometric model was developed using the power regression equation (MD2), which only used DBH as an independent variable: and displayed the highest predictive accuracy metrics. The inclusion of TH as an additional independent variable with DBH did not significantly improve the model’s fit. As a result, this study advises using the model with DBH alone as the predictor rather than incorporating both DBH and TH. Comparing global and regional AGB allometric models revealed that the selected model in this study (MD2) was more accurate for predicting the AGB of trees based on field observations. This indicates that the proposed model is valid and can be used to estimate AGB in the study area and plantation within the Kalimantan region for the given species with a higher level of accuracy compared to the global and regional models. Furthermore, the average BEF value from this study (1.69) can be utilized to estimate AGB by converting the merchantable volume from forest inventory data and Smalian’s formula as illustrated by the nonsignificant difference to MD2. However, BEF overestimated the AGB when existing merchantable volume models in Java were taken into account despite statistical differences. To recapitulate, the findings of this study will contribute to the long-term management of smallholder Sengon plantations as a strategy to combat climate change and will provide a solid foundation for estimating sequestered AGB carbon. Moreover, this study model could be improved with additional data, especially with larger trees, which were not available at the study site. Future research could consider a comprehensive review of site characteristics and their inclusion in allometric model fitting for even more accurate biomass estimation and to account for growth variance. It is also recommended, if feasible, to validate the suggested model using a separate destructive dataset.
Disclosure statement
The authors declare that they have no potential competing financial or non-financial interest that could have influenced the work reported in this paper.
Data availability statement
Dataset used during this study are available from the corresponding author on plausible request.
Additional information
Funding
Notes
1 HKm: A sort of social forestry authorization that allows local communities to participate in the forest management with the goal of financially empowering those communities.
References
- Alvarez E, Duque A, Saldarriaga J, Cabrera K, de Las Salas G, del Valle I, Lema A, Moreno F, Orrego S, Rodríguez L. 2012. Tree above-ground biomass allometries for carbon stocks estimation in the natural forests of Colombia. Forest Ecol Manage. 267:297–308. doi: 10.1016/j.foreco.2011.12.013.
- Anitha K, Verchot LV, Joseph S, Herold M, Manuri S, Avitabile V. 2015. A review of forest and tree plantation biomass equations in Indonesia. Ann Forest Sci. 72(8):981–997. doi: 10.1007/s13595-015-0507-4.
- Aukland L, Costa PM, Brown S. 2003. A conceptual framework and its application for addressing leakage: the case of avoided deforestation. Climate Policy. 3(2):123–136. doi: 10.1016/S1469-3062(02)00065-7.
- Basuki TM, Van Laake PE, Skidmore AK, Hussin YA. 2009. Allometric equations for estimating the above-ground biomass in tropical lowland Dipterocarp forests. Forest Ecol Manage. 257(8):1684–1694. doi: 10.1016/j.foreco.2009.01.027.
- Bi H, Turner J, Lambert MJ. 2004. Additive biomass equations for native eucalypt forest trees of temperate Australia. Trees. 18(4):467–479. doi: 10.1007/s00468-004-0333-z.
- Birdsey R, Angeles-Perez G, Kurz WA, Lister A, Olguin M, Pan Y, Wayson C, Wilson B, Johnson K. 2013. Approaches to monitoring changes in carbon stocks for REDD+. Carbon Manage. 4(5):519–537. doi: 10.4155/cmt.13.49.
- Böttcher H, Eisbrenner K, Fritz S, Kindermann G, Kraxner F, McCallum I, Obersteiner M. 2009. An assessment of monitoring requirements and costs of reduced emissions from deforestation and degradation. Carbon Balance Manage. 4(1):1–14. doi: 10.1186/1750-0680-4-7.
- van Breugel M, Ransijn J, Craven D, Bongers F, Hall JS. 2011. Estimating carbon stock in secondary forests: decisions and uncertainties associated with allometric biomass models. Forest Ecol Manage. 262(8):1648–1657. doi: 10.1016/j.foreco.2011.07.018.
- Broich M, Hansen M, Stolle F, Potapov P, Margono BA, Adusei B. 2011. Remotely sensed forest cover loss shows high spatial and temporal variation across Sumatera and Kalimantan, Indonesia 2000–2008. Environ Res Lett. 6(1):014010. doi: 10.1088/1748-9326/6/1/014010.
- Brown S. 1997. Estimating biomass and biomass change of tropical forests: a primer. UN FAO Forestry Paper 134. Rome: Food and Agriculture Org.
- Brown S. 2002. Measuring carbon in forests: current status and future challenges. Environ Pollut. 116(3):363–372. doi: 10.1016/s0269-7491(01)00212-3.
- Brown S, Gillespie AJR, Lugo AE. 1989. Biomass estimation methods for tropical forests with applications to forest inventory data. Forest Sci. 35(4):881–902.
- Budiman I, Purnawati R, Siruru H, Hadi YS. 2020. Physical and mechanical properties of five Indonesian wood treated with polystyrene. IOP Conf Ser: Earth Environ Sci. 572(1):012039. doi: 10.1088/1755-1315/572/1/012039.
- Carvalho JP, Parresol BR. 2003. Additivity in tree biomass components of Pyrenean oak (Quercus pyrenaica Willd.). For Ecol Manage. 179(1–3):269–276. doi: 10.1016/S0378-1127(02)00549-2.
- Chambers JQ, dos Santos J, Ribeiro RJ, Higuchi N. 2001. Tree damage, allometric relationships, and above-ground net primary production in central Amazon forest. Forest Ecol Manage. 152(1–3):73–84. doi: 10.1016/S0378-1127(00)00591-0.
- Chave J, Andalo C, Brown S, Cairns MA, Chambers JQ, Eamus D, Fölster H, Fromard F, Higuchi N, Kira T, et al. 2005. Tree allometry and improved estimation of carbon stocks and balance in tropical forests. Oecologia. 145(1):87–99. doi: 10.1007/s00442-005-0100-x.
- Chave J, Réjou-Méchain M, Búrquez A, Chidumayo E, Colgan MS, Delitti WBC, Duque A, Eid T, Fearnside PM, Goodman RC, et al. 2014. Improved allometric models to estimate the aboveground biomass of tropical trees. Glob Chang Biol. 20(10):3177–3190. doi: 10.1111/gcb.12629.
- Clark DA, Brown S, Kicklighter DW, Chambers JQ, Thomlinson JR, Ni J. 2001. Measuring net primary production in forests: concepts and field methods. Ecol Appl. 11(2):356–370. doi: 10.1890/1051-0761(2001)011[0356:MNPPIF.2.0.CO;2]
- Climate-data.org. 2022. Climate: Central Kalimantan. [accessed 2022 Sept 15]. https://en.climate-data.org/asia/indonesia/central-kalimantan-1214/.
- Curran LM, Trigg SN, McDonald AK, Astiani D, Hardiono YM, Siregar P, Caniago I, Kasischke E. 2004. Lowland forest loss in protected areas of Indonesian Borneo. Science. 303(5660):1000–1003. doi: 10.1126/science.1091714.
- Daba DE, Soromessa T. 2019. The accuracy of species-specific allometric equations for estimating aboveground biomass in tropical moist montane forests: case study of Albizia grandibracteata and Trichilia dregeana. Carbon Balance Manage. 14(1):1–13. doi: 10.1186/s13021-019-0134-8.
- Earth Innovation Institute. 2020. Central Kalimantan, Indonesia. [accessed 2022 September 24]. https://forestchampions.org/jxd_reports/en_Central%20Kalimantan_Indonesia.pdf.
- Ebeling J, Yasué M. 2008. Generating carbon finance through avoided deforestation and its potential to create climatic, conservation and human development benefits. Philos Trans R Soc Lond B Biol Sci. 363(1498):1917–1924. doi: 10.1098/rstb.2007.0029.
- Ebuy J, Lokombe JP, Ponette Q, Sonwa D, Picard N. 2011. Allometric equation for predicting aboveground biomass of three tree species. J Trop Forest Sci. 23(2):125–132.
- Enquist BJ, West GB, Charnov EL, Brown JH. 1999. Allometric scaling of production and life-history variation in vascular plants. Nature. 401(6756):907–911. doi: 10.1038/44819.
- Fairventures Social Forestry. 2022. Planting.Climate.Action. [accessed 2022 July 5]. https://fairventures.earth.
- Fairventures Worldwide. 2021. Forest Landscape Restoration in Central Kalimantan. [accessed 2022 July 5]. https://fairventures.org/wp-content/uploads/2021/11/FLR-Study.pdf.
- Fayolle A, Doucet J-L, Gillet J-F, Bourland N, Lejeune P. 2013. Tree allometry in Central Africa: testing the validity of pantropical multi-species allometric equations for estimating biomass and carbon stocks. Forest Ecol Manage. 305:29–37. doi: 10.1016/j.foreco.2013.05.036.
- Feldpausch TR, Lloyd J, Lewis SL, Brienen RJW, Gloor M, Monteagudo Mendoza A, Lopez-Gonzalez G, Banin L, Abu Salim K, Affum-Baffoe K, et al. 2012. Tree height integrated into pantropical forest biomass estimates. Biogeosciences. 9(8):3381–3403. doi: 10.5194/bg-9-3381-2012.
- Ferraz A, Saatchi S, Xu L, Hagen S, Chave J, Yu Y, Meyer V, Garcia M, Silva C, Roswintiart O, et al. 2018. Carbon storage potential in degraded forests of Kalimantan, Indonesia. Environ Res Lett. 13(9):095001. doi: 10.1088/1748-9326/aad782.
- Fisher MR, Moeliono M, Mulyana A, Yuliani EL, Adriadi A, Kamaluddin, Judda J, Sahide MAK. 2018. Assessing the new social forestry project in Indonesia: recognition, livelihood and conservation? Int Forest Rev. 20(3):346–361. doi: 10.1505/146554818824063014.
- Gibbs HK, Brown S, Niles JO, Foley JA. 2007. Monitoring and estimating tropical forest carbon stocks: making REDD a reality. Environ Res Lett. 2(4):045023. doi: 10.1088/1748-9326/2/4/045023.
- Goodman RC, Phillips OL, Baker TR. 2014. The importance of crown dimensions to improve tropical tree biomass estimates. Ecol Appl. 24(4):680–698. doi: 10.1890/13-0070.1.
- Grassi G, House J, Dentener F, Federici S, den Elzen M, Penman J. 2017. The key role of forests in meeting climate targets requires science for credible mitigation. Nature Clim Change. 7(3):220–226. doi: 10.1038/nclimate3227.
- Guangyi M, Yujun S, Saeed S. 2017. Models for predicting the biomass of cunninghamialanceolata trees and stands in Southeastern China. PLoS One. 12(1):e0169747. doi: 10.1371/journal.pone.0169747.
- Guedes BS, Sitoe AA, Olsson BA. 2018. Allometric models for managing lowland miombo woodlands of the Beira corridor in Mozambique. Glob Ecol Conserv. 13:e00374. doi: 10.1016/j.gecco.2018.e00374.
- Haase R, Haase P. 1995. Above-ground biomass estimates for invasive trees and shrubs in the Pantanal of Mato Grosso, Brazil. Forest Ecol Manage. 73(1–3):29–35. doi: 10.1016/0378-1127(94)03509-U.
- Hansen MC, Stehman SV, Potapov PV, Arunarwati B, Stolle F, Pittman K. 2009. Quantifying changes in the rates of forest clearing in Indonesia from 1990 to 2005 using remotely sensed data sets. Environ Res Lett. 4(3):034001. doi: 10.1088/1748-9326/4/3/034001.
- Hauk S, Skibbe K, Röhle H, Schröder J, Wittkopf S, Knoke T. 2015. Nondestructive estimation of biomass yield for short-rotation woody crops is reliable and shows high yields for commercial stands in Bavaria. Bioenerg Res. 8(3):1401–1413. doi: 10.1007/s12155-015-9602-5.
- Henry M, Besnard A, Asante WA, Eshun J, Adu-Bredu S, Valentini R, Bernoux M, Saint-André L. 2010. Wood density, phytomass variations within and among trees, and allometric equations in a tropical rainforest of Africa. Forest Ecol Manage. 260(8):1375–1388. doi: 10.1016/j.foreco.2010.07.040.
- Henry M, Bombelli A, Trotta C, Alessandrini A, Birigazzi L, Sola G, Vieilledent G, Santenoise P, Longuetaud F, Valentini R, et al. 2013. GlobAllomeTree: international platform for tree allometric equations to support volume, biomass and carbon assessment. iForest. 6(6):326–330. doi: 10.3832/ifor0901-006.
- Hossain M, Saha C, Dhali R, Saha S, Siddique MRH, Abdullah SMR, Islam SMZ. 2021. Stem and total above-ground biomass models for the tree species of freshwater wetlands forest, coastal areas and dry areas of Bangladesh: using a non-destructive approach. Open J Forest. 11(2):73–82. doi: 10.4236/ojf.2021.112006.
- Hossain M, Siddique MRH, Abdullah SMR, Akhter M, Islam SMZ. 2016. Field measurement protocol on tree allometric equations for estimating above-ground biomass and volume in Bangladesh. [accessed 2022 July 5]. http://bfis.bforest.gov.bd/library/field-measurement-protocol-on-tree-allometric-equations-for-estimating-above-ground-biomass-and-volume-in-bangladesh/.
- Hossain M, Siddique MRH, Saha S, Abdullah SM. 2015. Allometric models for biomass, nutrients and carbon stock in Excoecaria agallocha of the Sundarbans, Bangladesh. Wetlands Ecol Manage. 23(4):765–774. doi: 10.1007/s11273-015-9419-1.
- Jenkins JC, Chojnacky DC, Heath LS, Birdsey RA. 2003. National-scale biomass estimators for United States tree species. Forest Sci. 49(1):12–35.
- Johansson T. 1999. Biomass equations for determining fractions of pendula and pubescent birches growing on abandoned farmland and some practical implications. Biomass Bioenergy. 16(3):223–238. doi: 10.1016/S0961-9534(98)00075-0.
- Kachamba DJ, Eid T, Gobakken T. 2016. Above-and belowground biomass models for trees in the miombo woodlands of Malawi. Forests. 7(2):38. doi: 10.3390/f7020038.
- Kebede B, Soromessa T. 2018. Allometric equations for aboveground biomass estimation of Olea europaea L. subsp. cuspidata in Mana Angetu Forest. Ecosyst Health Sustain. 4(1):1–12. doi: 10.1080/20964129.2018.1433951.
- Kenzo T, Ichie T, Hattori D, Itioka T, Handa C, Ohkubo T, Kendawang JJ, Nakamura M, Sakaguchi M, Takahashi N, et al. 2009. Development of allometric relationships for accurate estimation of above-and below-ground biomass in tropical secondary forests in Sarawak, Malaysia. J Trop Ecol. 25(4):371–386. doi: 10.1017/S0266467409006129.
- Ketterings QM, Coe R, van Noordwijk M, Ambagau’ Y, Palm CA. 2001. Reducing uncertainty in the use of allometric biomass equations for predicting above-ground tree biomass in mixed secondary forests. Forest Ecol Manage. 146(1–3):199–209. doi: 10.1016/S0378-1127(00)00460-6.
- Köhl M, Neupane PR, Mundhenk P. 2020. REDD + measurement, reporting and verification–A cost trap? Implications for financing REDD + MRV costs by result-based payments. Ecol Econ. 168:106513. doi: 10.1016/j.ecolecon.2019.106513.
- Komiyama A, Poungparn S, Kato S. 2005. Common allometric equations for estimating the tree weight of mangroves. J Trop Ecol. 21(4):471–477. doi: 10.1017/S0266467405002476.
- Krisnawati H, Adinugroho WC, Imanuddin R. 2012. Allometric models for estimating tree biomass at various forest ecosystem types in Indonesia: monograph. Climate Technology Centre and Network, Denmark.
- Kronseder K, Ballhorn U, Böhm V, Siegert F. 2012. Above ground biomass estimation across forest types at different degradation levels in Central Kalimantan using LiDAR data. Int J Appl Earth Obs Geoinf. 18:37–48. doi: 10.1016/j.jag.2012.01.010.
- Lisboa SN, Guedes BS, Ribeiro N, Sitoe A. 2018. Biomass allometric equation and expansion factor for a mountain moist evergreen forest in Mozambique. Carbon Balance Manage. 13(1):1–16. doi: 10.1186/s13021-018-0111-7.
- Litton CM, Kauffman JB. 2008. Allometric models for predicting aboveground biomass in two widespread woody plants in Hawaii. Biotropica. 40(3):313–320. doi: 10.1111/j.1744-7429.2007.00383.x.
- Magalhães TM, Cossa VN, Guedes BS, Fanheiro ASM. 2021. Species-specific biomass allometric models and expansion factors for indigenous and planted forests of the Mozambique highlands. J Forest Res. 32(3):1047–1065. doi: 10.1007/s11676-020-01156-0.
- Magalhães TM, Seifert T. 2015. Tree component biomass expansion factors and root-to-shoot ratio of Lebombo ironwood: measurement uncertainty. Carbon Balance Manage. 10(1):1–14. doi: 10.1186/s13021-015-0019-4.
- Mahmood H, Siddique MRH, Abdullah SMR, Islam SMZ, Matieu H, Iqbal MZ, Akhter M. 2020a. Semi-destructive method to derive allometric aboveground biomass model for village forest of Bangladesh: comparison of regional and pantropical models. J Trop Forest Sci. 32(3):246–256. doi: 10.26525/jtfs2020.32.3.246.
- Mahmood H, Siddique MRH, Akhter M. 2016. A critical review and database of biomass and volume allometric equation for trees and shrubs of Bangladesh. IOP Conf Ser: Earth Environ Sci. 39:012057. doi: 10.1088/1755-1315/39/1/012057.
- Mahmood H, Siddique MRH, Islam SM, Abdullah SM, Matieu H, Iqbal M, Akhter M. 2020b. Applicability of semi-destructive method to derive allometric model for estimating aboveground biomass and carbon stock in the Hill zone of Bangladesh. J Forest Res. 31(4):1235–1245. doi: 10.1007/s11676-019-00881-5.
- Makundi RW. 2014. Perspectives de REDD + dans les plantations forestières africaines. Working Paper Series, African Forest Forum, Vol. 2, p. 28.
- Malimbwi RE, Solberg B, Luoga E. 1994. Estimation of biomass and volume in miombo woodland at Kitulangalo Forest Reserve, Tanzania. J Trop Forest Sci. 7(2):230–242.
- Marquet PA, Quiñones RA, Abades S, Labra F, Tognelli M, Arim M, Rivadeneira M. 2005. Scaling and power-laws in ecological systems. J Exp Biol. 208(Pt 9):1749–1769. doi: 10.1242/jeb.01588.
- Mate R, Johansson T, Sitoe A. 2014. Biomass equations for tropical forest tree species in Mozambique. Forests. 5(3):535–556. doi: 10.3390/f5030535.
- Mayer DG, Butler DG. 1993. Statistical validation. Ecol Model. 68(1–2):21–32. doi: 10.1016/0304-3800(93)90105-2.
- Ministry of Environment and Forestry. 2020. The State of Indonesia’s Forests 2020. [accessed 2022 September 24]. https://indonesianembassy.de/wp-content/uploads/2020/12/FA-Rev-01-Booklet-EXECUTIVE-SUMMARY-SOFO-2020-A5_ENG-12.24.20_compressed-1.pdf.
- Moeliono M, Limberg G. 2012. The decentralization of forest governance: politics, economics and the fight for control of forests in Indonesian Borneo. London, UK: Routledge.
- Monika V, Daniel Z, Tomáš Vít ČŠ. 2015. Models for predicting aboveground biomass of European beech (Fagus sylvatica L.) in the Czech Republic. J Forest Sci. 61(2):45–54.
- Mugasha WA, Eid T, Bollandsås OM, Malimbwi RE, Chamshama SAO, Zahabu E, Katani JZ. 2013. Allometric models for prediction of above-and belowground biomass of trees in the miombo woodlands of Tanzania. Forest Ecol Manage. 310:87–101. doi: 10.1016/j.foreco.2013.08.003.
- Mugasha WA, Mwakalukwa EE, Luoga E, Malimbwi RE, Zahabu E, Silayo DS, Sola G, Crete P, Henry M, Kashindye A. 2016. Allometric models for estimating tree volume and aboveground biomass in lowland forests of Tanzania. Int J Forest Res. 2016:1–13. doi: 10.1155/2016/8076271.
- Mukuralinda A, Kuyah S, Ruzibiza M, Ndoli A, Nabahungu NL, Muthuri C. 2021. Allometric equations, wood density and partitioning of aboveground biomass in the arboretum of Ruhande, Rwanda. Trees, Forests People. 3:100050. doi: 10.1016/j.tfp.2020.100050.
- Muller‐Landau HC. 2004. Interspecific and inter‐site variation in wood specific gravity of tropical trees. Biotropica. 36(1):20–32. doi: 10.1111/j.1744-7429.2004.tb00292.x.
- Mwakalukwa EE, Meilby H, Treue T. 2014. Volume and aboveground biomass models for dry miombo woodland in Tanzania. Int J for Res. 2014:1–11. doi: 10.1155/2014/531256.
- Nath PK, Behera B. 2011. A critical review of impact of and adaptation to climate change in developed and developing economies. Environ Dev Sustain. 13(1):141–162. doi: 10.1007/s10668-010-9253-9.
- Nawir AA, Murniati RL, Hiyama C, Gumartini T. 2007. Portraits of rehabilitation projects in Indonesia: impacts and lesson learnt. In: Nawir AA, Murniati RL, Rumboko L, editors. Forest Rehabilitation in Indonesia: where to after more than three decades. Bogor, Indonesia: CIFOR; p. 113–175.
- Nelson BW, Mesquita R, Pereira JLG, De Souza SGA, Batista GT, Couto LB. 1999. Allometric regressions for improved estimate of secondary forest biomass in the central Amazon. Forest Ecol Manage. 117(1–3):149–167. doi: 10.1016/S0378-1127(98)00475-7.
- Ngomanda A, Engone Obiang NL, Lebamba J, Moundounga Mavouroulou Q, Gomat H, Mankou GS, Loumeto J, Midoko Iponga D, Kossi Ditsouga F, Zinga Koumba R, et al. 2014. Site-specific versus pantropical allometric equations: which option to estimate the biomass of a moist central African forest? Forest Ecol Manage. 312:1–9. doi: 10.1016/j.foreco.2013.10.029.
- Niklas KJ. 2006. A phyletic perspective on the allometry of plant biomass-partitioning patterns and functionally equivalent organ-categories. New Phytol. 171(1):27–40. doi: 10.1111/j.1469-8137.2006.01760.x.
- Nogueira EM, Fearnside PM, Nelson BW, Barbosa RI, Keizer EWH. 2008. Estimates of forest biomass in the Brazilian Amazon: new allometric equations and adjustments to biomass from wood-volume inventories. Forest Ecol Manage. 256(11):1853–1867. doi: 10.1016/j.foreco.2008.07.022.
- Oluwajuwon TV. 2022. Form factors and volume models for Paraserianthes Falcataria (Sengon) in smallholder plantation forests of Central Kalimantan, Indonesia [MSc dissertation]. Dresden, Germany: Technische Universität Dresden.
- Osaka S, Bellamy R, Castree N. 2021. Framing “nature‐based” solutions to climate change. Wiley Interdiscip Rev Clim Change. 12(5):e729. doi: 10.1002/wcc.729.
- Pachauri RK, Allen MR, Barros VR, Broome J, Cramer W, Christ R, Church JA, Clarke L, Dahe Q, Dasgupta P. 2014. Climate change 2014: synthesis report. Contribution of Working Groups I, II and III to the fifth assessment report of the Intergovernmental Panel on Climate Change. IPCC.
- Pachauri RK, Reisinger A. 2007. Climate Change 2007: synthesis report. Cambridge, UK: Intergovernmental Panel on Climate Change.
- Packard GC. 2014. Multiplicative by nature: logarithmic transformation in allometry. J Exp Zool B Mol Dev Evol. 322(4):202–207. doi: 10.1002/jez.b.22570.
- Packard GC, Birchard GF, Boardman TJ. 2011. Fitting statistical models in bivariate allometry. Biol Rev Camb Philos Soc. 86(3):549–563. doi: 10.1111/j.1469-185X.2010.00160.x.
- Page S, Hosciło A, Wösten H, Jauhiainen J, Silvius M, Rieley J, Ritzema H, Tansey K, Graham L, Vasander H, et al. 2009. Restoration ecology of lowland tropical peatlands in Southeast Asia: current knowledge and future research directions. Ecosystems. 12(6):888–905. doi: 10.1007/s10021-008-9216-2.
- Pajtík J, Konôpka B, Lukac M. 2011. Individual biomass factors for beech, oak and pine in Slovakia: a comparative study in young naturally regenerated stands. Trees. 25(2):277–288. doi: 10.1007/s00468-010-0504-z.
- Pearson T, Walker S, Brown S. 2005. Sourcebook for land-use, land-use change and forestry projects. Arlington (TX): Winrock International and the Bio-carbon fund of the World Bank.
- Pearson T, Walker S, Brown S. 2013. Sourcebook for land use, land-use change and forestry projects. Arlington (TX): Winrock International and the Bio-carbon fund of the World Bank.
- Pender J, Suyanto JK, Kato E. 2008. Impacts of the Hutan Kamasyarakatan social forestry program in the Sumberjaya watershed, West Lampung district of Sumatra, Indonesia. IFPRI Discussion Paper. Int Food Policy Res Inst.
- Peng C. 2000. Understanding the role of forest simulation models in sustainable forest management. Environ Impact Assess Rev. 20(4):481–501. doi: 10.1016/S0195-9255(99)00044-X.
- Penman J, Gytarsky M, Hiraishi T, Krug T, Kruger D, Pipatti R, Buendia L, Miwa K, Ngara T, Tanabe K. 2003, editors. Good practice guidance for land use, land-use change and forestry. IPCC National Greenhouse Gas Inventories Programme, IGES.
- Pilli R, Anfodillo T, Carrer M. 2006. Towards a functional and simplified allometry for estimating forest biomass. Forest Ecol Manage. 237(1–3):583–593. doi: 10.1016/j.foreco.2006.10.004.
- Porte A, Trichet P, Bert D, Loustau D. 2002. Allometric relationships for branch and tree woody biomass of Maritime pine (Pinus pinaster Aıt.). Forest Ecol Manage. 158(1–3):71–83. doi: 10.1016/S0378-1127(00)00673-3.
- R Core Team. 2022. R: a language and environment for statistical computing. Vienna, Austria: R Foundation for Statistical Computing.
- Ravindranath NH, Ostwald M. 2007. Carbon inventory methods: handbook for greenhouse gas inventory, carbon mitigation and roundwood production projects. Heidelberg, Germany: Springer Science and Business Media.
- Rusolono T. 2006. Model Pendugaan Persediaan Karbon Tegakan Agroforestri untuk Pengelolaan Hutan Milik Melalui Skema Perdagangan Karbon [Disertasi]. Bogor (ID): Institut Pertanian Bogor, Indonesia.
- Rutishauser E, Noor’an F, Laumonier Y, Halperin J, Rufi’ie Hergoualc’h K, Verchot L. 2013. Generic allometric models including height best estimate forest biomass and carbon stocks in Indonesia. Forest Ecol Manage. 307:219–225. doi: 10.1016/j.foreco.2013.07.013.
- Saha C, Mahmood H, Nayan SNS, Siddique MRH, Abdullah SMR, Islam SMZ, Iqbal MZ, Akhter M. 2021. Allometric biomass models for the most abundant fruit tree species of Bangladesh: a non-destructive approach. Environ Challenges. 3:100047. doi: 10.1016/j.envc.2021.100047.
- Saint-André L, M’Bou AT, Mabiala A, Mouvondy W, Jourdan C, Roupsard O, Deleporte P, Hamel O, Nouvellon Y. 2005. Age-related equations for above-and below-ground biomass of a Eucalyptus hybrid in Congo. Forest Ecol Manage. 205(1–3):199–214. doi: 10.1016/j.foreco.2004.10.006.
- Sandker M, Suwarno A, Campbell BM. 2007. Will forests remain in the face of oil palm expansion? Simulating change in Malinau, Indonesia. Ecol Society. 12(2):37. doi: 10.5751/ES-02292-120237.
- Sanquetta CR, Dalla Corte AP, Behling A, de Oliveira Piva LR, Péllico Netto S, Rodrigues AL, Sanquetta MNI. 2018. Selection criteria for linear regression models to estimate individual tree biomasses in the Atlantic Rain Forest, Brazil. Carbon Balance Manage. 13(1):1–15. doi: 10.1186/s13021-018-0112-6.
- Segura M, Kanninen M. 2005. Allometric models for tree volume and total aboveground biomass in a tropical humid forest in Costa Rica 1. Biotropica. 37(1):2–8. doi: 10.1111/j.1744-7429.2005.02027.x.
- Sileshi GW. 2014. A critical review of forest biomass estimation models, common mistakes and corrective measures. Forest Ecol Manage. 329:237–254. doi: 10.1016/j.foreco.2014.06.026.
- Siregar CA. 2007. Formulasi Allometri Biomasa Dan Konservasi Karbon Tanah Hutan Tanaman Sengon (Paraserianthes Falcataria (L.) Nielsen) Di Kediri. Jurpenhutkonsevasialam. 4(2):139–149. doi: 10.20886/jphka.2007.4.2.139-149.
- Siswanto BE. 2008. Model pendugaan volume pohon sengon (Paraserianthes falcataria) di Kesatuan Pemangkuan Hutan Kediri, Jawa Timur. J Penelit Hutan Tanam. 5(2):301–305.
- Somogyi Z, Cienciala E, Mäkipää R, Muukkonen P, Lehtonen A, Weiss P. 2007. Indirect methods of large-scale forest biomass estimation. Eur J Forest Res. 126(2):197–207. doi: 10.1007/s10342-006-0125-7.
- Stefanakis AI, Calheiros CSC, Nikolaou I. 2021. Nature-based solutions as a tool in the new circular economic model for climate change adaptation. CircEconSust. 1(1):303–318. doi: 10.1007/s43615-021-00022-3.
- Suwarno A, Hein L, Sumarga E. 2015. Governance, decentralisation and deforestation: the case of central Kalimantan Province, Indonesia. Q J Int Agric. 54(892-2016–65240):77–100.
- Taskinen S, Warton DI. 2013. Robust tests for one or more allometric lines. J Theor Biol. 333:38–46. doi: 10.1016/j.jtbi.2013.05.010.
- Temesgen H, Affleck D, Poudel K, Gray A, Sessions J. 2015. A review of the challenges and opportunities in estimating above ground forest biomass using tree-level models. Scand J Forest Res. 30(4):1–10. doi: 10.1080/02827581.2015.1012114.
- Traoré S, Djomo AN, N’guessan AK, Coulibaly B, Ahoba A, Gnahoua GM, N’guessan ÉK, Yao CYA, N’Dja JK, Guédé NZ. 2018. Stand structure, allometric equations, biomass and carbon sequestration capacity of Acacia mangium Wild. (Mimosaceae) in Cote d’Ivoire. Open J Forest. 8(1):42–60. doi: 10.4236/ojf.2018.81004.
- Tumwebaze SB, Bevilacqua E, Briggs R, Volk T. 2013. Allometric biomass equations for tree species used in agroforestry systems in Uganda. Agroforest Syst. 87(4):781–795. doi: 10.1007/s10457-013-9596-y.
- Vahedi AA, Mataji A, Babayi-Kafaki S, Eshaghi-Rad J, Hodjati SM, Djomo A. 2014. Allometric equations for predicting aboveground biomass of beech-hornbeam stands in the Hyrcanian forests of Iran. J Forest Sci. 60(6):236–247.
- Varis E. 2011. Stand growth and management scenarios for Paraserianthes falcataria smallholder plantations in Indonesia [master’s thesis]. Finland: University of Helsinki.
- Vieilledent G, Vaudry R, Andriamanohisoa SFD, Rakotonarivo OS, Randrianasolo HZ, Razafindrabe HN, Rakotoarivony CB, Ebeling J, Rasamoelina M. 2012. A universal approach to estimate biomass and carbon stock in tropical forests using generic allometric models. Ecol Appl. 22(2):572–583. doi: 10.1890/11-0039.1.
- Van der Werf GR, Morton DC, DeFries RS, Olivier JGJ, Kasibhatla PS, Jackson RB, Collatz GJ, Randerson JT. 2009. CO2 emissions from forest loss. Nature Geosci. 2(11):737–738. doi: 10.1038/ngeo671.
- West GB, Brown JH, Enquist BJ. 1999. The fourth dimension of life: fractal geometry and allometric scaling of organisms. Science. 284(5420):1677–1679. doi: 10.1126/science.284.5420.1677.
- Westman WE, Rogers RW. 1977. Biomass and structure of a subtropical eucalypt forest, North Stradbroke Island. Aust J Bot. 25(2):171–191. doi: 10.1071/BT9770171.
- Williams RJ, Zerihun A, Montagu KD, Hoffman M, Hutley LB, Chen X, Williams RJ, Zerihun A, Montagu KD, Hoffman M. 2005. Allometry for estimating aboveground tree biomass in tropical and subtropical eucalypt woodlands: towards general predictive equations. Aust J Bot. 53(7):607–619. doi: 10.1071/BT04149.
- Xiao X, White EP, Hooten MB, Durham SL. 2011. On the use of log‐transformation vs. nonlinear regression for analyzing biological power laws. Ecology. 92(10):1887–1894. doi: 10.1890/11-0538.1.
- Zianis D, Muukkonen P, Mäkipää R, Mencuccini M. 2005. Biomass and stem volume equations for tree species in Europe. Silva Fennica Monographs 4(4):63.