
 ?Mathematical formulae have been encoded as MathML and are displayed in this HTML version using MathJax in order to improve their display. Uncheck the box to turn MathJax off. This feature requires Javascript. Click on a formula to zoom.
Abstract
Dissolved organic carbon (DOC) in soils is released into streams, working as a main component of the carbon cycle. DOC in terrestrial and aquatic ecosystems participates in many biogeochemical reactions and processes such as heterotrophic respiration, sorption of metals, and transport of pollutants. In order to understand the connectivity of organic carbon among soil, soil water, and forest streams, we investigated the concentrations and dual carbon isotope ratios (δ13C and Δ14C) of soil organic carbon (SOC) and water-extractable organic carbon (WEOC) obtained from soils beneath two tree species stands, and compared these with stream Δ14C-DOC of the forest watershed. Soil samples were collected at different depths (0–10, 10–30, and 30–50 cm) beneath Japanese cedar (Cryptomeria japonica) and sawtooth oak (Quercus acutissima). Although the SOC concentration was not significantly different between the two tree species, the WEOC concentration ([WEOC]) of soil at 0–10 cm depth under Cryptomeria japonica was higher than that of Quercus acutissima, in general. The δ13C-SOC and δ13C-WEOC increased, while the Δ14C-SOC and Δ14C-WEOC decreased with increasing soil depth. The Δ14C-WEOC was higher than the Δ14C-SOC, indicating that WEOC could be primarily derived from the young, hydrophilic, and exchangeable fraction of SOC, rather than from SOC strongly bonded to mineral soils. However, the stream Δ14C-DOC was lower than Δ14C-WEOC in general, except during summer storms. The 14C-depleted DOC released from deep soils or groundwater might lower Δ14C-DOC of a stream, suggesting that relatively old DOC could be released into streams during baseflow. This is contrary to the results of previous studies that have reported positive stream Δ14C-DOC from temperate forests. The discrepancy warrants future research on forest stream Δ14C-DOC across entire seasons, particularly under Asian monsoon climates.
1. Introduction
Dissolved organic carbon (DOC) is an important component of many reactions and processes, such as, the transport of pollutants from soils to surface waters, heterotrophic respiration, and soil formation (Magee et al. Citation1991; Kalbitz et al. Citation2000; Lundstrom et al. Citation2000; Delle Site Citation2001). DOC can be derived from throughfall, litter leaching, root exudates, or decomposition of soil organic carbon (SOC) (Bolan et al. Citation2011). The soil DOC can be leached to groundwater or transported to streams (Kalbitz et al. Citation2000; Bolan et al. Citation2011), thereby potentially altering the regional or global carbon cycle (Raymond et al. Citation2013; Cory et al. Citation2015).
Many studies have investigated factors which can influence the leaching of DOC from soils. Tree species may influence soil DOC, as such higher concentration of DOC ([DOC]) was observed in soils beneath coniferous stands compared to broadleaf stands (Currie et al. Citation1996; Borken et al. Citation2011; Fröberg et al. Citation2011). The content of organic carbon (OC) in the forest floor was apparently higher in pine stands as compared to broadleaf stands (Cha et al. Citation2019), supporting that higher [DOC] could be observed in soils beneath coniferous forests. Precipitation and hydrologic regime also play important roles in the release of soil DOC because more DOC can be released by surface runoff during high-flow periods, such as, rainfall and snowmelt (Lambert et al. Citation2013; Raymond et al. Citation2016).
The studies on soil DOC have been conducted by directly sampling soil water using a lysimeter or by extracting soils with a solution in the laboratory (). Although the lysimeter can collect soil water in situ, it is difficult to obtain a sufficient amount of soil water for isotope analysis, and thus, extracted soil solution has been widely used to analyze carbon isotope ratios. Both the concentrations and characteristics of extracted DOC (i.e. water-extractable organic carbon: WEOC), are dependent on extracting conditions, including soil-to-water ratio, extracting time, and water temperature (Hagedorn et al. Citation2004; Jones and Willett Citation2006; Chantigny et al. Citation2014; Guigue et al. Citation2014). In general, a higher soil-to-water ratio, longer extraction time, and higher water temperature increased the concentration of WEOC ([WEOC]) (Jones and Willett Citation2006; Chantigny et al. Citation2014; Guigue et al. Citation2014).
Table 1. Carbon isotope analysis on SOC and soil DOC in forest ecosystems.
Dual carbon isotope analysis, especially radiocarbon (14C) analysis, is a powerful tool used to track the fates of organic carbon (Trumbore Citation2000; Raymond and Bauer Citation2001b; Trumbore Citation2009). The stable carbon isotope ratio (δ13C) provides information on whether the organic carbon has been derived from C3 plants or C4 plants, with about −28‰ and −12‰, respectively (Cerling et al. Citation1997; Kohn Citation2010; Marwick et al. Citation2015). Forests are mainly covered by trees which are mostly C3 plants, and thus δ13C alone cannot clearly distinguish the sources of organic carbon. In contrast, the radiocarbon isotope ratio (Δ14C) has a wide range (−1000‰ to ∼200‰) and provides information on when the organic carbon was photosynthesized (Trumbore et al. Citation1992; Marwick et al. Citation2015). The Δ14C-SOC and Δ14C-DOC in soil water or extracted solution decreases as soil depth increases ( and the references therein; Shi et al. Citation2020). Thus, varying sources of soil DOC and stram DOC depending on hydrological pathway can be investigated using dual carbon isotope analysis (Barnes et al. Citation2018). However, most of the previous studies using dual carbon isotope analysis have been conducted only for soils or streams, and there are few studies linking the SOC, soil DOC, and stream DOC.
Despite the merits of the dual carbon isotope analysis, to our knowledge, only approximately 10 studies have reported both Δ14C-SOC and Δ14C-DOC in forest ecosystems (). These studies reported that as soil depth increased both Δ14C-SOC and Δ14C-DOC decreased, and that Δ14C-SOC and Δ14C-DOC varied significantly depending on soil type, tree species, temperature, and precipiation ( and the references therein). However, compared to the other factors, the effect of tree species on Δ14C-SOC and Δ14C-DOC have been rarely studied, although tree species can affect concentrations and biogeochemical properties of OC in soil, soil water, and streams.
The objectives of this study are (1) to compare and contrast the amount and properties of WEOC of soils collected underneath two common tree species in the southern part of South Korea, Cryptomeria japonica and Quercus acutissima, under three different extraction conditions and (2) to compare dual carbon isotope ratios among SOC, soil DOC, and stream DOC in small forested watersheds. Despite of the limited number of samples, to our knowledge, this is the first attempt in the Republic of Korea to investigate the relationship among Δ14C-SOC, Δ14C-WEOC from soils, and stream Δ14C-DOC within a forested watershed, enabling a deeper understanding on the connectivity of organic carbon among soil, soil water, and streams in a temperate forest ecosystem.
2. Materials and methods
2.1. Site description
The study sites are located in the Bukmoongol (BM) and Baramgol (BR) forested watersheds, which are part of the Seoul National University Forest in the Baekwoon Mountain, Gwangyang, Jeollanam-do, South Korea (35.0319° N, 127.6050° E) (). The size of the BM watershed is 0.33 km2 and the mean depths of the O and A horizons are 5.9 and 24.1 cm, respectively (Im et al. Citation2007). The watershed area of BR is 0.15 km2 and the mean depths of the O and A horizons are 3.4 and 23.3 cm, respectively (Choi Citation2001). The soils of both watersheds are mainly composed of sandy loam, with relatively higher clay content in the BR watershed than BM watershed (Choi Citation2001, Korea Soil Information System: http://soil.rda.go.kr). The soils of both watersheds are categorized as moderately well-drained soils (Korea Soil Information System: http://soil.rda.go.kr). The ratios of stream discharge to precipitation were 50% and 36% for the BM and BR watersheds, respectively (Choi Citation2001). The bedrock consists of mostly granite and partially gneiss within the two watersheds (Park et al. Citation2000; Choi Citation2001). The slopes were 29.1% and 31.0% for the BM and BR watersheds, respectively (Choi Citation2001).
Figure 1. The location (red circle) and the boundary of the forested watersheds (red line) of this study. Soil samples were collected at orange triangle (Cryptomeria japonica stand) and circle (Quercus acutissima stand) points. The blue lines are streams. Stream samples were collected at green circles in the Bukmoongol (BM) and Baramgol (BR) watersheds.
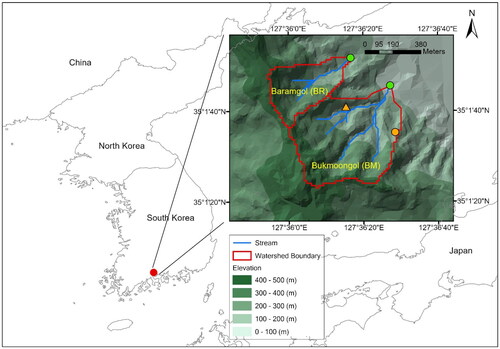
The BM and BR watersheds are fully covered by forest, and there was no wetland. Both sites were reforested since the 1920s, and the BM watershed consists of 70% and 30% of coniferous and deciduous trees, respectively, whereas that of the BR watershed consists of 95% and 5% of coniferous and deciduous trees, respectively (Choi Citation2001; Im et al. Citation2007). Stands of Cryptomeria japonica (Japanese cedar) and Quercus acutissima (sawtooth oak) in the watershed were planted in 1959 and 1926, respectively. Cryptomeria japonica is a main afforestation tree species in the southern part of South Korea and Quercus acutissima is widely distributed throughout South Korea (Lee et al. Citation2007; Kim et al. Citation2020). They were selected as a conifer and a broadleaf tree species in this study to investigate interactions between soil organic carbon and DOC in soil solution.
The region is under a temperate monsoon climate, which is characterized by large rainfall during summer. From 2009 to 2018, the annual precipitation at the watersheds ranged from 874 to 2162 mm, with a mean of 1509 mm yr−1, as measured at the weather station of the study sites. The mean precipitation during summer (from June to August) was 789 mm for the years from 2009 to 2018, accounting for approximately 50% of the annual precipitation. The mean daily temperature was around 23 °C in summer, while 4 °C in winter.
2.2. Laboratory experiments
2.2.1. Soil sampling
Soil samples were collected from mineral soil horizons beneath Cryptomeria japonica and Quercus acutissima stands at three different depths (0–10, 10–30, and 30–50 cm) from three pits for each species at the BM watershed on March 15, 2019 (). The O horizon was not sampled because organic carbon content varies depending on the season, and we focused on the mineral horizon where the OC content remained relatively stable. Soil sampling plots between two tree species are about 400 m apart (). There was no significant difference in mostly sandy soil texture beneath the two tree species. Collected soil samples were well mixed for each depth and sieved using a 5.6 mm screen to remove stones (Kalbitz et al. Citation2007). All samples were stored at 4 °C before extraction.
2.2.2. Soil solution extraction
The extraction methods were adapted from Jones and Willett (Citation2006) and Kalbitz et al. (Citation2007). Soil solution was extracted with deionized water (DI) to measure the concentration of DOC and major ions. In order to assess the effect of varying extraction conditions on the properties of WEOC, three different extraction conditions (EC) were applied as described below:
EC1: A soil-to-water ratio of 1:10 (20 g of soil mixed with 200 ml of DI) was used. The mixture was stirred using a glass rod for 1 minute. The method presents relatively high water content and short extraction time conditions.
EC2: A soil-to-water ratio of 1:10 (20 g of soil mixed with 200 ml of DI) was used. The mixture was stirred using a shaker for 18 hours. The method presents relatively high water content and long extraction time conditions.
EC3: A soil-to-water ratio of 1:3 (50g of soil mixed with 150 ml of DI) was used. The mixture was stirred using a shaker for 18 hours. The method presents relatively low water content and long extraction time conditions.
The soil extractants were filtered using a Macherey-Nagel glass fiber filter (pore size: 0.4 μm) which was pre-combusted at 400 °C for 4 hours. Three replicates were prepared for each sample. A total of 54 samples were utilized to analyze the concentrations of WEOC and major ions. Extractants of EC1 and EC2 were stored in polyethylene bottles, while those from EC3 were stored in glass bottles for dual carbon isotope analysis. Every sample was stored at 4 °C.
2.2.3. Stream water sampling
Stream water was collected at the pool next to the U-shaped weir in the BM watershed from May 2012 to April 2015 and in the BR watershed from May 2012 to April 2014 on a weekly basis, in order to compare the [DOC] between the two watersheds. The water sample was filtered using pre-combusted Whatman glass fiber filter (pore size: 0.7 μm). About 300 ml of filtered sample was stored in polyethylene bottle to measure [DOC] and the concentration of major cations (Na+, K+, Mg2+, and Ca2+), and the remaining was frozen in a polycarbonate bottle for dual carbon isotope analysis. The same volume of weekly stream samples at the BM watershed were composited into one sample for each season (spring: March–May, summer: June–August, fall: September–November, and winter: December–February) during January 2014–April 2015 to increase the volume of the samples, which were analyzed for Δ14C-DOC.
Stream water samples were also collected at 2–24 hours intervals during two storms with high amount and intensity of precipitation to understand the effect of soil DOC on stream DOC during summer storms. The first storm was a typical summer storm in 03–08 July 2013 (123 mm of precipitation) which was non-separable, two consecutive rain events, and the second was an unusual storm event during a typhoon hit in 02–09 August 2014 (240 mm of precipitation). The stream water samples that were collected when discharge reached the peaks in each storm event were used for Δ14C-DOC analysis (i.e. a total of three samples including two samples for the first storm and one sample for the second storm). In sum, a total of 9 stream water samples were analyzed for Δ14C-DOC: 2 in spring, 1 in summer, 3 in summer storms, 1 in fall, and 2 in winter.
2.2.4. Chemical properties
Concentration of WEOC ([WEOC]) or stream DOC ([DOC]) was measured using Shimadzu TOC-VCPH (Shimadzu Corporation, Japan). The concentration of major cations (Na+, K+, Mg2+, and Ca2+) was measured by ICS-1600 using Dionex CS12A column with 20 mM methanesulfonic acid eluent (Dionex, Sunnyvale, CA, USA). Soil organic carbon concentration ([SOC]) was determined using SSM-5000A (Shimadzu Corporation, Japan). The soils were air dried and ground using a Pulverisette 23 ball mill (Fritsch, Germany). Each soil sample was fumigated with concentrated HCl in a desiccator for 6 hours to remove inorganic carbon (Komada et al. Citation2008). The samples were then dried at 50 °C overnight and used to measure [SOC]. The following equation was used to calculate the ratio between WEOC and SOC (WEOC/SOC):
(1)
(1)
where, the [WEOC] is concentration of WEOC in mg-C L−1, the extraction ratio is the mass of soil divided by the volume of extractant, in g-soil L−1, and [SOC] is in g-C g-soil−1. Thus, the WEOC/SOC is the mass of WEOC which can be released from a unit mass of SOC.
2.2.5. Dual carbon isotope analysis
The dual carbon isotope analysis (δ13C and Δ14C) was conducted for the SOC, WEOC, and stream DOC. For SOC, each ground and acid-fumigated soil was sealed in a pre-baked quartz tube with a few strands of silver wire and CuO, and was oxidized at 850 °C in a furnace (Druffel et al. Citation1992).
The WEOC from EC3 for each soil depth was composited, which was the highest [WEOC] among ECs, and stream DOC for each season were composited. Only EC3 provided enough organic carbon to be analyzed for dual carbon isotope analysis. About 0.125 ml of 40% of H3PO4 solution was added to 100 ml of water sample and helium gas was purged to remove dissolved inorganic carbon. Then, the samples were oxidized with ultrapure O2 gas by a high-energy (2400 W) UV lamp for 4 hours to convert DOC to CO2 (Raymond and Bauer Citation2001a). The generated CO2 gas was cryogenically purified using liquid N2 in a vacuum line and was sealed in a pyrex tube.
The sealed quartz tubes and pyrex tubes were sent to the National Ocean Sciences Accelerator Mass Spectrometry (NOSAMS) facility at Woods Hole Oceanographic Institution in the United States for dual carbon isotope analysis (Lee et al. Citation2021). Carbonates (IAEA-603, IAEA-610, and USGS-44) and oxalic acid (IAEA-C8) were used as reference materials to calculate δ13C and Δ14C of the samples, respectively.
2.2.6. Statistical analysis
The concentrations of WEOC and major cations under different conditions (soil depth, ECs, and tree species) were compared using t-test, one-way analysis of variance, and Tukey’s test. The Mann-Whitney U test and Kruskal–Wallis test were used as non-parametric methods when the normality assumption was not satisfied. The statistical significance level was determined by p-value. A p-value less than 0.05 was considered as significant, 0.05 ≤ p-value < 0.10 as marginal, and 0.10 ≤ p-value as insignificant. The relationships between the stream [DOC] in the BM and BR watersheds and the Δ14C of SOC, WEOC, and stream DOC were analyzed using linear regression. We identified four outliers among the weekly collected samples in which stream [DOC] exceeded the threshold defined as “mean + 3 times the standard deviation (S.D.)” during the study period (Oh et al. Citation2013). These outliers were excluded from the linear regression analysis. Every statistical analysis was conducted using R 3.6.0. (R Core Team, Citation2019).
3. Results
3.1. Concentration of SOC and WEOC
The [SOC] decreased with increasing soil depth (p < 0.01; Table S1) and did not significantly vary between tree species at each soil depth (Table S1). The [SOC] were 2.6–4.4, 1.4–2.7, and 0.5–1.2% beneath Cryptomeria japonica, and 2.2–4.2, 1.4–2.7, and 0.5–1.0% beneath Quercus acutissima at 0–10, 10–30, and 30–50 cm, respectively.
A significantly higher [WEOC] was obtained from EC3 than EC1 (p < 0.01) (). The mean [WEOC] was about twice higher under Cryptomeria japonica (3.0 and 7.9 mg L−1 for EC2 and EC3, respectively) compared to Quercus acutissima (1.8 and 3.8 mg L−1 for EC2 and EC3, respectively) (, ). For the [WEOC], significant differences among soil depth were observed under both tree species (p < 0.05; ). The [WEOC] at 0–10 cm was significantly higher compared to 10–30 and 30–50 cm (p < 0.05).
Figure 2. The relationships between SOC concentration and [WEOC] by (a) EC1, (b) EC2, and (c) EC3. Black triangles and dashed line are for Cryptomeria japonica and red circles and dashed line are for Quercus acutissima. Dashed lines are linear regression lines.
![Figure 2. The relationships between SOC concentration and [WEOC] by (a) EC1, (b) EC2, and (c) EC3. Black triangles and dashed line are for Cryptomeria japonica and red circles and dashed line are for Quercus acutissima. Dashed lines are linear regression lines.](/cms/asset/40fa3719-48fa-42a0-8ecd-63b8ded94ce3/tfst_a_2265966_f0002_c.jpg)
Table 2. Arithmetic mean and SE (standard error of the mean, n = 3) of the [WEOC] and cations.
The WEOC to SOC ratio (WEOC/SOC in ) shows how much organic carbon in soils is dissolved into water on a unit mass basis. The WEOC/SOC ratio of soils collected beneath the two tree species from EC1 was lower than values obtained from EC2 and EC3 (p < 0.01 for Cryptomeria japonica, p = 0.02 for Quercus acutissima), probably due to insufficient water retention time to extract OC from soils using EC1 (). There was no significant difference in the WEOC/SOC ratio between EC2 and EC3. The mean WEOC/SOC ratio of soils at 0–50 cm, following EC1 was 0.3 mg−1 g−1 for both Cryptomeria japonica and Quercus acutissima, while 1.2 and 0.5 mg−1 g−1 were obtained for soils collected beneath Cryptomeria japonica and Quercus acutissima, respectively, following EC3. The WEOC/SOC ratio was not dependent on soil depth nor tree species in general ().
3.2. Concentrations of major cations
The concentration of the sum of cations ([sum of cations]) ranged between 59–107 µmolc L−1, 111–313 µmolc L−1, and 273–543 µmolc L−1, following EC1, EC2, and EC3, respectively, under Cryptomeria japonica and 43–77 µmolc L−1, 64–146 µmolc L−1, and 126–328 µmolc L−1, following EC1, EC2, and EC3, respectively, under Quercus acutissima (). A significantly larger amount of cations was extracted under Cryptomeria japonica as compared to Quercus acutissima (p < 0.01). The concentration of each cation increased with long water retention time and high soil to water ratio, such that a significantly higher concentration of cations was obtained for samples treated following EC3 than EC1 and EC2, regardless of the tree species (p < 0.01).
The [WEOC]/[sum of cations] ratios under Cryptomeria japonica at 0–50 cm were 0.2–1.0 mmol mmolc−1, 0.3–2.2 mmol mmolc−1, and 0.4–3.9 mmol mmolc−1, following EC1, EC2, and EC3, respectively (). For soils collected underneath Quercus acutissima, the [WEOC]/[sum of cations] ratio was not significantly different from Cryptomeria japonica. The [WEOC]/[sum of cations] decreased with increasing soil depth such that the ratio at 0–10 cm was about 2–4 times higher than at 10–30 and 30–50 cm, under both tree species (p < 0.01).
3.3. Dual carbon isotope ratios of WEOC and SOC
The δ13C-WEOC ranged from −27.1‰ to −23.3‰ and the δ13C-SOC ranged from −27.1‰ to −23.3‰ (Table S2). Both δ13C-WEOC and δ13C-SOC increased with increasing soil depth (; p < 0.01). The δ13C-WEOC and δ13C-SOC of soil sample collected beneath Cryptomeria japonica tend to be higher than that of Quercus acutissima at all soil depths. However, the difference in δ13C-WEOC or δ13C-SOC between the two tree species was marginal (p = 0.08 for δ13C-SOC; ).
Figure 3. The relationships between (a) δ13C-SOC and δ13C-WEOC and (b) Δ14C-SOC and Δ14C-WEOC. Black triangles are Cryptomeria japonica and red circles are Quercus acutissima. Dashed line is 1:1 line.
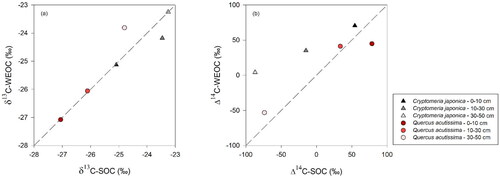
The Δ14C-WEOC was mostly modern under the two tree species, ranging from −53.3‰ to 70.5‰ (Table S2). Depleted Δ14C-WEOC was only observed at 30−50 cm soil under Quercus acutissima. The Δ14C-WEOC appeared to decrease with increasing soil depth under both tree species, but, the tendency was marginal for Cryptomeria japonica (p = 0.08) and not significant for Quercus acutissima (p = 0.26). There was no significant difference of Δ14C-WEOC between the two tree species.
The Δ14C-SOC of the soil sample collected beneath Cryptomeria japonica decreased with increasing soil depth (p = 0.05) whereas that beneath Quercus acutissima showed a similar pattern (p = 0.10; ). The Δ14C-SOC was up to 78.6‰ at 0−10 cm of soil depth, whereas the Δ14C-SOC decreased to −87.0‰ under Cryptomeria japonica and −73.7‰ under Quercus acutissima at 30−50 cm of soil depth (Table S2). The 14C-ages of SOC ranged from 665 yBP (years before present) to modern. No significant difference of Δ14C-SOC was observed between the two tree species although this could be due to the low number of analysis.
3.4. Stream water chemistry
Weekly collected stream [DOC] ranged from 0.1 to 2.3 mg L−1 (mean ± S.E.: 0.5 ± 0.0 mg L−1) for BM watershed, and from 0.2 to 3.8 mg L−1 (mean ± S.E.: 0.6 ± 0.0 mg L−1) for the BR watershed during May 2012–April 2014. Stream [DOC] increased to 2.6 mg L−1 in the BM watershed and 4.1 mg L−1 for the BR watershed during storm events in 2012. The [DOC] of the BR watershed was significantly higher than that of the BM watershed over the study period, including the storm events (; p < 0.01). The difference of [DOC] between the two watersheds was higher in storm samples than weekly collected samples (; slopes: 1.27 (storms) and 1.13 (weekly)). However, there were no significant differences in [sum of cations] between the two watersheds. Stream Δ14C-DOC in the BM watershed ranged from −68.1 to −18.3‰ for composited samples for each season during 2014–2015, which corresponds to 85–505 yBP with a mean of 290 yBP. A relatively high Δ14C-DOC, ranging from −6.2 to 45.5‰, was observed during summer storms ().
Figure 4. The relationships between stream [DOC] of the BM watershed ([DOC]BM) and stream [DOC] of the BR watershed ([DOC]BR). Black circles and red squares are weekly collected stream DOC and stream DOC during storm events, respectively. The four white circles are outliers of weekly collected samples (> mean + 3 S.D.) which were excluded in the linear regression. Black and red dashed lines are regression lines of weekly collected samples and storm samples, respectively. Gray solid line is 1:1 line.
![Figure 4. The relationships between stream [DOC] of the BM watershed ([DOC]BM) and stream [DOC] of the BR watershed ([DOC]BR). Black circles and red squares are weekly collected stream DOC and stream DOC during storm events, respectively. The four white circles are outliers of weekly collected samples (> mean + 3 S.D.) which were excluded in the linear regression. Black and red dashed lines are regression lines of weekly collected samples and storm samples, respectively. Gray solid line is 1:1 line.](/cms/asset/74fd9d03-b5d3-48ed-90cc-cc3c3ff230b2/tfst_a_2265966_f0004_c.jpg)
Figure 5. The relationships between the ratio of [DOC] to [sum of cations] and Δ14C-DOC of extracted soil solution (i.e. WEOC) under the two tree species and stream water. Black triangles are Cryptomeria japonica, and red circles are Quercus acutissima. Light to dark green symbols are stream water samples collected weekly and composited for each season, and during summer storms. Blue dashed line is the linear regression line for stream and extracted soil solution.
![Figure 5. The relationships between the ratio of [DOC] to [sum of cations] and Δ14C-DOC of extracted soil solution (i.e. WEOC) under the two tree species and stream water. Black triangles are Cryptomeria japonica, and red circles are Quercus acutissima. Light to dark green symbols are stream water samples collected weekly and composited for each season, and during summer storms. Blue dashed line is the linear regression line for stream and extracted soil solution.](/cms/asset/9fbe1044-4ec6-4f1f-9693-80fc07476d9d/tfst_a_2265966_f0005_c.jpg)
4. Discussion
4.1. [WEOC] of soils collected underneath Cryptomeria japonica and Quercus acutissima
Many studies have reported larger [DOC] in soil solution under coniferous forests than under deciduous forests, at least for top soils (Currie et al. Citation1996; Borken et al. Citation2011; Fröberg et al. Citation2011; Camino-Serrano et al. Citation2014; Thieme et al. Citation2019). For example, soil [DOC] under coniferous trees was 23% higher than those under broadleaved trees at 0–80 cm soil depth in 365 sites which are mainly located in Europe (Camino-Serrano et al. Citation2014). However, the observed difference in the [DOC] between conifers and deciduous stands cannot be solely due to the tree species, but also to variations in precipitation, temperature, and SOC concentration. In this study the Cryptomeria japonica and Quercus acutissima stands are approximately only 400 m apart (), thus the precipitation and temperature of the two sites are almost identical.
Soil organic carbon concentration can be dependent on tree species (Cha et al. Citation2019). Although a study including 595 forest sites in South Korea reported that at a mineral soil depth of 0–30 cm the [SOC] under deciduous trees was ∼30% higher than that under conifers (Cha et al. Citation2019), we have not observed a significant difference in [SOC] between the two tree species at all soil depths in this study (Table S1). Even though high [SOC] can increase [DOC] in soil solution, our results suggest that the quality, rather than the quantity, of SOC can be a controlling factor on the extracted [DOC].
Despite of similar [SOC], the [WEOC] of soils under Cryptomeria japonica was larger by approximately 50% and 100%, compared to Quercus acutissima under EC2 and EC3, respectively, and the difference was mainly observed for 0–10 cm depth soils ( and ). The WEOC/SOC of Cryptomeria japonica was about two times larger than that of Quercus acutissima under EC3 (). These suggest that the OC of soils under Cryptomeria japonica can be easily dissolved than soils under Quercus acutissima. Although the soils can contain OC formed even before the two species were planted and we do not know the distribution of tree species in the watersheds before 1920, at least SOC in surface soils is likely to be influenced by present tree species rather than tree species of the past, considering that SOC can accumulate quickly in young growing stands (Cha et al. Citation2019). Thus, if stream DOC is mainly derived from DOC in soil water with other conditions (e.g. distance between tree stands to the stream) being equal, soils under Cryptomeria japonica stands would have a higher potential to increase stream [DOC] than soils under Quercus acutissima.
The mean of weekly collected stream [DOC] in the BR watershed was 30% higher than that of the BM watershed from May 2012 to April 2014 (p = 0.01, ) and the difference in stream [DOC] between the two watersheds was amplified during the storm events (p = 0.02, ). Given that the proportion of conifers in the BR watershed is 95% compared to 70% in the BM watershed, this suggests that watersheds dominated by conifers might release higher [DOC] than watersheds with a higher proportion of broadleaf trees. Soil [DOC] in coniferous trees tended to be higher than those of deciduous trees (Camino-Serrano et al. Citation2014), and thus stream [DOC] within watersheds dominated by conifers could be higher than those by deciduous trees.
Forest stream [DOC] can be influenced by many factors such as wetland cover, slopes of the watersheds, hydrologic flow path, and proximity of tree species to streams. The BM and BR watersheds are entirely covered by forest and there is no wetland within the watersheds. The slopes are similar in the BM and BR watersheds. Although we did not investigate all the tree species within the watersheds and the proximity of them to the streams, the effects of watershed hydrology could be inferred from the results of WEOC and stream DOC. Results of the extraction experiments demonstrated that [WEOC] from Cryptomeria japonica was up to about twice of that from Quercus acutissima, for the shallowest 0–10 cm depth soils (). Stream [DOC] during storms are preferentially from surface flow (Hood et al. Citation2006; Jeong et al. Citation2012), and thus, the higher stream [DOC] in the BR watershed than the BM watershed during summer storms could be due to higher [WEOC] of the conifer-dominant BR than the BM (). The ratios of stream discharge to precipitation in the BM and BR were 50% and 36%, respectively. A longer residence time of water in the BR, compared to the BM, could contribute to higher stream [DOC] in the BR watershed. The observed difference of stream [DOC] between two watersheds may be attributed not only to variations in tree species but also to other factors, such as discharge and soil texture throughout the watershed (Choi Citation2001).
4.2. Dual carbon isotope ratios of WEOC and SOC
There were significant negative relationships between δ13C and Δ14C of both SOC and WEOC (p < 0.05; Figure S1). As soil depth increased, the δ13C-SOC and δ13C-WEOC increased while the Δ14C-SOC and Δ14C-WEOC decreased (Table S2). This could be explained by (1) microbial degradation, (2) contribution of roots to SOC, and/or (3) selective sorption and leaching of OC with increasing soil depth (Kaiser et al. Citation2001; Nakanishi et al. Citation2012; Ahrens et al. Citation2015; Paul et al. Citation2020).
The Increase of δ13C-SOC and δ13C-WEOC with soil depth (Table S2) could be explained if soil microbes preferentially use lighter carbon (12C) in SOC, resulting in depleted δ13C in respired CO2 and enriched δ13C in SOC (Wynn et al. Citation2006; Diochon and Kellman Citation2009). The δ13C of roots of C3 plants was ∼1.2‰ higher than δ13C of shoots on average in studies using a variety of C3 plants (Werth and Kuzyakov Citation2010), and the δ13C of roots of four tree species, including fir, pine, beech, and oak, was higher than δ13C of surface litters by 4.6‰ (Lorenz et al. Citation2020). This suggests that deep roots could also contribute to high δ13C-SOC as soil depth increases because of post-photosynthesis fractionation (Paul et al. Citation2020).
Preferential dissolution and sorption of OC in soils can also be a reason of δ13C-enrichment of SOC and WEOC with soil depth. The δ13C of the hydrophilic portion of soil DOC (HPIC), including carbohydrates and amino acids, can be higher than that of the hydrophobic portion of soil DOC (HPOC), including lignin, lipid, and cutin, by approximately 3–4‰ (Guggenberger et al. Citation1994; Kaiser et al. Citation2001; Nakanishi et al. Citation2012). The proportion of HPIC to WEOC can increase as soil depth increases in forest soils (Kaiser et al. Citation2001; Nakanishi et al. Citation2012). Thus, the higher δ13C-WEOC and δ13C-SOC in deeper soils could be explained by a higher proportion of HPIC which is leached and then deposited to the deeper soil horizons, in contrast to the preferentially adsorbed HPOC by soil minerals.
The decline of Δ14C-SOC and Δ14C-WEOC with increasing depth can be explained by the repeated decomposition of SOC as microbes turn OC into more preserved status after young OC enters from litters or roots to soils (Rumpel et al. Citation2002; Rumpel et al. Citation2004; Nakanishi et al. Citation2012; Ahrens et al. Citation2015). Soil minerals in subsurface horizons can bind SOC, preventing microbial access to SOC, which can result in low Δ14C-SOC and Δ14C-WEOC (Schmidt et al. Citation2011; Lehmann and Kleber Citation2015). Similar results have been reported regardless of the tree species, indicating that soil depth is a controlling factor on the Δ14C of SOC and soil DOC ( and ; Shi et al. Citation2020).
Figure 6. The relationships between Δ14C-SOC and Δ14C of soil DOC or soil WEOC. Data from nine previous studies are also included (). Blue triangles, purple circles, green diamonds, and gray stars are for conifers, deciduous trees, mixed forests, and other plants such as shrubs and grasses. Black triangles are for Cryptomeria japonica whereas red circles are for Quercus acutissima in this study. Gray and black dashed lines are linear regression line and 1:1 line, respectively.
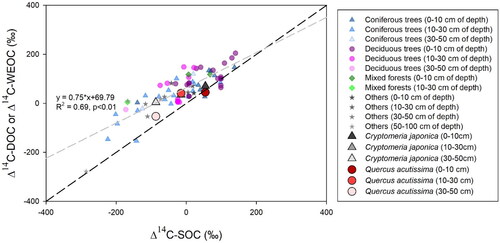
δ13C-WEOC can be higher than δ13C-SOC because of preferential dissolution of lighter carbon in SOC (Nakanishi et al. Citation2012). However, the δ13C-WEOC was similar with δ13C-SOC in this study (Table S2), suggesting that dominant source of both SOC and WEOC are C3 plants. In contrast, the Δ14C-WEOC was higher than Δ14C-SOC in general (), which agrees with the other studies (), demonstrating that the relatively young SOC was preferentially extracted by water. Or this could be because hydrophilic young OC in subsurface horizons, which had been transferred from the surface by water and deposited, are re-dissolved during extraction (Kaiser and Kalbitz Citation2012). The difference between Δ14C-WEOC and Δ14C-SOC was larger for soils collected under Cryptomeria japonica compared to Quercus acutissima ( and Table S2), suggesting that more young OC could be released as DOC from soils under Cryptomeria japonica.
Although the effects of tree species on either Δ14C-SOC or Δ14C-DOC were not significant in this study (black triangles and red circles in ), when the results of other studies were combined (, , and the references therein), both the Δ14C-SOC and Δ14C-DOC of soils under deciduous trees were slightly higher compared to soils beneath conifers (; p < 0.07 for SOC and p < 0.05 for DOC). This suggests that tree species has a weak potential to influence the Δ14C-SOC and Δ14C-DOC whereas soil depth can be a strong factor on the Δ14C-SOC and Δ14C-DOC. However, site history, soils properties, climates, or hydrological characteristics can be different each other (, ; Camino-Serrano et al. Citation2014; Nguyen and Marschner Citation2016; van der Voort et al. Citation2019; Shi et al. Citation2020), and thus caution is needed to draw a conclusion with a limited number of samples.
4.3. Linkage between soil DOC and stream DOC
The stream Δ14C-DOC in this study ranging from −68.1 to 45.5‰ (), was significantly lower than that of other forest streams, where contributions of the OC inputs from surface litters or shallow soils were relatively larger (Schiff et al. Citation1997; Longworth et al. Citation2007; Lu et al. Citation2014). A positive log-linear relationship between [DOC]/[sum of cations] and Δ14C-WEOC was observed (). A similar relationship was also observed between [DOC]/[Na+] and Δ14C-WEOC, where [Na+] was used as a proxy of weathering products (Figure S2). This agrees with the results reported by Barnes et al. (Citation2018) which suggest that aged DOC could be released from deep soils where the concentrations of weathering products (i.e. major cations) were higher than those of surface soils.
Despite Δ14C of WEOC was mostly positive (Table S2), the stream Δ14C-DOC of the BM watershed () corresponded to 14C-age dating up to 505 ± 15 yBP during baseflow, suggesting that contribution from mineral soil horizons or possibly groundwater to the stream [DOC] could be relatively large. The 14C-age of SOC at a soil depth of 30–50 cm was more than 500 yBP (Table S2), which also suggested leaching of old SOC during baseflow with long water residence time. In contrast, positive stream Δ14C-DOC was observed during summer storms () which indicated that contribution of fresh OC from litters or surface soils to stream DOC could increase with a rise in precipitation (Yang et al. Citation2015; Denis et al. Citation2017; Hernes et al. Citation2017).
In temperate forests, the inferred mean Δ14C-SOC from global radiocarbon profile data was −9‰ at a soil depth of 0–30 cm and −229‰ at soil depth of 30–100 cm (Shi et al. Citation2020). Groundwater is reported to have low Δ14C-DOC, down to −400‰ (Trumbore et al. Citation1992), because DOC can be leached from aged OM in deep soils or because 14C-enriched OC can be preferentially decomposed or sorbed while water percolates down to deep soils. This suggests that more 14C-depleted DOC can be released from temperate forests when baseflow is the dominant hydrological pathway, although many studies have reported positive Δ14C-DOC from temperate forest streams (Longworth et al. Citation2007; Lu et al. Citation2014).
5. Conclusions
We investigated the concentrations and properties of SOC and WEOC from soils collected under two different tree species stands, Cryptomeria japonica and Quercus acutissima, and compared these with the properties of stream DOC. There was no difference between [SOC] in soils collected under the two tree species, but [WEOC] tends to be higher under Cryptomeria japonica compared to Quercus acutissima, suggesting that more stream DOC could be released from the forested watershed with Cryptomeria japonica if other conditions are equal.
Neither Δ14C-WEOC nor Δ14C-SOC were significantly different under the two tree species in this study. However, the insignificant difference in Δ14C-WEOC or Δ14C-SOC in the two tree species can be due to a limited number of radiocarbon analysis. When the results of other studies were combined, the Δ14C-DOC and Δ14C-SOC under deciduous trees were slightly higher than under conifers, suggesting that tree species may not be a strong factor controlling the bulk 14C-ages of soil DOC and SOC. Instead, soil depth was a controlling factor on the Δ14C-SOC and Δ14C-WEOC whose corresponding 14C ages were up to 665 and 375 yBP, respectively, at 30–50 cm depth, in contrast to modern carbon was observed in both SOC and WEOC at 0–10 cm depth. The 14C-age of the forest stream was up to 505 yBP, highlighting the contribution of old OC from deep soils or possibly groundwater to streams during baseflow, although many studies have reported release of mostly modern DOC from temperate forest streams.
Supplemental Material
Download MS Word (450.6 KB)Acknowledgements
We thank the staff at Seoul National University Forest for weekly stream water sampling. We also thank Minjung Go for help with sampling, laboratory analyses, and discussion. This research was supported by Basic Science Research Program through the National Research Foundation of Korea (NRF) funded by the Ministry of Education (NRF-2016R1D1A1B03930149), and by NRF grant funded by the Korea government (MSIT) (No. 2021R1A2C1006783 and NRF-2021R1A4A1025553).
Disclosure statement
No potential conflict of interest was reported by the author(s).
Additional information
Funding
References
- Ahrens B, Braakhekke MC, Guggenberger G, Schrumpf M, Reichstein M. 2015. Contribution of sorption, DOC transport and microbial interactions to the 14C age of a soil organic carbon profile: insights from a calibrated process model. Soil Biol Biochem. 88:390–402. doi: 10.1016/j.soilbio.2015.06.008.
- Barnes RT, Butman DE, Wilson HF, Raymond PA. 2018. Riverine export of aged carbon driven by flow path depth and residence time. Environ Sci Technol. 52(3):1028–1035. doi: 10.1021/acs.est.7b04717.
- Bolan NS, Adriano DC, Kunhikrishnan A, James T, McDowell R, Senesi N. 2011. Dissolved organic matter: biogeochemistry, dynamics, and environmental significance in soils. In D. L. Sparks, editor. Advances in agronomy. Vol. 110. San Diego: Elsevier Academic Press Inc, p. 1–75.
- Borken W, Ahrens B, Schulz C, Zimmermann L. 2011. Site-to-site variability and temporal trends of DOC concentrations and fluxes in temperate forest soils. Global Change Biology. 17(7):2428–2443. doi: 10.1111/j.1365-2486.2011.02390.x.
- Camino-Serrano M, Gielen B, Luyssaert S, Ciais P, Vicca S, Guenet B, Vos BD, Cools N, Ahrens B, Altaf Arain M, et al. 2014. Linking variability in soil solution dissolved organic carbon to climate, soil type, and vegetation type. Global Biogeochem Cycles. 28(5):497–509. doi: 10.1002/2013GB004726.
- Cerling TE, Harris JM, MacFadden BJ, Leakey MG, Quade J, Eisenmann V, Ehleringer JR. 1997. Global vegetation change through the miocene/pliocene boundary. Nature. 389(6647):153–158. doi: 10.1038/38229.
- Cha JY, Cha Y, Oh NH. 2019. The effects of tree species on soil organic carbon content in South Korea. JGR Biogeosciences. 124(3):708–716. doi: 10.1029/2018JG004808.
- Chantigny MH, Harrison-Kirk T, Curtin D, Beare M. 2014. Temperature and duration of extraction affect the biochemical composition of soil water-extractable organic matter. Soil Biology and Biochemistry. 75:161–166. doi: 10.1016/j.soilbio.2014.04.011.
- Choi H. 2001. Developing a rainfall-runoff model for forest watersheds using distributed hydrological concept of TOPMODEL. Ph.D. dissertation. South Korea: Seoul National University. p. 1–199.
- Cory RM, Harrold KH, Neilson BT, Kling GW. 2015. Controls on dissolved organic matter (DOM) degradation in a headwater stream: the influence of photochemical and hydrological conditions in determining light-limitation or substrate-limitation of photo-degradation. Biogeosciences. 12(22):6669–6685. doi: 10.5194/bg-12-6669-2015.
- Currie WS, Aber JD, McDowell WH, Boone RD, Magill AH. 1996. Vertical transport of dissolved organic C and N under long-term N amendments in pine and hardwood forests. Biogeochemistry. 35(3):471–505. doi: 10.1007/BF02183037.
- Delle Site A. 2001. Factors affecting sorption of organic compounds in natural sorbent/water systems and sorption coefficients for selected pollutants. A review. J Phys Chem Ref Data. 30(1):187–439. doi: 10.1063/1.1347984.
- Denis M, Jeanneau L, Petitjean P, Murzeau A, Liotaud M, Yonnet L, Gruau G. 2017. New molecular evidence for surface and sub-surface soil erosion controls on the composition of stream DOM during storm events. Biogeosciences. 14(22):5039–5051. doi: 10.5194/bg-14-5039-2017.
- Diochon AC, Kellman L. 2009. Physical fractionation of soil organic matter: destabilization of deep soil carbon following harvesting of a temperate coniferous forest. J Geophys Res. 114(G1):G01016. doi: 10.1029/2008JG000844.
- Druffel ER, Williams PM, Bauer JE, Ertel JR. 1992. Cycling of dissolved and particulate organic matter in the open ocean. J Geophys Res. 97(C10):15639–15659. doi: 10.1029/92JC01511.
- Dutta K, Schuur EAG, Neff JC, Zimov SA. 2006. Potential carbon release from permafrost soils of Northeastern Siberia. Glob Change Biol. 12(12):2336–2351. doi: 10.1111/j.1365-2486.2006.01259.x.
- Fröberg M, Hanson PJ, Trumbore SE, Swanston CW, Todd DE. 2009. Flux of carbon from 14C-enriched leaf litter throughout a forest soil mesocosm. Geoderma. 149(3-4):181–188. doi: 10.1016/j.geoderma.2008.11.029.
- Fröberg M, Jardine PM, Hanson PJ, Swanston CW, Todd DE, Tarver JR, Garten CT. 2007. Low dissolved organic carbon input from fresh litter to deep mineral soils. Soil Sci Soc Am J. 71(2):347–354. doi: 10.2136/sssaj2006.0188.
- Fröberg M, Hansson K, Kleja DB, Alavi G. 2011. Dissolved organic carbon and nitrogen leaching from Scots pine, Norway spruce and silver birch stands in southern Sweden. For Ecol Manag. 262(9):1742–1747. doi: 10.1016/j.foreco.2011.07.033.
- Guggenberger G, Zech W, Schulten H-R. 1994. Formation and mobilization pathways of dissolved organic matter: evidence from chemical structural studies of organic matter fractions in acid forest floor solutions. Org Geochem. 21(1):51–66. doi: 10.1016/0146-6380(94)90087-6.
- Guigue J, Mathieu O, Lévêque J, Mounier S, Laffont R, Maron PA, Navarro N, Chateau C, Amiotte-Suchet P, Lucas Y. 2014. A comparison of extraction procedures for water-extractable organic matter in soils. Eur J Soil Sci. 65(4):520–530. doi: 10.1111/ejss.12156.
- Hagedorn F, Saurer M, Blaser P. 2004. A 13C tracer study to identify the origin of dissolved organic carbon in forested mineral soils. Eur J Soil Sci. 55(1):91–100. doi: 10.1046/j.1365-2389.2003.00578.x.
- Hensgens G, Laudon H, Johnson MS, Berggren M. 2021. The undetected loss of aged carbon from boreal mineral soils. Sci Rep. 11(1):6202. doi: 10.1038/s41598-021-85506-w.
- Hernes PJ, Spencer RGM, Dyda RY, O'Geen AT, Dahlgren RA. 2017. The genesis and exodus of vascular plant DOM from an Oak Woodland landscape. Front Earth Sci. 5:9. doi: 10.3389/feart.2017.00009.
- Hood E, Gooseff MN, Johnson SL. 2006. Changes in the character of stream water dissolved organic carbon during flushing in three small watersheds, Oregon. J Geophys Res. 111(G1):G01007. doi: 10.1029/2005JG000082.
- Im SJ, Lee SH, Lee HG, Ahn SJ. 2007. Prediction of runoff on a small forest watershed using BROOK90 model. Korean J Limnol. 40:155–162.
- Jones D, Willett V. 2006. Experimental evaluation of methods to quantify dissolved organic nitrogen (DON) and dissolved organic carbon (DOC) in soil. Soil Biol Biochem. 38(5):991–999. doi: 10.1016/j.soilbio.2005.08.012.
- Jeong J-J, Bartsch S, Fleckenstein JH, Matzner E, Tenhunen JD, Lee SD, Park SK, Park J-H. 2012. Differential storm responses of dissolved and particulate organic carbon in a mountainous headwater stream, investigated by high-frequency, in situ optical measurements. J Geophys Res. 117(G3):3013. doi: 10.1029/2012JG001999.
- Kaiser K, Guggenberger G, Zech W. 2001. Isotopic fractionation of dissolved organic carbon in shallow forest soils as affected by sorption. Eur J Soil Sci. 52(4):585–597. doi: 10.1046/j.1365-2389.2001.00407.x.
- Kaiser K, Kalbitz K. 2012. Cycling downwards – dissolved organic matter in soils. Soil Biol Biochem. 52:29–32. doi: 10.1016/j.soilbio.2012.04.002.
- Kalbitz K, Angers D, Kaiser K, Chantigny M. 2007. Extraction and characterization of dissolved organic matter. In: Carter MR, Gregorich EG, editors. Soil sampling and methods of analysis. 2nd ed. Boca Raton: CRC Press.
- Kalbitz K, Solinger S, Park JH, Michalzik B, Matzner E. 2000. Controls on the dynamics of dissolved organic matter in soils: a review. Soil Sci. 165(4):277–304. doi: 10.1097/00010694-200004000-00001.
- Karltun E, Harrison A, Alriksson A, Bryant C, Garnett M, Olsson M. 2005. Old organic carbon in soil solution DOC after afforestation – Evidence from 14C analysis. Geoderma. 127(3–4):188–195. doi: 10.1016/j.geoderma.2004.12.008.
- Kim C, Baek G, Choi B, Ha J, Bae Eun J, Lee K-S, Son Yeong M. 2020. Carbon stocks of tree, forest floor, and mineral soil in Cryptomeria japonica and Chamaecyparis obtusa stands. J Korean Soc Forest Sci. 109:169–178. in Korean with English abstract)
- Kohn MJ. 2010. Carbon isotope compositions of terrestrial C3 plants as indicators of (paleo)ecology and (paleo)climate. Proc Natl Acad Sci USA. 107(46):19691–19695. doi: 10.1073/pnas.1004933107.
- Komada T, Anderson MR, Dorfmeier CL. 2008. Carbonate removal from coastal sediments for the determination of organic carbon and its isotopic signatures, δ13C and Δ14C: comparison of fumigation and direct acidification by hydrochloric acid. Limnol Oceanogr Methods. 6(6):254–262. doi: 10.4319/lom.2008.6.254.
- Lambert T, Pierson-Wickmann A-C, Gruau G, Jaffrezic A, Petitjean P, Thibault J-N, Jeanneau L. 2013. Hydrologically driven seasonal changes in the sources and production mechanisms of dissolved organic carbon in a small lowland catchment. Water Resour Res. 49(9):5792–5803. doi: 10.1002/wrcr.20466.
- Lee E-J, Shin Y, Yoo G-Y, Ko E-B, Butman D, Raymond PA, Oh N-H. 2021. Loads and ages of carbon from the five largest rivers in South Korea under Asian monsoon climates. J Hydrol. 599:126363. doi: 10.1016/j.jhydrol.2021.126363.
- Lee S-W, Won H-K, Shin M-Y, Son Y-M, Lee Y-Y. 2007. Estimation of forest productive area of Quercus acutissima and Quercus mongolica using site environmental variables. KJSSF. 40:429–434.
- Lehmann J, Kleber M. 2015. The contentious nature of soil organic matter. Nature. 528(7580):60–68. doi: 10.1038/nature16069.
- Longworth BE, Petsch ST, Raymond PA, Bauer JE. 2007. Linking lithology and land use to sources of dissolved and particulate organic matter in headwaters of a temperate, passive-margin river system. Geochimica et Cosmochimica Acta. 71(17):4233–4250. doi: 10.1016/j.gca.2007.06.056.
- Lorenz M, Derrien D, Zeller B, Udelhoven T, Werner W, Thiele-Bruhn S. 2020. The linkage of 13C and 15N soil depth gradients with C: n and O: c stoichiometry reveals tree species effects on organic matter turnover in soil. Biogeochemistry. 151(2–3):203–220. doi: 10.1007/s10533-020-00721-3.
- Lu Y, Bauer J, Canuel E, Chambers RM, Yamashita Y, Jaffé R, Barrett A. 2014. Effects of land use on sources and ages of inorganic and organic carbon in temperate headwater streams. Biogeochemistry. 119(1–3):275–292. doi: 10.1007/s10533-014-9965-2.
- Lundstrom US, van Breemen N, Bain D. 2000. The podzolization process. A review. Geoderma. 94(2–4):91–107. doi: 10.1016/S0016-7061(99)00036-1.
- Magee BR, Lion LW, Lemley AT. 1991. Transport of dissolved organic macromolecules and their effect on the transport of phenanthrene in porous-media. Environ Sci Technol. 25(2):323–331. doi: 10.1021/es00014a017.
- Marwick TR, Tamooh F, Teodoru CR, Borges AV, Darchambeau F, Bouillon S. 2015. The age of river-transported carbon: a global perspective. Global Biogeochem Cycles. 29(2):122–137. doi: 10.1002/2014GB004911.
- Michalzik B, Tipping E, Mulder J, Lancho JFG, Matzner E, Bryant CL, Clarke N, Lofts S, Esteban MAV. 2003. Modelling the production and transport of dissolved organic carbon in forest soils. Biogeochemistry. 66(3):241–264. doi: 10.1023/B:BIOG.0000005329.68861.27.
- Nakanishi T, Atarashi-Andoh M, Koarashi J, Saito-Kokubu Y, Hirai K. 2012. Carbon isotopes of water-extractable organic carbon in a depth profile of forest soil imply a dynamic relationship with soil carbon. Eur J Soil Sci. 63(4):495–500. doi: 10.1111/j.1365-2389.2012.01465.x.
- Nakanishi T, Atarashi-Andoh M, Koarashi J, Saito-Kokubu Y, Hirai K. 2014. Seasonal and snowmelt-driven changes in the water-extractable organic carbon dynamics in a cool-temperate Japanese forest soil, estimated using the bomb-14C tracer. J Environ Radioact. 128:27–32. doi: 10.1016/j.jenvrad.2013.10.028.
- Nguyen TT, Marschner P. 2016. Sorption of water-extractable organic carbon in various clay subsoils: effects of soil properties. Pedosphere. 26(1):55–61. doi: 10.1016/S1002-0160(15)60022-4.
- Oh N-H, Pellerin BA, Bachand PAM, Hernes PJ, Bachand SM, Ohara N, Kavvas ML, Bergamaschi BA, Horwath WR. 2013. The role of irrigation runoff and winter rainfall on dissolved organic carbon loads in an agricultural watershed. Agric Ecosyst Environ. 179:1–10. doi: 10.1016/j.agee.2013.07.004.
- Park JH, Woo BY, Kim OR, Ahn HC, Kim JS. 2000. The effects of timber harvesting on soil chemical ingredients and stream water quality. J Ecol Environ. 23:9–15.
- Paul A, Balesdent J, Hatté C. 2020. 13C-14C relations reveal that soil 13C-depth gradient is linked to historical changes in vegetation 13C. Plant Soil. 447(1–2):305–317. doi: 10.1007/s11104-019-04384-4.
- R Core Team. 2019. R: A language and environment for statistical computing. (v.3.6.0) [Computer software]. R Foundation for Statistical Computing.
- Raymond PA, Bauer JE. 2001a. DOC cycling in a temperate estuary: a mass balance approach using natural 14C and 13C isotopes. Limnol Oceanogr. 46(3):655–667. doi: 10.4319/lo.2001.46.3.0655.
- Raymond PA, Bauer JE. 2001b. Use of 14C and 13C natural abundances for evaluating riverine, estuarine, and coastal DOC and POC sources and cycling: a review and synthesis. Org Geochem. 32(4):469–485. doi: 10.1016/S0146-6380(00)00190-X.
- Raymond PA, Hartmann J, Lauerwald R, Sobek S, McDonald C, Hoover M, Butman D, Striegl R, Mayorga E, Humborg C, et al. 2013. Global carbon dioxide emissions from inland waters. Nature. 503(7476):355–359. doi: 10.1038/nature12760.
- Raymond PA, Saiers JE, Sobczak WV. 2016. Hydrological and biogeochemical controls on watershed dissolved organic matter transport: pulse-shunt concept. Ecology. 97(1):5–16. doi: 10.1890/14-1684.1.
- Rumpel C, Eusterhues K, Kögel-Knabner I. 2004. Location and chemical composition of stabilized organic carbon in topsoil and subsoil horizons of two acid forest soils. Soil Biol Biochem. 36(1):177–190. doi: 10.1016/j.soilbio.2003.09.005.
- Rumpel C, Kögel-Knabner I, Bruhn F. 2002. Vertical distribution, age, and chemical composition of organic carbon in two forest soils of different pedogenesis. Org Geochem. 33(10):1131–1142. doi: 10.1016/S0146-6380(02)00088-8.
- Sanderman J, Baldock JA, Amundson R. 2008. Dissolved organic carbon chemistry and dynamics in contrasting forest and grassland soils. Biogeochemistry. 89(2):181–198. doi: 10.1007/s10533-008-9211-x.
- Shi Z, Allison SD, He Y, Levine PA, Hoyt AM, Beem-Miller J, Zhu Q, Wieder WR, Trumbore S, Randerson JT. 2020. The age distribution of global soil carbon inferred from radiocarbon measurements. Nat Geosci. 13(8):555–559. doi: 10.1038/s41561-020-0596-z.
- Schiff SL, Aravena R, Trumbore SE, Hinton MJ, Elgood R, Dillon PJ. 1997. Export of DOC from forested catchments on the precambrian shield of central ontario: clues from 13C and 14C. Biogeochemistry. 36(1):43–65. doi: 10.1023/A:1005744131385.
- Schmidt MWI, Torn MS, Abiven S, Dittmar T, Guggenberger G, Janssens IA, Kleber M, Kögel-Knabner I, Lehmann J, Manning DAC, et al. 2011. Persistence of soil organic matter as an ecosystem property. Nature. 478(7367):49–56. doi: 10.1038/nature10386.
- Tegen I, Dörr H. 1996. measurements of soil organic matter, soil CO2 and dissolved organic carbon (1987–1992). Radiocarbon. 38(2):247–251. doi: 10.1017/S0033822200017628.
- Thieme L, Graeber D, Hofmann D, Bischoff S, Schwarz M, Steffen B, Meyer U-N, Kaupenjohann M, Wilcke W, Michalzik B, et al. 2019. Dissolved organic matter characteristics of deciduous and coniferous forests with variable management: different at the source, aligned in the soil. Biogeosciences. 16(7):1411–1432. doi: 10.5194/bg-16-1411-2019.
- Trumbore S. 2000. Age of soil organic matter and soil respiration: radiocarbon constraints on belowground C dynamics. Ecol Appl. 10(2):399–411. doi: 10.1890/1051-0761(2000)010[0399:AOSOMA.2.0.CO;2]
- Trumbore S. 2009. Radiocarbon and soil carbon dynamics. Annu Rev Earth Planet Sci. 37(1):47–66. doi: 10.1146/annurev.earth.36.031207.124300.
- Trumbore SE, Schiff SL, Aravena R, Elgood R. 1992. Sources and transformation of dissolved organic carbon in the Harp Lake forested catchment: the role of soils. Radiocarbon. 34(3):626–635. doi: 10.1017/S0033822200063918.
- van der Voort TS, Mannu U, Hagedorn F, McIntyre C, Walthert L, Schleppi P, Haghipour N, Eglinton TI. 2019. Dynamics of deep soil carbon – insights from 14C time series across a climatic gradient. Biogeosciences. 16(16):3233–3246. doi: 10.5194/bg-16-3233-2019.
- Werth M, Kuzyakov Y. 2010. 13C fractionation at the root–microorganisms–soil interface: a review and outlook for partitioning studies. Soil Biol Biochem. 42(9):1372–1384. doi: 10.1016/j.soilbio.2010.04.009.
- Wynn JG, Harden JW, Fries TL. 2006. Stable carbon isotope depth profiles and soil organic carbon dynamics in the lower Mississippi Basin. Geoderma. 131(1-2):89–109. doi: 10.1016/j.geoderma.2005.03.005.
- Yang L, Chang S-W, Shin H-S, Hur J. 2015. Tracking the evolution of stream DOM source during storm events using end member mixing analysis based on DOM quality. J Hydrol. 523:333–341. doi: 10.1016/j.jhydrol.2015.01.074.