
ABSTRACT
S-adenosyl-homocysteine-hydrolase (AHCY) plays an important role in the methionine cycle regulating cellular methylation levels. AHCY has been reported to influence proliferation and differentiation processes in different cell types, e.g. in cancer cells and mouse embryonic stem cells. In the development of adipose tissue, both the proliferation and differentiation of adipocyte progenitor cells (APCs) are important processes, which in the context of obesity are often dysregulated. To assess whether AHCY might also be involved in cell proliferation and differentiation of APCs, we investigated the effect of reduced AHCY activity on human and mouse APCs in vitro. We show that the inhibition of AHCY using adenosine dialdehyde (AdOx) and the knockdown of AHCY using gene-specific siRNAs reduced APC proliferation and number. Inhibition of AHCY further reduced APC differentiation into mature adipocytes and the expression of adipogenic differentiation markers. Global DNA methylation profiling in human APCs revealed that inhibition of AHCY is associated with alterations in CpG methylation levels of genes involved in fat cell differentiation and pathways related to cellular growth. Our findings suggest that AHCY is necessary for the maintenance of APC proliferation and differentiation and inhibition of AHCY alters DNA methylation processes leading to a dysregulation of the expression of genes involved in the regulation of these processes.
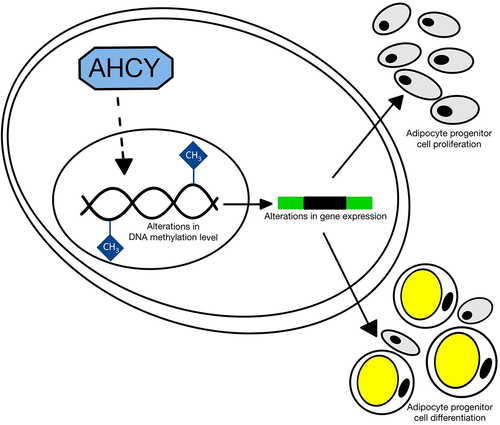
GRAPHICAL ABSTRACT
Introduction
The S-adenosyl-homocysteine-hydrolase (AHCY) is a highly conserved and ubiquitously expressed enzyme involved in the methionine cycle [Citation1,Citation2]. It catalyzes the hydrolysis of s-adenosyl-homocysteine (SAH) to adenosine and homocysteine and thereby eliminates a strong inhibitor of methyltransferases and cellular methylation processes [Citation3,Citation4]. In recent years, AHCY has become of increasing interest as a potential drug target in cancer research due to its role in processes related to cellular growth [Citation5,Citation6]. It has been reported that the depletion of AHCY has an inhibitory effect on the proliferation and mobility of breast cancer cells by interfering with the mitogen-activated protein (MEK)/extracellular signal-regulated kinase (ERK) pathway and causing cell cycle arrest [Citation7]. Similarly, inhibition of AHCY in hepatic carcinoma cells in vitro resulted in DNA damage and attenuation of cell proliferation [Citation5]. Furthermore, AHCY has been shown to be critical for the pluripotency of mouse embryonic stem cells by interfering with both proliferation and differentiation processes [Citation8].
In addition to cancer formation and growth, the development of several other diseases, as for example obesity, is also characterized by alterations in proliferation and differentiation processes [Citation9,Citation10]. Interestingly, genomic methylation changes due to knockdown or overexpression of AHCY in HeLa cells are associated with the up or downregulation of genes involved in metabolic pathways, such as the peroxisome proliferator-activated receptor (PPAR) pathway [Citation11], which includes PPARG, the master regulator of adipocyte differentiation [Citation12]. One recent study also suggested that a long non-coding RNA, presumably involved in the modulation of AHCY, alters cellular methylation patterns and affects regulation of adipogenesis in porcine preadipocytes [Citation13].
Furthermore, AHCY has indirectly been linked to adipogenesis by for example showing that alterations in SAH and s-adenosylmethionine (SAM) levels affect adipocyte lipolysis and the expression of adipocyte differentiation factors such as PPARG and CCAAT/enhancer-binding protein alpha (CEBPA) in murine cells [Citation14,Citation15]. Additionally, it has been reported that elevated levels of SAH alter basic metabolic processes in adipocytes, such as glucose uptake and lipolysis and that these findings are paralleled by changes in methylation [Citation16]. In contrast to this, we have recently shown that the overexpression of AHCY does not influence PPARG expression and differentiation of Simpson-Golabi-Behmel Syndrome (SGBS) preadipocytes [Citation17].
Independent of AHCY function, a link between adipogenesis and DNA and/or histone methylation of adipocyte progenitor cells (APCs) has been proposed by several previous studies [Citation18]. For example, one recent study demonstrated that different stages of human APC differentiation are characterized by specific alterations in genomic DNA methylation patterns [Citation19]. However, the mechanistic basis for this is not completely understood.
In conclusion, although there is evidence for a potential role of AHCY in pathogenic processes related to the development of obesity, this has not been sufficiently addressed in adipose tissue. Based on the existing results, it is tempting to speculate that there may be a link between the activity of AHCY, changes in cellular methylation and processes related to adipogenesis, such as proliferation and differentiation of APCs. Therefore, the aim of this study was to analyse the effect of direct inhibition of AHCY on APC proliferation and differentiation using adenosine dialdehyde (AdOx), a potent inhibitor of AHCY [Citation20,Citation21].
Results
AHCY inhibition impedes proliferation of adipocyte progenitor cells (APCs)
In our approach to investigate the relevance of AHCY for APC function, we first examined the effect of a reduced activity and expression of AHCY on proliferation and viability of SGBS preadipocytes, which are an established and commonly used model to study APC function in vitro [Citation22]. SGBS cells are derived from a patient with clinical signs of Simpson-Golabi-Behmel-Syndrome (SGBS), a rare genetic disorder associated with prenatal and postnatal overgrowth [Citation22]. However, the underlying genetic defect has not been identified so far. In vitro, SGBS cells are known to have an increased and prolonged capacity, for more than 50 population doublings, to proliferate and differentiate into mature adipocytes compared to primary APCs [Citation22,Citation23]. We inhibited AHCY by treating the cells with AdOx and by downregulating AHCY expression using gene-specific small interfering (si)RNAs. The inhibitory effect of AdOx and AHCY knockdown on the activity of AHCY in SGBS cells was confirmed by an enzyme activity assay, while reduced expression of AHCY after siRNA mediated knockdown was confirmed by quantitative real-time polymerase chain reaction (q-PCR) (). The effect on cellular proliferation and viability was then assessed by three independent methods: by counting of cell nuclei after staining with Hoechst dye and doubling time calculation, by water soluble tetrazolium (WST)-1 assay measurements and by gene expression measurements. Counting of Hoechst-stained cell nuclei at different time points over the course of 8 days showed a reduced number of cells after treatment with AdOx or knockdown of AHCY when compared to control cells (), indicating an effect of AHCY inhibition on cell proliferation. Furthermore, calculation of doubling time showed a tendency towards increased doubling time after treatment with AdOx (77.8 ± 13.8 h compared to Ctr 49.2 ± 5.5 h, p = 0.0754) or AHCY knockdown (56.9 ± 8.9 h compared to siCtr 43.3 ± 6.6 h, p = 0.0786). These results were confirmed by results of WST-1 assay measurements on day 4 (), indicating a significant reduction in cell number after AHCY inhibition and a similar trend after AHCY knockdown (p = 0.0541). In an independent approach to assess cell proliferation we measured the expression of two proliferation marker genes on day 1 of the proliferation process. SGBS cells treated with AdOx showed a significantly reduced expression of Cyclin D1 (CCND1) while the expression of proliferating cell nuclear antigen (PCNA) showed a tendency to be reduced compared to control cells (p = 0.0742; ). To exclude the hypothesis that the described effects on cell proliferation and viability were merely due to decreased cell viability and increased cell death, we performed a lactate dehydrogenase (LDH)-cytotoxicity assay on day 4 (). Results showed that cell cytotoxicity is comparably low (<10%) in all samples and that there is no significant difference in cell viability between cells undergoing AHCY inhibition and control cells.
Figure 1. AHCY inhibition and knockdown in SGBS cells impedes cell proliferation. (a) Confirmation of decreased AHCY activity after treatment with 2.5 µM adenosine dialdehyde (AdOx) compared to control treated cells (Ctr). (b) Hoechst staining of the cell nuclei and counting of number of cells on day 2, 4, 6, 8 after seeding shows a reduced number of cells after inhibition or knockdown of AHCY (representative pictures on day 4, scale bar = 1000 µm). Statistical differences were calculated using a two-way ANOVA test followed by Holm-Šídák’s multiple comparison test. (c) WST-1 assay results after four days of proliferation show that inhibition of AHCY using AdOx decreases number of viable cells. (d) LDH-Cytotoxicity assay was conducted on day 4 and shows low cell cytotoxicity (<10%) and does not differ between target cells (AdOx) and control cells (Ctr) (data shown as % of positive control (P.C.)). Statistical differences were calculated using a one-way ANOVA followed by Tukey’s multiple comparison test. (e) Inhibition of AHCY leads to reduced expression of proliferation markers CCND1 and PCNA. (f) Confirmation of AHCY knockdown using a gene specific siRNA (siAHCY) compared to non-target control siRNA (siCtr). Additional confirmation of decreased AHCY activity after knockdown of AHCY in one representative experiment with three technical replicates. (g) Cell number is reduced after knockdown of AHCY as indicated by Hoechst staining and cell counting on day 2, 4, 6, 8 (representative pictures on day 4, scale bar = 1000 µm). Statistical differences were calculated using a two-way ANOVA test. (h) WST-1 assay measurement on day 4 indicates that AHCY knockdown decreases cell number. (i) After knockdown of AHCY LDH-cytotoxicity assay shows no significant differences between siAHCY and siCtr cells (data shown as % of positive control (P.C.)). Statistical differences were calculated using a one-way ANOVA test. Unless stated otherwise, statistical differences were calculated using Student’s t-test. Results were considered statistically significant when p < 0.05 and are indicated above bar plots. Data are mean ± SEM from n = 3 independent experiments with 2-3 technical replicates each, unless stated otherwise.
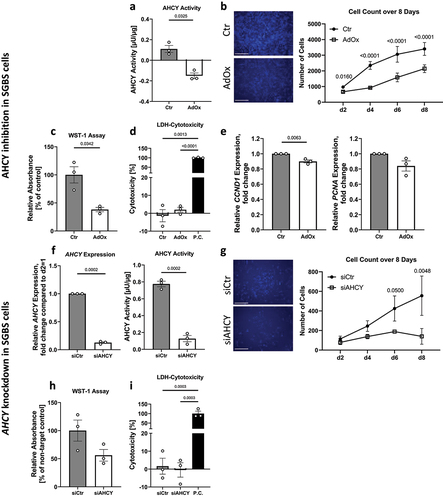
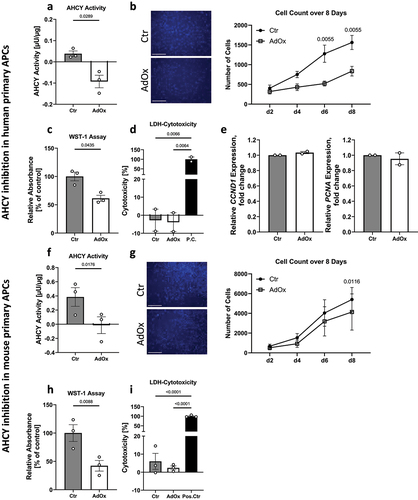
To further validate the relevance of the results obtained in SGBS cells, we next assessed the effect of AHCY inhibition in primary APCs derived from human and mouse as two additional APC models (). Since both AHCY inhibition by AdOx and siRNA-mediated knockdown of AHCY showed comparable effects on cell growth in SGBS cells (), we restricted the analyses to AdOx treatment only. We confirmed that AdOx treatment led to efficient inhibition of AHCY activity in both human and mouse primary APCs () and was associated with a reduction in cell proliferation as indicated by a reduced number of Hoechst-stained nuclei in microscopic images at different time points over the course of 8 days (). This was associated with a tendency of increased doubling time in human primary APCs (115.4 ± 9.2 h compared to Ctr 65.3 ± 13.3 h, p = 0.0122), which was less pronounced in mouse primary APCs (43.6 ± 7.5 h compared to Ctr 39.0 ± 6.6 h, p = 0.1188). Furthermore, WST-1 measurements showed a reduced signal after inhibition with AdOx on day 4 of proliferation in human primary APCs (), although the expression of the proliferation markers CCND1 and PCNA did not show significant changes on day 1 of proliferation (). Moreover, there were no significant differences in the amount of LDH in the cellular supernatant as a proxy for cytotoxicity and cell death (), indicating that the observed effects were due to a reduced proliferation rate after inhibition of AHCY.
Figure 2. AHCY inhibition in human and mouse primary APCs impedes cell proliferation. (a) Confirmation of decreased AHCY activity in human primary APCs after treatment with 2.5 µM adenosine dialdehyde (AdOx) as compared to control treated cells (Ctr). (b) Inhibition of AHCY reduces number of cells as indicated by counting of Hoechst-stained cell nuclei on day 2, 4, 6, 8 of proliferation (c) WST-1 assay measurements on day 4 indicate that AHCY inhibition leads to decreased cell viability. (d) Cell cytotoxicity is low (<10%) in target cells (AdOx) and control cells (Ctr) as indicated by results from LDH-Cytotoxicity Assay from day 4 (data shown as % of positive control (P.C.)). Statistical differences were calculated using a one-way ANOVA followed by Tukey’s multiple comparison test. (e) Expression of the proliferation markers CCND1 and PCNA on day 1 of proliferation in human primary APCs shows no significant differences after inhibition of AHCY. (f) After treatment with 5 µM AdOx AHCY activity is significantly reduced in mouse primary APCs. (g) Reduced cell count of Hoechst-stained cell nuclei on day 2, 4, 6, 8 after inhibition with AdOx (representative pictures on day 4, scale bar = 1000 µm). Statistical differences were calculated using a two-way ANOVA test. (h) Inhibition of AHCY leads to significantly reduced WST-1 signal in mouse primary APCs, indicating a reduced number of cells. (i) LDH-Cytotoxicity assay shows no significant difference between AdOx and Ctr-treated cells on day 4 (data shown as % of positive control (P.C.)). Statistical differences were calculated using a one-way ANOVA test. Unless stated otherwise, statistical differences were calculated using Student’s t-test. Results were considered statistically significant when p < 0.05 and are indicated above bar plots. Data is mean ± SEM from n = 2-3 independent experiments with 2-3 technical replicates each.
Taken together, we provide evidence that inhibition of AHCY reduced the proliferation of SGBS, human and mouse primary APCs and that these effects were not due to an increase in cell death.
AHCY inhibition decreases adipogenic differentiation capacity of APCs
We next assessed whether AHCY might be involved in adipocyte differentiation of SGBS cells. For this, we inhibited AHCY using AdOx treatment during adipogenic induction and adipocyte differentiation for 10 days and subsequently estimated adipocyte formation and lipid accumulation using Nile Red/Hoechst double staining and counting of differentiated adipocytes or Oil Red O staining in combination with absorbance measurement. Both methods showed that adipocyte differentiation is significantly reduced after inhibition of AHCY as indicated by a significant decrease in the percentage of differentiated adipocytes () and a lower total amount of intracellular lipids (). In an independent approach to evaluate the differentiation of APCs we measured the expression of the adipogenic differentiation markers peroxisome proliferator-activated receptor γ (PPARG), the master regulator of adipogenesis [Citation24], and fatty acid binding protein 4 (FABP4) [Citation25], hormone-sensitive lipase (LIPE) [Citation26] and perilipin 1 (PLIN1) [Citation27]. As expected, on day 10 of adipocyte differentiation, the expression of all four genes was significantly decreased after inhibition of AHCY compared to control cells (). As an additional control, we measured the expression of SH2B Adaptor Protein 1 (SH2B1), a gene described to be unaffected by adipocyte differentiation [Citation28] and did not see a significant difference between target cells treated with AdOx and control cells (). To confirm these results, a siRNA-knockdown of AHCY () in SGBS cells was performed showing a similar tendency towards reduced adipocyte differentiation, although the effect appeared to be less pronounced compared to the effects after daily treatment with AdOx (). For reasons of comparability, SGBS cells and human primary APCs were both differentiated in human primary APC medium supplemented with foetal calf serum (FCS). As shown in Suppl. Fig. S1, similar results were obtained using a well-established, serum-free SGBS differentiation medium as previously described [Citation23].
Figure 3. AHCY inhibition and knockdown reduces adipocyte differentiation capacity in SGBS cells. (a) Representative pictures after Nile Red/Hoechst (scale bar = 200 µM) and Oil Red O (scale bar = 500 µM) staining of cells on day 10 of differentiation indicate reduced differentiation rate in AdOx treated cells, as compared to control cells (Ctr) (representative area of picture enlarged in upper right corner). (b) Evaluation of Nile Red/Hoechst double staining and Oil Red O absorbance measurement on day 10 confirm that number of differentiated cells and overall differentiation capacity of SGBS cells treated with AdOx is reduced. (c) Inhibition of AHCY leads to decreased expression of adipogenic differentiation markers PPARG, FABP4, LIPE and PLIN1while there is no significant difference in the expression of reference gene SH2B1. (d) Confirmation of AHCY knockdown on day 0 and 10 of the differentiation process in SGBS cells treated with AHCY-specific siRNA (siAHCY) compared to a non-target control siRNA (siCtr) by q-PCR analysis. (e) AHCY knockdown results in slightly reduced differentiation capacity as indicated by representative pictures after Nile Red/Hoechst (scale bar = 200 µM) and Oil Red O (scale bar = 500 µM) staining of cells on day 10. (f) Percentage of differentiated cells after AHCY knockdown is significantly reduced whereas Oil Red O measurement shows a moderate tendency towards a reduced differentiation rate of siAHCY cells. Unless stated otherwise, statistical differences were calculated using Student’s t-test. Results were considered statistically significant when p < 0.05 and are indicated above bar plots. Data are presented in bar plots with mean ± SEM from n = 3-4 independent experiments with 2-3 technical replicates each.
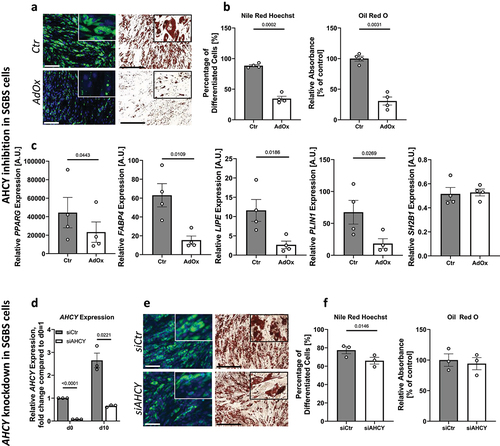
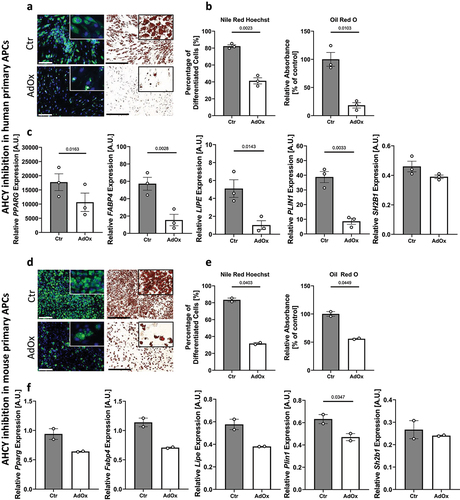
To support our results on the role of AHCY for adipocyte differentiation, we additionally investigated the effect of AHCY inhibition on in vitro adipogenesis of primary APCs obtained from human () and mouse () using the same readouts as described for SGBS cells. Confirming the results from SGBS cells, both the percentage of differentiated cells and the total amount of incorporated lipids was significantly reduced after AdOx-mediated inhibition of AHCY compared to control cells (). These observations were mirrored by the reduced expression of the adipogenic differentiation markers PPARG, FABP4, LIPE and PLIN1, while expression of the control gene SH2B1 was not significantly altered between AdOx treated cells and control cells ().
Figure 4. Reduced differentiation capacity in human and mouse primary APCs after inhibition of AHCY. (a) Nile Red/Hoechst double staining and Oil Red O staining on day 10 show that differentiation of human primary APCs is lower after inhibition of AHCY (representative pictures, scale bar Nile Red/Hoechst = 200 µM; Oil Red O = 500 µM) (representative area of picture enlarged in upper right corner). (b) Number of differentiated human primary APCs and Oil Red O absorbance is significantly reduced in cells treated with AdOx as compared to control cells (Ctr). (c) Expression of adipogenic differentiation markers PPARG, FABP4, LIPE and PLIN1 is lower in cells treated with AHCY inhibitor AdOx while the expression of reference gene SH2B1 is not significantly altered. (d) Staining of differentiated mouse primary APCs on day 10 confirm reduced differentiation capacity of AdOx treated cells (representative pictures, scale bar Nile Red/Hoechst = 200 µM; Oil Red O = 500 µM). (e) Nile Red /Hoechst and Oil Red O assessment also confirm significant reduction of differentiation rate of mouse primary APCs. (f) Expression of adipogenic markers Pparg, Fabp4, Lipe and Plin1 in mouse primary APC tend to be lower after inhibition of AHCY while no significant difference is detected in the expression of reference gene Sh2b1. Unless stated otherwise, statistical differences were calculated using Student’s t-test. Results were considered statistically significant when p < 0.05 and are indicated above bar plots. Data in bar plots are mean ± SEM from n = 2-4 independent experiments with 2-3 technical replicates each.
In summary, we provide evidence that the inhibition of AHCY significantly reduces adipocyte differentiation in all examined APC models, of human and mouse origin.
AHCY inhibition leads to alterations in DNA methylation and expression of genes related to cell growth and adipocyte differentiation in APCs
AHCY is known to be involved in cellular methylation processes, e.g. of DNA or histones [Citation11,Citation29]. In previous studies, it has been shown that aberrant activity or expression of AHCY are associated with changes in genomic methylation which ultimately leads to alterations in gene expression [Citation11]. To address the question whether methylation processes might be involved in the observed effects on APC proliferation and/or differentiation, we analysed the DNA methylation levels in SGBS cells and human primary APCs treated with AdOx compared to untreated cells using the Infinium MethylationEPIC BeadChip. We first calculated the difference in methylation levels for the 737,467 detectable CpG sites between AdOx-treated and control cells for each of the analysed cell models separately. Overall, we identified 388,985 CpG sites regulated in the same direction in both APC models (165,337 downregulated and 223,648 up-regulated). To narrow down the number of differentially methylated CpG sites, we prioritized the top and bottom 4000 CpG sites according to difference in methylation level, leaving us with 8000 CpG sites per cell line. By merging the lists of identified CpG sites from both cell lines, we identified 307 CpG sites regulated in the same direction, corresponding to 225 genes (Suppl. Table S1).
Gene ontology (GO) overrepresentation analysis of the respective genes revealed that the pathway with the highest enrichment was fat cell differentiation, followed by several processes related to growth and development (). This suggests that a dysregulation of genes implicated in these pathways might potentially underlie the observed effects of AHCY inhibition on adipocyte differentiation and proliferation of APCs. To test this hypothesis, we selected enriched genes identified in GO overrepresentation analyses and associated with fat cell differentiation (ASXL2, BNIP3, CCDC3, NR4A1, RNASEL, WIF1, WWTR1, ZADH2, STK4) and/or cellular growth processes (STK4, CDKL3, NRP1, NTRK3, PPARA; ) and measured their expression in the SGBS and human primary APCs samples from our previous methylation analyses. Expression analyses showed that four of the analysed genes, i.e. CCDC3, NR4A1, WIF1 and NTRK3, were not or only very weakly expressed, while all other genes showed a detectable and comparable expression level in untreated SGBS and human primary APCs (). Moreover, inhibition of AHCY using AdOx treatment resulted in a similar effect in both cell models with BNIP3, WWTR1, STK4 and PPARA being downregulated and only ZADH2 being upregulated, though with borderline significance. This was also the case for the rather slight downregulation of STK4 (). Taken together, global methylation analyses in combination with expression analyses after AHCY inhibition identified a dysregulation of several genes involved in adipocyte differentiation and/or cell growth and might potentially explain the observed effects on APC proliferation and differentiation.
Figure 5. Expression of annotated genes after CpG methylation analysis associated with fat cell differentiation and cell growth in GO overrepresentation analysis. Expression of genes associated with fat cell differentiation (ASXL2, BNIP3, CCDC3, NR4A1, RNASEL, WIF1, WWTR1, ZADH2, STK4) and with cell growth (STK4, CDKL3, NRP1, NTRK3 and PPARA) in AdOx-treated SGBS cells (open circles) and human primary APCs (open triangles) compared to untreated control cells on day 4 of the differentiation process. For statistical analysis SGBS and human APC expression measurements were pooled. Data in bar plots are mean ± SEM from n = 2 experiments with two technical replicates each. Results were considered statistically significant when p < 0.
Table 1. Pathways with the highest enrichment of annotated genes after CpG methylation analysis as identified by GO overrepresentation analysis.
Discussion
AHCY is known to be involved in cellular proliferation and differentiation [Citation5,Citation7,Citation8], two important processes in the development of adipose tissue that are often dysregulated in the context of obesity [Citation9,Citation10]. Here, we assessed the role of AHCY for adipocyte progenitor cell (APC) function in vitro and showed that both proliferation and adipogenic differentiation of APCs are reduced after inhibition of AHCY, which is associated with alterations in the cellular methylation pattern and a dysregulation of genes involved in processes related to fat cell differentiation and cell growth.
Using two independent methods, i.e. inhibition of enzymatic activity using a specific inhibitor and siRNA-mediated knockdown, we showed that inhibition of AHCY decreased cell proliferation in three different cell models, namely human SGBS cells and primary APCs derived from human and mouse and that this was not caused by increased cell death. In accordance with our results, it has been reported that decreased AHCY activity in different cancer cell lines inhibits cell proliferation [Citation5,Citation7] and that the loss of Ahcy function inhibits early inner cell mass proliferation and differentiation in embryos resulting in embryonic lethality of mice [Citation30]. Besides the proliferation of APCs, the differentiation into mature adipocytes is another important process in the development of adipose tissue [Citation9]. Our results show that the inhibition of AHCY reduces the capacity of all three cell models to differentiate into mature adipocytes. This observation is supported by the reduced expression of adipocyte differentiation markers PPARG, FABP4, LIPE and PLIN1. Interestingly, although all three APC models analysed in our study showed similar results of decreased adipocyte differentiation after AHCY inhibition using AdOx, we observed that sensitivity to the inhibitor was higher for human primary APCs compared to mouse primary APCs. Moreover, we observed that the effect of AHCY knockdown on SGBS cell differentiation was not as pronounced compared to the treatment with AdOx. This might be because we used a transient method for AHCY knockdown, and we observed a mild recovery of AHCY expression between day 0 and 10 of the differentiation process. Furthermore, although the activity of AHCY was significantly reduced after AHCY knockdown, a small rest activity could be detected. Despite this, our results show a tendency of reduced differentiation capacity after AHCY knockdown, which is in line with results after AdOx treatment.
Changes in the expression and activity of AHCY are associated with alterations in the methylation status [Citation11]. In line with this, our results demonstrate that the treatment with AdOx leads to alterations in the methylation of CpG sites in SGBS cells and human primary APCs. Further analysis related the detected CpG sites to their corresponding annotated genes. Plotting these genes in a GO overrepresentation analysis, ‘fat cell differentiation’ was the pathway with the highest enrichment of genes, indicating that this pathway was likely regulated by AdOx treatment.
Interestingly, a link between adipogenesis and DNA methylation has been stated in previous studies, although controversial results regarding the role of methylation in the regulation of adipogenesis have been published [Citation18,Citation31]. One study showed that inhibition of DNA methylation in 3T3-L1 preadipocytes significantly inhibited adipogenesis [Citation32]. Other enriched pathways from our analysis included processes related to the growth and development of cells. A regulation of these pathways through methylation has also previously been reported, e.g. one study showed that the inhibition of the DNA methyltransferase 1 (DNMT1) suppresses the proliferation of leukaemia cells [Citation33]. Supporting this, several studies have reported the connection between different DNA methylation inhibitors and reduced cell growth and proliferation, mainly of tumour cell lines [Citation34,Citation35]. This supports the hypothesis that the inhibition of AHCY might influence the APC differentiation process and APC proliferation possibly by globally affecting DNA methylation and subsequently gene expression.
In fact, gene expression measurement in our samples of a selection of candidate genes involved in the identified pathways fat cell differentiation and/or cell growth showed that the expression of BNIP3, WWTR1, STK4 and PPARA was downregulated, while ZADH2 was upregulated in cells treated with AdOx compared to controls. In previous studies, a downregulation of BNIP3 has been associated with decreased glucose uptake in adipocytes [Citation36], while mice lacking WWTR1 in white adipose tissue are described to develop severe lipodystrophy [Citation37]. Recently, STK4 has been described to be involved in adipocyte mitochondrial capacity, and it was suggested that inhibition of STK4 improves metabolic profiles of obese mice [Citation38]. Interestingly, ZADH2 was the only gene upregulated in our samples and other studies on ZADH2 have shown that overexpression of the gene significantly decreases adipocyte differentiation [Citation39]. Furthermore, in connection to cell growth related pathways, the inhibition of STK4 in cancer cells has been shown to decrease the proliferation of these cells [Citation40], an effect that has also been described for the inhibition of PPARA in hepatocytes [Citation41]. In the context of these studies, we propose that the inhibition of AHCY alters cellular methylation processes, which leads to a dysregulation of the expression of genes related to APC proliferation and differentiation processes. However, further studies need to be done to mechanistically draw a conclusion.
Of note, in this study we have focused on the inhibition of AHCY and did not analyse the effect of increased AHCY activity on APC proliferation and differentiation processes. However, we and others have previously reported that elevated levels of AHCY do not seem to have a major impact on these processes. It has been reported that the liver and kidney specific overexpression of Ahcy in transgenic mice does not influence the phenotype as well as the level of metabolites involved in the AHCY reaction [Citation42]. Supporting this, we recently showed that the overexpression of AHCY in SGBS cells does not influence SGBS cell differentiation [Citation17]. In the context of these studies and our results, it seems likely that a certain base level of AHCY is necessary to maintain cellular function while an increased level does not have a deleterious effect on cellular processes. Although we did not assess the effect of increased AHCY activity on APC proliferation and differentiation, our study is strengthened by the fact that we used three different cell models of two different species and independent methods to evaluate the effects. Future studies are needed, such as analyses of earlier time points of adipogenesis or of the effect of AHCY inhibition on cell cycle progression, to investigate the mechanisms by which AHCY is involved in adipocyte differentiation and proliferation in more detail.
Based on our results, we conclude that AHCY is essential for the maintenance of proliferation and differentiation capacity of APCs, possibly making the enzyme a potential target for the development of therapeutic approaches in the context of obesity.
Methods and materials
Cell lines and culture conditions
SGBS cells were kindly supplied by Martin Wabitsch from the University of Ulm, Germany. SGBS cells were cultured in DMEM/F12 basal medium (Gibco, Waltham, MA, USA) supplemented with 10% FBS (Sigma Aldrich, Darmstadt, Germany), 33 µmol/l biotin (Sigma Aldrich) and 17 µmol/l pantothenic acid (Sigma Aldrich) and 100 U/ml penicillin-streptomycin (Sigma Aldrich) as described previously [Citation43]. Human primary subcutaneous APCs (LONZA, Walkersville, MD, USA) from one female proband, aged 41 years, without any known metabolic diseases or a history of smoking or alcoholism, were cultured in DMEM/Ham F12 basal medium, 10% FBS and antibiotics. For mouse primary APCs, stroma vascular fractions (SVF) from inguinal subcutaneous adipose tissue (SAT) of 6–8-week-old male C57BL/6NTac mice was isolated as previously described [Citation44]. Briefly, pooled tissue samples of at least two mice were minced and digested in HEPES isolation buffer (0.1 M HEPES (Sigma Aldrich), 123 mM NaCl (Sigma Aldrich), 5 mM KCl (Sigma Aldrich), 1.3 mM CaCl2 (Sigma Aldrich), 5 mM glucose (Sigma Aldrich), 4% BSA (Carl Roth GmbH, Karlsruhe, Germany), 1% Zellshield (Minerva Biolabs, Berlin, Germany), pH 7.2) with 0.2% (w/v) collagenase II (Fisher Scientific, Schwerte, Germany) for 30 min at 37°C. The cell suspension was filtered through a 100 µm nylon filter and incubated on ice for 15 min. SVF was separated and filtered through a 40 µm nylon filter followed by centrifugation at 700 × g for 10 min. Cell pellets were resuspended in erythrocyte lysis buffer (154 nM NH4Cl (Sigma Aldrich), 10 nM KHCO3 (Sigma Aldrich), 0.1 mM tetrasodium EDTA (Sigma Aldrich), pH 7.3) for 5 min. After centrifugation, cells were resuspended in DMEM (Gibco) (containing 10% FCS (Sigma Aldrich), 1% Zellshield and 25 µg/ml sodium ascorbate (Sigma Aldrich)). All cell lines were cultured at 37°C with 5% CO2. Characteristic response of all cell lines to adipogenic inducers and typical expression of adipogenic marker genes allowed authentication of all cell lines as APCs.
In vitro proliferation
Cell proliferation and cytotoxicity was evaluated by WST-1 assay, LDH-Cytotoxicity assay, Hoechst staining and gene expression measurements. In brief, 1000 cells/well for SGBS, human and mouse primary APCs were seeded in 200 µl of their respective culture medium in a 96-well format. For each target and control sample triplicates were seeded and medium was changed every other day. About 96 hours after seeding, LDH-Cytotoxicity assay measurements were performed using the Cytotoxicity Detection Kit (Sigma Aldrich, Cat.no. 11644793001). For this, 100 µl of culture medium from each well were transferred onto another 96-well plate and 100 µl of LDH-cytotoxicity working reagent were added to each well. Protected from light, the supernatant was incubated at room temperature for 30 minutes before absorbance was measured at 490 nm using a microplate reader (FLUOstar OPTIMA; BMG LABTECH, Offenburg, Germany). As positive assay control, untreated cells were lysed using 2% Triton-X-100 solution (Sigma Aldrich) and measured accordingly.
To the remaining cells and medium 10 µl of WST-1, reagent (Sigma Aldrich, Cat.no. 11644807001) was added per well and incubated for 2 h at 37°C and 5% CO2. Using a microplate reader, the absorbance of the samples was measured at 450 nm.
For Hoechst staining, cells were fixed on days 2, 4, 6, 8 in Roti-Histofix 4% (Carl Roth), washed with PBS and stained for 5 min with 100 µl Hoechst solution (0.04 mg/ml, Sigma Aldrich). Pictures were taken using the EVOS Imaging System FL Auto 2 (Invitrogen, Darmstadt, Germany) and cells were counted using the Image-J software (National Institutes of Health, MD, USA). For doubling time, calculations the growth rate [gr = (ln[N(t)/N(t0)]/t)] was determined as the mean from cell numbers on days 4, 6 and 8 in comparison to day 2. The cell doubling time was then calculated from the mean growth rate as: doubling time = ln(2)/(growth rate). For gene expression measurements, 30,000 cells were seeded in a 6-well format and treated with AdOx or control reagent and frozen on day 1 at −80°C for RNA isolation.
In vitro differentiation
For adipocyte differentiation, SGBS cells and human primary APCs were seeded at 150,000 cells/well and mouse primary APCs were seeded according to yield from cell isolation on 12-well plates. All cells were seeded in duplicates for each target and control and cultured as described above until confluency was reached. SGBS and human APC differentiation was induced using Preadipocyte Basal Medium-2 (PBM-2) supplemented with Preadipocyte Growth Medium-2 (PGMTM-2) SingleQuots® (LONZA) and antibiotics. Cells were differentiated over 10 days without change of medium. Differentiation of mouse primary APCs was induced 2 days after confluency was reached (day 0) by changing the medium to the differentiation cocktail (culture medium supplemented with 30 nM insulin (Roche, Mannheim, Germany), 1 nM T3 (Sigma Aldrich), 1 µM rosiglitazone (Sigma Aldrich), 0.4 µg/ml dexamethasone (Sigma Aldrich) and 0.5 mM IBMX (Sigma Aldrich)). The medium was changed on day 2 using culture medium supplemented with 30 nM insulin. From day 4 on, cells were maintained in standard culture medium which was changed every two days until cells were differentiated (day 6). On the last day of differentiation, adipocytes of all cell lines were fixed with Roti-Histofix 4% (Carl Roth) for lipid staining or frozen at −80°C for RNA isolation.
For quantification of the differentiation efficiency, fixed cells were washed with PBS and first stained with Nile Red (10 µg/ml, Sigma Aldrich) and Hoechst solution (0.04 mg/ml) for 15 min and 5 min, respectively. Pictures were taken using the EVOS Imaging System FL Auto 2, and cells were counted using the Image-J software. The percentage of differentiated cells was determined by dividing the number of Nile Red stained cells by the number of Hoechst-stained cells. Afterwards, cells were stained with Oil Red O solution (Sigma Aldrich) (0.5% in 60% isopropanol (Carl Roth)) for 30 min at 37°C. The Oil Red O dye was extracted using 100% isopropanol and absorbance was measured at 540 nm using a microplate reader.
Adenosine dialdehyde (AdOx) treatment
To assess the effect of AHCY inhibition on APCs, cells were treated with adenosine dialdehyde (AdOx; Sigma Aldrich) which was dissolved in 0.2 M HCl (Carl Roth) and diluted in culture medium. SGBS cells, human and mouse primary APCs were seeded according to the proliferation and differentiation protocol as described above and AdOx or the control reagent (consisting only of 0.2 M HCl and diluted accordingly) was added to the culture medium. In preliminary experiments with SGBS cells and mouse primary APCs, suitable and effective AdOx concentrations were determined for each setup, namely APC proliferation (Suppl. Fig. S2) and differentiation (Suppl. Fig. S3). For reasons of comparability within species, the same AdOx concentrations were used for SGBS cells and for human primary APCs. In detail, for analysis of SGBS and human primary APC proliferation and differentiation 2.5 µM AdOx were added every 24 hours. For analysis of mouse APC proliferation, 5 µM AdOx were added to the medium and for analysis of differentiation 50 µM AdOx were added every 24 hours.
AHCY activity assay
To confirm reduced AHCY activity after treatment of cells with AdOx and knockdown of AHCY, we performed an AHCY activity assay using the Adenosylhomocysteinase Activity Fluorometric Assay Kit (Abcam, Waltham, MA, USA, Cat.no. ab197002). The kit measures the production of adenosine over time, which correspondingly can be used to assess the ability of AHCY to hydrolyse SAH to adenosine and homocysteine in vitro. Briefly, we cultured cells of each cell line in a 6-well plate each until confluency. Differentiation was then induced according to protocol and inhibitor was added in the respective concentration every 24 h. On day 4 of differentiation the inhibitor was added 1 h before harvesting cells. For AHCY knockdown samples, cells were transfected with siRNA as described below and seeded in a 6-well format. Once confluency was reached differentiation was induced according to protocol and cells were harvested on day 4. Samples were prepared according to manufacturer’s instructions and snap frozen in liquid nitrogen before storing them at −80°C. Prior to measuring AHCY activity we quantified the amount of protein in each sample using the PierceTM BCA Protein Assay Kit (Thermo Fisher Scientific, Waltham, MA, USA, Cat.no. 23225) according to manufacturer’s instructions. For the AHCY activity assay, 5 µg of protein for each sample were used and activity was measured according to the manufacturer’s protocol using a microplate reader. Measurements were corrected for any adenosine background in the sample.
siRNA-mediated knockdown
For SGBS cells, siRNA transfections were conducted using the Neon Transfection System 100 µL Kit (Invitrogen, Darmstadt, Germany) with a pulse voltage of 1300 V, pulse width 20 ms, pulse number 2 and a cell density of 6 × 10[Citation6] cells/ml [Citation45]. A final concentration of 500 nM of AHCY-specific ON-TARGETplus SMARTpool siRNA or ON-TARGETplus control siRNA (Dharmacon, Lafayette, LA, USA) were used. After electroporation, SGBS cells were seeded at a final concentration of 1,000 cells/well in a 96-well format for proliferation analyses and at 100,000 cells/well in a 12-well format for adipocyte differentiation assay. Knockdown efficiency was confirmed using q-PCR and AHCY activity assay.
RNA-isolation and quantitative real-time PCR analysis
RNA from all cell lines was isolated using the RNeasy Mini Kit (QIAGEN, Hilden, Germany, Cat.no. 74104) and on-column DNA digestion was performed according to the manufacturer’s instructions. In total 500 ng RNA were reverse transcribed into cDNA using M-MLV Reverse Transcriptase (Invitrogen, Darmstadt, Germany) and random hexamers (Promega, Madison, WI, USA).
For q-PCR analysis, a standard curve of a reference cDNA sample was used to determine the AHCY copy number in each sample and values were normalized to the mean of two reference genes, TATA-box-binding protein (TBP, tbp) and beta-actin (ACTB, actb). Primer and probe sequences for q-PCR are listed in Suppl. Table S2.
Global methylation analyses
Methylation pattern was analysed in SGBS and human APCs treated with AdOx and control cells. For sample preparation cells of both cell lines were seeded at 400,000 cells/well in a 6-well format and treated according to the differentiation protocol. On day 4 after induction of differentiation, cells were scraped from the plate and DNA was isolated using the DNeasy Blood&Tissue Kit (QIAGEN, Cat.no. 69504). DNA amount was quantified using the Qubit 4 fluorometer (Invitrogen, Darmstadt, Germany) and diluted to 9 ng/µl.
Genome-wide methylation analysis was performed using the Infinium MethylationEPIC BeadChip Kit (Illumina, San Diego, CA, USA) which produced intensity data (IDAT) files. The samples were processed with the ChAMP package in R. Probes with detection p-value >0.1 and low bead counts, as well as SNP-related probes and probes on sex chromosomes were filtered out. A beta-mixture quantile normalization (BMIQ) approach was adopted to correct intra-array between-sample bias. Given the small sample size, it was not possible to remove batch effects or other unknown confounders. Methylation levels at each CpG site were expressed as beta value representing the estimated proportion of methylation at that site, in the range of 0–100%. We computed the difference in levels (delta) between samples treated with AdOx and controls. Each delta corresponds to the estimated change in methylation level produced by the inhibition of AHCY, where a positive value indicates an increase in methylation. We first retained the CpG sites corresponding to the 4000 largest positive and the 4000 largest negative deltas for each cell line, then we intersected the CpG sites retained for SGBS cell with those retained for human primary APCs. In both cases, the intersection took into consideration the direction of change and retained only for CpG sites for which this was concordant (Suppl. Table S1). The detected genes were then analysed using a GO overrepresentation analysis (webgestalt.org). The expression of selected genes associated with fat cell differentiation as well as the overlap of genes associated with cellular growth and development was measured using q-PCR.
Statistical analysis
All cell culture data are presented as mean ± standard error of mean (SEM). Statistical significances were calculated with a paired student’s t-test for two groups, a one-way ANOVA test for a comparison between three groups or two-way ANOVA test for multiple time point comparisons using GraphPad Prism 9 (GraphPad Software, San Diego, CA, USA).
Abbreviations
ACTB, beta-actin; AdOx, adenosine dialdehyde; AHCY, adenosyl-homocysteine-hydrolase; APC, adipocyte progenitor cell; CCND1, cyclin D1; CEBPA, CCAAT/enhancer-binding protein alpha; Ctr, Control; DNMT1, DNA methyltransferase 1; ERK, extracellular signal-regulated kinase; FABP4, fatty acid binding protein 4; FCS, foetal calf serum; GO, gene ontology; IDAT, intensity data; LDH, lactate dehydrogenase; LIPE, hormone-sensitive lipase; MEK, mitogen-activated protein; PBM-2, Preadipocyte Basal Medium-2; P.C., positive control; PCNA, proliferating cell nuclear antigen; PGM-2, Preadipocyte Growth Medium-2; PLIN1, perilipin 1; PPAR, proliferator-activated receptor; q-PCR, quantitative real-time polymerase chain reaction; SAH, s-adenosyl-homocysteine; SAM, s-adenosylmethionine; SAT, subcutaneous adipose tissue; SEM, standard error of the mean; SGBS, Simpson-Golabi-Behmel Syndrome; SH2B1, SH2B Adaptor Protein 1; siRNA, small interfering RNA; SVF, stroma vascular fraction; TBP, TATA-box-binding protein; WST-1, water soluble tetrazolium-1
Author contributions
Conceptualization, P.B., K.L. and A.K.; Methodology, P.B., M.C., J.W., I.R., M.H., and K.L.; Formal Analysis, P.B., M.C., K.L.; Investigation, P.B., K.L.; Resources, J.W., M.L., W.K., A.K.; Writing – Original Draft, P.B. and K.L.; Writing – Review and Editing, P.B., M.C., J.W., I.R., M.L., M.H., W.K., A.K., K.L.; Funding Acquisition, P.B, A.K. and K.L.
Supplemental Material
Download Zip (3.9 MB)Supplemental Material
Download MS Word (17.9 KB)Supplemental Material
Download MS Word (39.2 KB)Acknowledgments
We thank Antje Berthold and Vivien Teßmar for technical assistance.
Disclosure statement
No potential conflict of interest was reported by the author(s).
Supplementary material
Supplemental data for this article can be accessed online at https://doi.org/10.1080/21623945.2023.2290218
Data availability statement
The datasets used and/or analysed during the current study are available from the corresponding author on reasonable request.
Additional information
Funding
References
- Kusakabe Y, Ishihara M, Umeda T, et al. Structural insights into the reaction mechanism of S-adenosyl-L-homocysteine hydrolase. Sci Rep. 2015;5(1):1–15. doi: 10.1038/srep16641
- Chen NC, Yang F, Capecci LM, et al. Regulation of homocysteine metabolism and methylation in human and mouse tissues. FASEB J. 2010;24(8):2804. doi: 10.1096/FJ.09-143651
- De G, Haba LA, Cantonit GL. The enzymatic synthesis of S-Adenosyl-L-homocysteine from adenosine and homocysteine. J Biol Chem. 1959;234(3):603–8. doi: 10.1016/S0021-9258(18)70253-6
- Borchardt RT, Huber JA, Wu YS. Potential inhibitors of S-adenosylmethionine-dependent methyltransferases. J Med Chem. 1976;19(9):1094–1099. doi: 10.1021/JM00231A003
- Belužić L, Grbeša I, Belužić R, et al. Knock-down of AHCY and depletion of adenosine induces DNA damage and cell cycle arrest. Sci Rep. 2018;8(1):1–16. doi: 10.1038/s41598-018-32356-8
- Chayka O, D’Acunto CW, Middleton O, et al. Identification and pharmacological inactivation of the MYCN gene network as a therapeutic strategy for neuroblastic tumor cells. J Biol Chem. 2015;290(4):2198. doi: 10.1074/JBC.M114.624056
- Park SJ, Kong HK, Kim YS, et al. Inhibition of S-adenosylhomocysteine hydrolase decreases cell mobility and cell proliferation through cell cycle arrest. Am J Cancer Res. 2015;5(7):2127–2138.
- Zhu Q, Cheng X, Cheng Y, et al. O-GlcNAcylation regulates the methionine cycle to promote pluripotency of stem cells. Proc Natl Acad Sci U S A. 2020;117(14):7755–7763. doi: 10.1073/pnas.1915582117
- Landgraf K, Rockstroh D, Wagner IV, et al. Evidence of early alterations in adipose tissue biology and function and its association with obesity-related inflammation and insulin resistance in children. Diabetes. 2015;64(4):1249–1261. doi: 10.2337/db14-0744
- Ghaben AL, Scherer PE. Adipogenesis and metabolic health. Nat Rev Mol Cell Biol. 2019;20(4):242–258. doi: 10.1038/s41580-018-0093-z
- Ponnaluri VKC, Estève PO, Ruse CI, et al. S-adenosylhomocysteine hydrolase participates in DNA methylation inheritance. J Mol Biol. 2018;430(14):2051–2065. doi: 10.1016/j.jmb.2018.05.014
- Lefterova MI, Haakonsson AK, Lazar MA, et al. PPARγ and the global map of adipogenesis and beyond. Trends In Endocrinol Metab. 2014;25(6):293–302. doi: 10.1016/j.tem.2014.04.001
- Yang Y, Wu Y, Ji M, et al. The long non-coding RNA lncMYOZ2 mediates an AHCY/MYOZ2 axis to promote adipogenic differentiation in porcine preadipocytes. BMC Genomics. 2022;23(1):700. doi: 10.1186/s12864-022-08923-9
- Arumugam MK, Chava S, Rasineni K, et al. Elevated S-adenosylhomocysteine induces adipocyte dysfunction to promote alcohol-associated liver steatosis. Sci Rep. 2021;11(1):14693. doi: 10.1038/s41598-021-94180-x
- Ali F, Ranneh Y, Ismail A, et al. Impaired of a non-DNA dependent methylation status decides the fat decision of bone marrow-derived C3H10T1/2 stem cell. Springerplus. 2013;2(1):590. doi: 10.1186/2193-1801-2-590
- Ngo S, Li X, Bhoothpur C, et al. Elevated S-adenosylhomocysteine alters adipocyte functionality with corresponding changes in gene expression and associated epigenetic marks. Diabetes. 2014;63(7):2273–2283. doi: 10.2337/db13-1640
- Kempf E, Landgraf K, Stein R, et al. Aberrant expression of agouti signaling protein (ASIP) as a cause of monogenic severe childhood obesity. Nat Metab. 2022;4(12):1697–1712. doi: 10.1038/s42255-022-00703-9
- Lee JE, Schmidt H, Lai B, et al. Transcriptional and epigenomic regulation of adipogenesis. Mol Cell Biol. 2019;39(11):e00601–18. doi: 10.1128/mcb.00601-18
- Tini G, Varma V, Lombardo R, et al. DNA methylation during human adipogenesis and the impact of fructose. Genes Nutr. 2020;15(1):21. doi: 10.1186/S12263-020-00680-2
- Yang WS, Kim JH, Jeong D, et al. 3-Deazaadenosine, an S-adenosylhomocysteine hydrolase inhibitor, attenuates lipopolysaccharide-induced inflammatory responses via inhibition of AP-1 and NF-κB signaling. Biochem Pharmacol. 2020;182:114264. doi: 10.1016/j.bcp.2020.114264
- Ramakrishnan V, Borchardt RT. Adenosine dialdehyde and neplanocin A: potent inhibitors of S-adenosylhomocysteine hydrolase in neuroblastoma N2a cells. Neurochem Int. 1987;10(4):423–431. doi: 10.1016/0197-0186(87)90068-4
- Tews D, Brenner RE, Siebert R, et al. 20 years with SGBS cells - a versatile in vitro model of human adipocyte biology. Int J Obes (Lond). 2022;46(11):1939–1947. doi: 10.1038/S41366-022-01199-9
- Wabitsch M, Brenner RE, Melzner I, et al. Characterization of a human preadipocyte cell strain with high capacity for adipose differentiation. Int J Obes Relat Metab Disord. 2001;25(1):8–15. doi: 10.1038/SJ.IJO.0801520
- Rosen ED, Sarraf P, Troy AE, et al. PPAR gamma is required for the differentiation of adipose tissue in vivo and in vitro. Mol Cell. 1999;4(4):611–617. doi: 10.1016/S1097-2765(00)80211-7
- Moseti D, Regassa A, Kim WK. Molecular regulation of adipogenesis and potential anti-adipogenic bioactive molecules. Int J Mol Sci. 2016;17(1):124. doi: 10.3390/IJMS17010124
- Holm C, Osterlund T, Laurell H, et al. Molecular mechanisms regulating hormone-sensitive lipase and lipolysis. Annu Rev Nutr. 2000;20(1):365–393. doi: 10.1146/annurev.nutr.20.1.365
- Subramanian V, Rotlienberg A, Gomez C, et al. Perilipin a mediates the reversible binding of CGI-58 to lipid droplets in 3T3-L1 adipocytes. J Biol Chem. 2004;279(40):42062–42071. doi: 10.1074/JBC.M407462200
- Bernhard F, Landgraf K, Klöting N, et al. Functional relevance of genes implicated by obesity genome-wide association study signals for human adipocyte biology. Diabetologia. 2013;56(2):311–322. doi: 10.1007/S00125-012-2773-0
- Zhou J, Yang L, Zhong T, et al. H19 lncRNA alters DNA methylation genome wide by regulating S-adenosylhomocysteine hydrolase. Nat Commun. 2015;6(1):10221. doi: 10.1038/ncomms10221
- Miller MW, Duhl DMJ, Winkes BM, et al. The mouse lethal nonagouti (a(x)) mutation deletes the S-adenosylhomocysteine hydrolase (ahcy) gene. EMBO J. 1994;13(8):1806–1816. doi: 10.1002/j.1460-2075.1994.tb06449.x
- van den Dungen MW, Murk AJ, Kok DE, et al. Comprehensive DNA methylation and gene expression profiling in differentiating human adipocytes. J Cell Biochem. 2016;117:117(12)2707–2718. doi: 10.1002/jcb.25568
- Chen YS, Wu R, Yang X, et al. Inhibiting DNA methylation switches adipogenesis to osteoblastogenesis by activating Wnt10a. Sci Rep. 2016;6(1):25283. doi: 10.1038/srep25283
- Kanda T, Nanmoku T, Oki K, et al. Effects of DNA methylation on leukemia cell proliferation. Clin Lab. 2020;66(9):1815–1821. doi: 10.7754/Clin.Lab.2020.200125
- Chuang CY, Chang CP, Lee YJ, et al. PRMT1 expression is elevated in head and neck cancer and inhibition of protein arginine methylation by adenosine dialdehyde or PRMT1 knockdown downregulates proliferation and migration of oral cancer cells. Oncol Rep. 2017;38(2):1115–1123. doi: 10.3892/or.2017.5737
- Fujita M, Kaneda M. DNA methylation inhibitor causes cell growth retardation and gene expression changes in feline lymphoma cells. J Vet Med Sci. 2017;79(8):1352–1358. doi: 10.1292/jvms.17-0179
- Tol MJ, Ottenhoff R, Van Eijk M, et al. A PPARγ-Bnip3 axis couples adipose mitochondrial fusion-fission balance to systemic insulin sensitivity. Diabetes. 2016;65(9):2591–2605. doi: 10.2337/db16-0243
- Wang L, Wang SP, Shi Y, et al. YAP and TAZ protect against white adipocyte cell death during obesity. Nat Commun. 2020;11(1):5455. doi: 10.1038/S41467-020-19229-3
- Cho YK, Son Y, Saha A, et al. STK3/STK4 signalling in adipocytes regulates mitophagy and energy expenditure. Nat Metab. 2021;3(3):428–441. doi: 10.1038/S42255-021-00362-2
- Yu YH, Chang YC, Su TH, et al. Prostaglandin reductase-3 negatively modulates adipogenesis through regulation of PPARγ activity. J Lipid Res. 2013;54(9):2391–2399. doi: 10.1194/JLR.M037556
- Bata N, Chaikuad A, Bakas NA, et al. Inhibitors of the hippo pathway kinases STK3/MST2 and STK4/MST1 have utility for the treatment of acute myeloid leukemia. J Med Chem. 2022;65(2):1352–1369. doi: 10.1021/acs.jmedchem.1c00804
- Aibara D, Takahashi S, Yagai T, et al. Gene repression through epigenetic modulation by PPARA enhances hepatocellular proliferation. iScience. 2022;25(5):104196. doi: 10.1016/j.isci.2022.104196
- Lee HO, Wang L, Kuo YM, et al. S-adenosylhomocysteine hydrolase over-expression does not alter S-adenosylmethionine or S-adenosylhomocysteine levels in CBS deficient mice. Mol Genet Metab Rep. 2018;15:15–21. doi: 10.1016/j.ymgmr.2018.01.002
- Körner A, Wabitsch M, Seidel B, et al. Adiponectin expression in humans is dependent on differentiation of adipocytes and down-regulated by humoral serum components of high molecular weight. Biochem Biophys Res Commun. 2005;337(2):540–550. doi: 10.1016/j.bbrc.2005.09.064
- Zieger K, Weiner J, Kunath A, et al. Ablation of kallikrein 7 (KLK7) in adipose tissue ameliorates metabolic consequences of high fat diet-induced obesity by counteracting adipose tissue inflammation in vivo. Cell Mol Life Sci. 2018;75(4):727–742. doi: 10.1007/S00018-017-2658-Y
- Landgraf K, Klöting N, Gericke M, et al. The obesity-susceptibility gene TMEM18 promotes adipogenesis through activation of PPARG. Cell Rep. 2020;33(3):108295. doi: 10.1016/j.celrep.2020.108295