
ABSTRACT
This article aims to explore the trends of monoclonal antibodies (mAbs) research and commercialization, mainly to examine the development trajectories by a contrastive exploration of successful and unsuccessful mAb. This work is based on two sets of R&D project reports, consisting of 517 discontinued mAb project reports and 64 marketed mAb project reports, from IMS Lifecycle R&D Focus. The analysis of drug development processes will provide the basic evidences of mAb technology commercialization. We examined the mAb research and commercialization from three perspectives: (1) Countries with mAb research activity; (2) Organizations participating in mAb research and development; and (3) Clusters of keywords (indication and class description) regarding mAb. The technology factor, the market factor and the abilities of participating firms to pursue commercialization were analyzed. Through data analysis, we have discovered that the research and development on mAb has reached a mature and diversified stage.
Introduction
The development of monoclonal antibodies (mAbs) has made great progress both in technical research and clinical application over the past three decades.Citation1 Orthocline OKT3, a murine mAb, was the first therapeutic mAb approved for the prevention of kidney transplant rejection in 1986.Citation2 Subsequently, chimeric mAbs were developed to overcome the drawbacks of murine mAb in the 1990s.Citation1 Since 2002, humanized and fully human mAbs were successfully developed and approved for clinical applications.Citation2 In addition, the development of biospecifics and antibody drug conjugates (ADC) as additional forms of licensed antibodies has advanced significantly.Citation1 By the end of December 2016, 64 mAb products have been approved worldwide for the treatment of various diseases. mAbs have become more widely adopted in the clinical field and have become the new backbone of the pharmaceutical industry.Citation3 According to the global market statistics of Firestone, the sales of mAbs has been increased by ∼7-fold, from 2005 to 2015, to US$98 billion in 10 years.Citation4 Five mAbs were included in the top ten best-selling drugs in 2016.Citation5 Until now, mAb has made a remarkable transformation from a scientific tool to a useful drug for human therapeutics.Citation6-7
As we know, there are immunotherapeutic mAbs and non-immunotherapeutic mAbs. This drug class can be generally divided into two categories of therapeutic mAbs based on the mechanism of action. One category is designed to modulate immune responses by directly target immune competent cells or molecules. Another category is designed to target cells or molecules not belonging to the classic immune system. However, all mAb molecules inevitably have certain level of regulatory effect on immune systems as they are products of immune cells and in turn they are also important molecules to execute function of effectors on these immune cells. In fact, in systems such as natural killer (NK) cells, monocytes, macrophages, and granulocytes, the Fc region of mAbs binds to the receptors expressed by various immune cells, thus resulting in a modulation of immune responses.Citation1 Furthermore, although they are not specifically designed to target cells in the immune system, many mAbs still have the capacity to up- or down-regulate the activation of immune cells. Their immunoregulatory activities are known to contribute to their therapeutic effect. Therefore, we found that it is not necessary to separate mAbs into those with immunotherapeutic effects or those targeting infectious diseases.Citation7-10
According to a review of historical success and turnover rates of biopharmaceutical product development candidates, approximately 26% of the mAb candidates which enter Phase 2 human clinical trials will ultimately achieve market approval with an average development time of approximately seven years.Citation11-13 The markedly low success and turnover rates of mAb research and development (R&D) presents significant challenges regarding the identification of emerging trends and new developments of mAb research. Specifically, this raises the question: What are the characteristics that distinguish successful mAb projects from these that are unsuccessful?
In addition, the rapid development of mAb R&D has presented challenges regarding how to promote the mAb R&D and commercialization to be successfully commercialized. As the accumulated mAb R&D projects are becoming extensive, the traditional expert review is restricted in its ability to provide a comprehensive and deep understanding of this topic. Geng et al. surveyed the landscape of R&D projects of mAb from the perspectives of therapeutic indications, development phases, participants and citations of related patents.Citation14 Kong et al. investigated the evolution process of collaborative inter-organizational networks of the R&D on mAb based on the IMS R&D projects.Citation15 These investigations provided valuable information regarding the status of the mAb field.Citation14-15 However, there remaining a pressing need for a scientometric analysis to provide a deeper understanding of the trends regarding mAb research and commercialization. Specifically, to provide basic evidences for the trends of mAb research and commercialization through a comparison analysis of successful and unsuccessful mAb R&D projects.
This paper presents findings from the IMS Lifecycle R&D Focus of mAbs, which is a scientometric analysis of the trends involving mAb research and commercialization. The emphasis of this analysis draws on the data collected globally from the IMS Lifecycle R&D Focus globally. The major focus of this study is on the latest phases of mAbs products, including those that have been discontinued and those that have been brought to market. It is consistent with the project objective of examining the development trajectories by comparative analysis of successful and unsuccessful mAb products.
Moreover, this study is novel with regard to its use of the CiteSpace software package for the purpose of R&D project data analysis. CiteSpace software package is used to guide this study as a computational approach. CiteSpace is a Java application designed for visualizing emerging trends and abrupt changes in the scientific literature.Citation16-17 This visual analytic system is readily accessible and specifically designed to meet the needs for generating a systematic review of a rapidly changing and complex field.Citation13 The ability to facilitate the detection and interpretation of emerging trends and transition patterns is one of the main features of CiteSpace.Citation18 Therefore, it is anticipated that the emerging trends and transition patterns of mAb research can be identified and defined through the use of CiteSpace.
Results
Summary of the IMS Lifecycle R&D Focus data
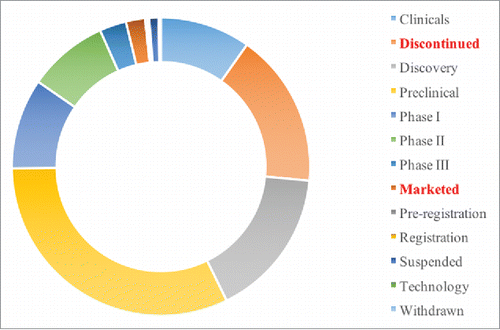
The IMS Lifecycle R&D Focus database contains data regarding drug R&D at all stages of development. As shown in , there are 2,792 mAb projects in this database. The biggest data cluster is Preclinical (993, 35.6%), the second largest data cluster is Discontinued (517, 18.5%) and the Marketed data cluster accounts for only 2.3% (64). In this study, we focus on the mAb data clusters representing the “Discontinued” and “Marketed” projects.
Figure 1. The summary of mAb projects in the IMS database. This figure is laid out by the different R&D phases in the IMS Lifecycle R&D Focus Database and summarizes the proportion of each phase of mAb R&D projects.
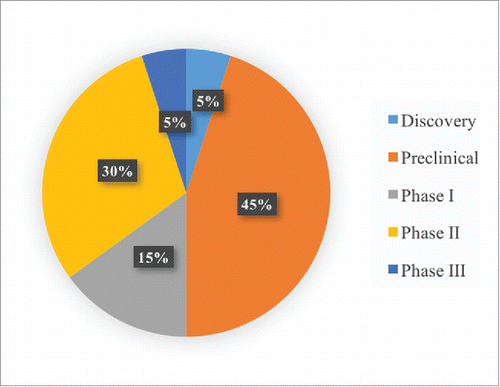
All of the mAb projects in the “Marketed” cluster are at the same stage of development. However, there are many different stages in the “Discontinued” data cluster. As shown in , there are five different stages (Discovery, Preclinical, Phase I, Phase II and Phase III) in the Discontinued data cluster. Most of these Discontinued projects are in the preclinical stage (45%), and this proportion is followed by those in the Phase II stage (30%).
Figure 2. The summary of mAb projects in the IMS database. This figure is laid out by the different R&D phases in the “Discontinued” category and summarizes the proportion of each phase of mAb R&D projects.
Analysis of the major countries
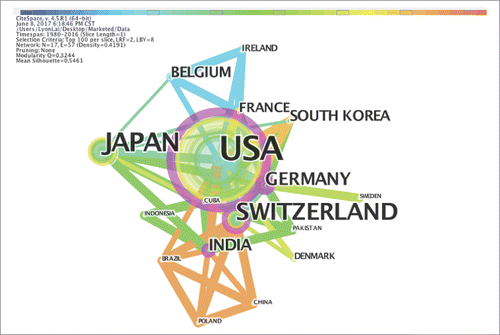
Analyses of the major countries with discontinued and marketed mAbs projects are shown by country networks in and . These two networks were generated from the “Discontinued” dataset and the “Marketed” datasets. There are 35 counties with projects in the “Discontinued” network and 17 countries with projects reaching the “Marketed” network. The USA is the most active country and at the center of these nodes in both networks. China has interacted with the USA, Switzerland, India, Brazil and Poland since 2012. Denmark exhibited rapid growth from 2001 to 2008 with a strength of 4.3939 in the “Discontinued” network, which indicates that many R&D projects focusing on mAbs have been carried out in Denmark.
Figure 3. The major countries with mAb projects belonging to the “Discontinued” category. This figure is laid out by the different countries in the “Discontinued” category and summarizes the interrelation of different countries in the network.
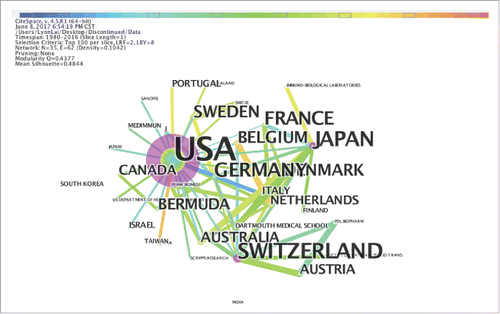
Figure 4. The major countries with “Marketed” mAbs projects. This figure is laid out by the different countries in the “Marketed” category and summarizes the interrelation of different countries in the network.
Analysis of the landmark organizations
Analyses of the landmark organizations are shown by author (company) networks in and . These two networks were generated from the “Discontinued” and “Marketed” datasets. As shown in , there are 232 companies in the “Discontinued” network, including 171 enterprises (73.7%), 36 research institutes (15.5%) and 25 universities (10.8%). Bristol-Myers Squibb stands out with the largest circle, but the earliest research on mAbs was not performed by this company. It was found that twenty companies have cooperative relationships with over ten different companies. Specifically, Bristol-Myers Squibb has the most cooperative relationships and has cooperated with thirteen different companies since 1988. Roche and AstraZeneca follow Bristol-Myers Squibb in terms of the number of cooperative relationships in second and third place, respectively.
Figure 5. The major companies that have “Discontinued” mAbs projects. This figure is laid out by the different companies in the “Discontinued” category and showing the interrelation of different companies in the network.
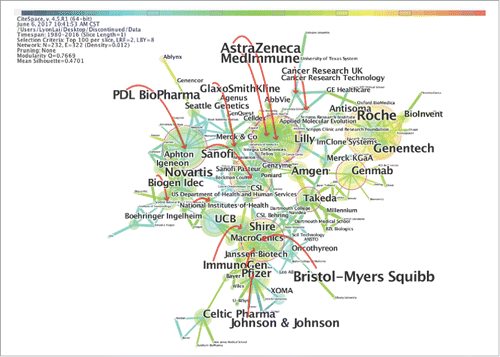
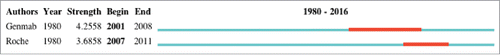
There were two author citation bursts found in the “Discontinued” category, which suggested that many R&D projects were carried out in a certain period. In addition, the burst of an event in terms of the frequency of the event. As shown in , Genmab exhibited a burst of research from 2004 to 2011 with a strength of 6.069, and Roche underwent a burst from 2007 to 2011 with a strength 3.6858.
Figure 6. The author citation bursts of “Discontinued”. This figure is laid out by the author (company) citation bursts and showing the burst strength and period.
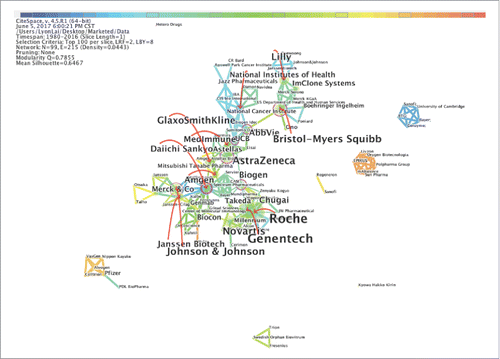
As shown in , the node represents various companies in the “Marketed” dataset. There are 99 companies in the “Marketed” network, including 92 enterprises (92.9%), 6 research institutes (6.1%) and 1 university (1.0%). The 99 companies correspond to 64 marketed products. The relationship that the cooperative companies (through partnerships between two or more companies) contribute to a single marketed product include technical cooperation, financial cooperation, channel cooperation, marketing cooperation and intellectual property cooperation. Furthermore, the company that markets the product should be considered the primary organization in this regard. Roche stands out with the largest circle. Roche has the most cooperative relationships and has cooperated with two different companies since 1989, which were followed by Genentech and Bristol-Myers Squibb. No other companies with citations bursts were found in the “Marketed” category.
Figure 7. The major companies of “Market”. This figure is laid out by the different companies in the marketed category and showing the interrelation between different companies in the network.
summarizes the top ten companies in the “landmark actor” network, including the quantity of cooperative companies, the quantity of marketed products and discontinued products. Roche is the most active company conducting mAb R&D and has marketed the most mAb products. The correlation index of cooperative company and marketed product is 0.6648 (p<0.05).
Table 1. The summary of the top ten companies in landmark actor network (rank by Marketed).
Analysis of the main research areas
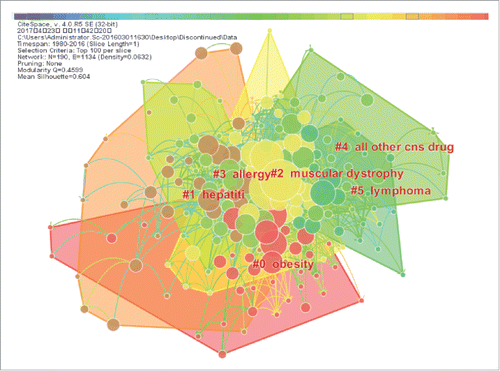
The main research area analysis was arranged by keyword (Indication and Class Description) co-citation networks. These two networks were generated from the “Discontinued” and “Marketed” datasets. As shown in , the node represents different cited keywords describing the “Discontinued” dataset. The modularity Q 0.4599 and mean silhouette 0.604 suggest a good inter-cluster connection within the network and considerable partition of the network, which show a significant network for main research area analysis. There are 190 keywords (Indication and Class Description) in the network. Based on the quantity of each cluster, the largest cluster in the visualization is #0 obesity, which is followed by #1 hepatitis and #2 muscular dystrophy.
Figure 8. The main research areas of the “Discontinued” category. This figure is laid out by the different research areas in the “Discontinued” category and showing the interrelation of different research areas in the network.
There is only 1 keyword in the “Discontinued” category that exhibited citation bursts. As shown in , the keyword “solid tumor” exhibited a citation burst from 2004 to 2011, with a strength of 6.069.
Figure 9. The keyword citation bursts found in the “Discontinued” category. This figure is laid out by the keyword (indication and class description) citation bursts and showing the burst strength and period.
As shown in , the node represents different cited keywords in the “Marketed” dataset. The modularity Q 0.5979 and mean silhouette 0.6841 suggests a strong inter-cluster connection (i.e., a connection among different clusters) within the network and considerable partition of the network, which indicates a significant network exists for main research area analysis. There are 152 keywords (Indication and Class Description) in this network. The largest cluster in the visualization is #0 lung cancer, which is followed by #1 intestinal anti-inflammatory agent and #2 asthma. There are no keyword citation bursts in the “Marketed” network.
Figure 10. The major research areas of “Marketed”. This figure is laid out by the different research areas in the “Marketed” category and showing the interrelation of different research areas in the network.
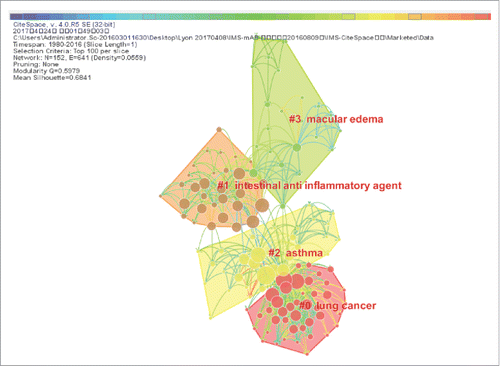
summarizes the top cited keywords derived from the Discontinued projects and Marketed projects categories. These summaries show the development characteristics of both unsuccessful and successful mAb R&D projects. In the top ten cited keywords of these two clusters, most of them were focused on similar research areas (cancer, antineoplastic monoclonal antibody, solid tumor, other immunosuppressant, rheumatoid arthritis, gastrointestinal/gastric cancer and hematological cancer) and were generally implemented in the same period (1985-1994). Besides, the similar research areas that cancer, solid tumor, rheumatoid arthritis and hematological cancer in the period of 1995 to 2004. The similar research areas that cancer, antineoplastic monoclonal antibody, lung cancer and rheumatoid arthritis in the period of 2005 to 2016. However, the research areas of genitourinary cancer, transplant rejection and lung cancer were among the top ten cited keywords of the Discontinued projects, not in the main research areas of “Marketed” projects. Lymphoma was a prolific research topic among the mAb R&D projects. In this “Discontinued” group, there are six keywords belonging to the cluster of #2 muscular dystrophy and three keywords belonging to the cluster of #0 obesity. In this Marketed group, there are four keywords belonging to the cluster of #0 lung cancer, three keywords belonging to the cluster of #1 intestinal anti-inflammatory agent and three keywords belonging to the cluster of #2 asthma.
Table 2. The top ten cited keywords in the “Discontinued” and “Marketed” categories (ranked by year).
Discussion
At first, it should be noted that there is a fundamental difference between the ‘discontinued’ and ‘suspended’ categories in the IMS Lifecycle database. The “Suspended” category refers to preclinical or clinical developments that are reported by the sponsor to be on hold. Meanwhile, the “Discontinued” category refers to development (preclinical and/or clinical) that has ceased. The suspended projects may be resumed, but the discontinued projects have been identified as inactive programs that are unlikely to resume.
In this study, the structure and dynamics of the citation network and thematic trends involving mAbs were explored. Based on the above comparative analysis, we found that mAb R&D projects had mainly been conducted in the USA, while Bristol-Myers Squibb, Roche, Genentech and AstraZeneca had played the key roles in mAb development. Particularly, Bristol-Myers Squibb mainly carried out the mAb R&D projects in the USA, Belgium, the UK, France and Japan. Roche mainly carried out the mAb R&D projects in Switzerland and the USA. Genentech was purchased by Roche in 2009, thus accounting for the dominance of these two companies in the mAb field. AstraZeneca mainly carried out their mAb R&D projects in the USA, the UK and Sweden. Furthermore, cancer, antineoplastic monoclonal antibody, hematological cancer, solid tumor, gastrointestinal cancer, immunosuppressant and rheumatoid arthritis were the major research areas. However, the geographic distribution of the research projects was relatively more heavily concentrated in the “Marketed” network than in the “Discontinued” network.
Our last mAb study was a scientometric study that explored the thematic trends, landmark articles and emerging trends involving mAb research based on bibliographic records.Citation19 In that bibliometrics study, we focused on the mAb research projects that were mainly carried out by universities and identified trends regarding the new exploration directions, the interactions between technologies and diseases, and evolving global collaboration. However, in this study, we focused on the mAb R&D projects which were mainly carried out by enterprises with drug development as their clear objectives. We conducted a comparative analysis of the successful and unsuccessful projects to explore the thematic trends, landmark organizations and emerging trends. The bibliometrics study mainly reflected the evolutionary process of mAb development, which described a “how” question: how does mAb research evolve? It is helpful to evaluate the technological factor of mAb technology commercialization. However, this R&D project study mainly reflected the breakthrough point of mAb development, which described a “what” question, notably: what is the breakthrough point? This can be explored by analysis of the major countries, landmark organizations and main research areas in mAb R&D. It is helpful to evaluate the technology factors, the market factors and firm capability of mAb technology commercialization.Citation20-22
It was apparent that cooperative capability is a key factor for showing good performance regarding the firm capability. The R&D of mAbs requires a significant advanced labor input and capital investment. Consequently, the companies in the network are mainly multinational pharmaceutical companies or large research institutions. They are frequently collaborating with different companies that show the surprisingly impressive capabilities for the participating firms, which provide a significantly positive impact on mAb technology commercialization. This applies to both the “Discontinued” group and the “Marketed” group.
It was apparent that research area is a key factor for providing good performance regarding the market factor and technology factor. It not only reflects the market supply and demand, production service and newer technologies, but also reflects the technical maturity. Esophageal cancer, gastric cancer and lung cancer are the top three cancers with a high incidence.Citation23 Antineoplastic monoclonal antibodies, hematological cancer, solid tumors, gastrointestinal cancer, lung cancer, immunosuppressants and rheumatoid arthritis were the major research areas in both the “Discontinued” group and the “Marketed” group. Specifically, half of the “Discontinued” projects were discontinued after the preclinical stage. These research areas are consistent with tumor epidemiology and reflect the market supply and demand, and the availability of new manufacturing technology. Moreover, the more R&D projects that have been carried out, the more mature the mAbs field and related technology will become in relevant technology development. Therefore, we can identify the market factors and technology factors for mAb technology commercialization.
This is a scientometric analysis to explore the structure and the evolution trends regarding mAbs R&D, nevertheless, some research limitations are noticeable. Firstly, there are immunotherapeutic mAbs and non-immunotherapeutic mAbs. However, we did not segregate immunotherapeutic mAbs from mAbs targeting infectious diseases. We realized that their immunoregulatory activities are known to contribute to their therapeutic effect. In the future study, we will try to explore the immunotherapeutic mAbs and non-immunotherapeutic mAbs, respectively. Secondly, the data regarding the discontinued mAbs projects were collected from the IMS Lifecycle R&D Focus Database. The problem with the “Discontinued” category is that it is not possible to ascertain that a mAb project has been formally discontinued. Moreover, it's possible that the data of discontinued project pursued by a private company or an institute would be missing. In this case, the discontinued projects that have been formally announced as such may be a biased subset of all discontinued projects. A future study could verify the true nature of the projects and extend the current findings to incorporate a cross analysis of mAb research with the data from private's companies or institutes.
Conclusions
In summary, this study analyzed the structure and the evolution trends of the mAb field over time through an analysis of R&D projects using the CiteSpace program. This work reflects the base evidence of the importance of technology factors, market factors and firm capability in the pursuit of mAb technology commercialization. Our findings have revealed that the R&D on mAb has reached a mature and diversified stage.
Methods
Data collection
IMS Lifecycle database combines three pharmaceutical databases into one platform, to drive more informed decision-making at three critical and defining stages of the drug's Lifecycle: R&D, launch activity and patent expiry. R&D Focus covers aspects of global pharmaceutical and biotechnology product development, from discovery stage research to availability on the market. The main sources of information for R&D Focus are company press releases, company interviews and websites, and scientific conferences (e.g. ASCO, AACR). The information would be updated at any time when the new information is acquired. The database allows the evaluation of the progress of R&D pipelines from discovery to phase III, the review of registered and recently marketed products, and the identification of new business opportunities for licensing or partnering.
We collected the data from the IMS Lifecycle R&D Focus Database. The mAb R&D projects are divided into thirteen different phases, including clinical, discontinued, discovery, preclinical, Phase I, Phase II, Phase III, marketed, pre-registration, registration, suspended, technology and withdrawn. Through a search of the different R&D phases, we can collect the target data that the discontinued mAb projects data and marketed mAb projects data. DA was developed to retrieve “discontinued” mAb projects as the data set DA, while DB was developed to retrieve “marketed” mAb projects as the data set DB. There are 517 discontinued mAb projects in the data set DA and 64 marketed mAb projects in the data set DB.
Data analysis
CiteSpace was developed to visualize data with the literature format of Web of Science. The different field of literature reflect different themes. However, the data format of R&D projects categorized in the IMS Lifecycle R&D Focus database is different from that in Web of Science literature. In the literature, there are 39 standard fields for CiteSpace analysis, including title, keyword plus, description keyword, author, institution, abstract, published year, and reference. But in the R&D project of the IMS Lifecycle R&D Focus database, the standard fields include generic name, licensor, licensee, latest phase, indication, action, class description, company, franchise, patentee and fourteen other fields.
Although the standard fields are different between these two kinds of data, the implication of particular contents are similar. Based on the analysis mechanism of CiteSpace and essential contents of mAb R&D projects, we attempted to transform the field of mAb R&D project data to the standard field of Web of Science literature that are required by CiteSpace analysis. The keywords of literature point out the research areas and the frequency of these keywords in literature reflects the development trend and the main research areas. Accordingly, the indication and class description of mAb R&D project point out the research areas of each mAb R&D project. Therefore, the results obtained via indication and class description analysis can correspond to keyword analysis. In the same way, the company field in mAb R&D project correspond to the author field in literature, which reflects the cooperative relationship and landmark organizations. The company's national field in mAb R&D project correspond to the institution field in literature, which reflects the primary country where the project is carried out. Therefore, we can reformat the data text of mAb R&D projects base on the CiteSpace requirement. shows a summary of the format conversions.
Table 3. Summary of the format conversions.
Following an inspection of the IMS Lifecycle data for all of the marketed mAbs drugs, we were able to anticipate which fields would appear on which CiteSpace analysis (e.g., preferred name, indication, class description, etc.). Therefore, once the format conversion was complete, we were able to isolate these fields and extract the data therein for our sample of mAbs. These fields, denoted as variables, are the focus of this analysis.
Furthermore, the burst analysis is associated with the members of a cluster. In particular, it refers to the rate of change over time. Specifically, when the number of citations referring to an article is found to change dramatically over a short period of time, this article is regarded as citation burst. CiteSpace adopts a burst detection algorithm. In this study, we carried out a burst analysis of the fields of countries, organizations and research areas of mAb R&D projects. The strength value is used to measure the burst analysis, with a higher strength value corresponding to a stronger burst.
Disclosure of potential conflicts of interest
The authors declare that there is no conflict of interests regarding the publication of this paper.
Acknowledgement
Dr. Ian W. Wyman, Department of Chemistry at Queen's University, Canada, is acknowledged for his help with proofreading this manuscript.
Additional information
Funding
References
- Weiner GJ. Building better monoclonal antibody-based therapeutics. Nat Rev Cancer. 2015;15:361-70. PMID:25998715. doi:10.1038/nrc3930
- Liu JKH. The history of monoclonal antibody development: Progress, remaining challenges and future innovations. Ann Med Surg. 2014;3(4):113-6. doi:10.1016/j.amsu.2014.09.001
- Shepard HM, Phillips GL, Thanos CD, Feldmann M. Development in therapy with monoclonal antibodies and related proteins. Clin Med. 2017;17(3): 220-232. doi:10.7861/clinmedicine.17-3-220
- Firestone Inventing. The global map of Monoclonal antibody drugs 2016 Report. Hangzhou, China: Firestone; 2016. Available at: http://www.hsmap.com/precision_medical_detail.html?pm_child = % E6%8A%97%E4%BD%93%E8%8D%AF%E7%89%A9&report_id = 115&report_name = %E7%81%AB%E7%9F%B3%E5%8F%91%E5%B8%83-%E6%8A%97%E4%BD%93%E8%8D%AF%E7%89%A9%E5%85%A8%E7%90%83%E5%9C%B0%E5%9B%BE
- Kennedy PJ, Oliveira C, Granja PL, Sarmento B. Monoclonal antibodies: technologies for early discovery and engineering. Crit Rev Biotechnol. 2017;1-15. doi:10.1080/07388551.2017.1357002
- Ecker DM, Jones SD, Levine HL. The therapeutic monoclonal anti- body market. MAbs. 2015;7(1):9-14. PMID:25529996. doi:10.4161/19420862.2015.989042
- Scott AM, Wolchok JD, Old LJ. Antibody therapy of cancer. Nat Rev Cancer. 2012;12:278-87. PMID:22437872. doi:10.1038/nrc3236
- Rimawi MF, Schiff R, Osborne C. Targeting HER2 for the treatment of breast cancer. Annu Rev Med. 2015;66:111-128. doi:10.1146/annurev-med-042513-015127.
- Lavaud P, Andre F. Strategies to overcome trastuzumab resistance in HER2-overexpressing breast cancers: focus on new data from clinical trials. BMC Med. 2014;12:132. doi:10.1186/s12916-014-0132-3.
- Yarden Y, Sliwkowski MX. Untangling the ErbB signalling network. Nat Rev Mol Cell Bio. 2001;2:127-37. doi:10.1038/35052073.
- Ecker DM, Ransohoff TC, Jones SD, Levine HL. The state of mammalian cell culture biomanufacturing. Woburn (MA): BioProcess Technology Consultants, Inc; 2011 Dec 12; 150 p. Available at: http://www.bptc.com/Ecommerce/Reports.
- DiMasi JA, Feldman L, Seckler A, Wilson A. Trends in risks associated with new drug development: success rates for investigational drugs. Clin Pharmacol Ther. 2010;87(3):272-277. doi:10.1038/clpt.2009.295
- Pavlou AK, Reichert JM. Recombinant protein therapeutics-success rates, market trends and values to 2010. Nat Biotechnol. 2004;22(12):1513-1519; doi:10.1038/nbt1204-1513
- Geng XM, Kong XJ, Hu H, Chen JY, Yang FQ, Liang HU, Chen X, Hu YJ. Research and development of therapeutic mAbs: an analysis based on pipeline projects. Hum Vacc Immunother. 2015;11(12):2769-2776. doi:10.1080/21645515.2015.1074362
- Kong XJ, Wan JB, Hu H, Su SB, Hu YJ. Evolving patterns in a collaboration network of global R&D on monoclonal antibodies. MABS. 2017;0(0):1-11. doi:10.1080/19420862.2017.1356527
- Chen CM. CiteSpace II: Detecting and visualizing emerging trends and transient patterns in scientific literature. J Am Soc Inf Sci Tech- nol. 2006;57(3):359-77. doi:10.1002/asi.20317
- Chen CM, Hu ZG, Liu SB, Tseng H. Emerging trends in regenerative medicine: a scientometric analysis in CiteSpace. Expert Opin Biol Ther. 2012;12(5):593-608. PMID:22443895. doi:10.1517/14712598.2012.674507
- Chen CM, Dubin R, Kim MC. Emerging trends and new developments in regenerative medicine: a scientometric update (2000-2014). Expert Opin Biol Ther. 2014;14(9):1295-17. PMID:25077605. doi:10.1517/14712598.2014.920813
- Lai YF, Wang RB, Chen X, Tang DS, Hu YJ, Cai J, Zhang QW, Hu H. Emerging trends and new developments in monoclonal antibodies: A scientometric analysis (1980-2016). Hum Vacc Immunother. 2017;13(6):1388-1397. doi:10.1080/21645515.2017.1286433
- Duan LM, Du YP, Meng L. An empirical research on the factors influencing the commercialization's performance of emerging technology. Studies in Science of Science. 2012;30(9):1354-1362. doi:10.16192/j.cnki.1003-2053.2012.09.010
- Youtie J, Hicks D, Shapira P, Horsley T. Pathways from discovery to commercialization: using web sources to track small and medium-sized enterprise strategies in emerging nanotechnologies. Technol Anal Strateg. 2012;24(10):981-995. doi:10.1080/09537325.2012.724163
- Shapira P, Youtie J, Arora S. Early patterns of commercial activity in graphene. J Nanopart Res. 2012;14:811. doi:10.1007/s11051-012-0811-y
- He XL, Qian Q, Zhang Z. Visualization: based analysis of tumor epidemical data. Chin J Med Libr Inf Sci. 2016;25(1):73-80. doi:10.3969/j.issn.1671-3982.2016.01.016