
ABSTRACT
The cytochrome P450 (CYP) is a large and complex eukaryotic gene superfamily with enzymatic activities involved in several physiological and regulatory processes. As an objective, an in-silico genome-wide DNA methylation (5mC) analysis was performed in rice (Oryza sativa cv. Zhonghua11), and the epigenetic role of CYPs in two abiotic stresses was observed. Being a stable representative mark, DNA-methylation alters the gene expression under stressful environmental conditions. Rice plants under salinity and drought stresses were analyzed through MeDIP-chip hybridization, and 14 unique genes of the CYP family were identified in the rice genome with varying degrees of methylation. The gene structure, promoter sequences, and phylogenetic analysis were performed. Furthermore, the responses of CYPs to various abiotic stresses, including salinity, drought, and cold were revealed. Similarly, the expression profile of potential CYPs was also investigated under various phytohormone stresses, which revealed the potential involvement of CYPs to hormone regulations. Overall, the current study provides evidence for CYP’s stress regulation and fundamental for further characterization and understanding their epigenetic roles in gene expression regulation and environmental stress regulation in higher plants.
Introduction
Global climate changes exert a plethora of abiotic stresses on plants, including salinity and drought that ultimately lower crop production.Citation1,Citation2 Plants have evolved a variety of physiological and biochemical mechanisms to cope with environmental hazards. However, genomics and molecular biology approaches revealed numerous stress-responsive genes to tolerate the related hazards.Citation3 Meanwhile, altering the stress-responsive genes expression level with their protein level helps to understand the plant’s ability to tackle adverse environmental conditions. The Cytochrome P450 (CYP) is an ancient and ubiquitous enzyme protein that is mainly accountable for the oxidative metabolism of diverse exogenous and endogenous compounds.Citation4 The CYPs enzymes are designated due to their ability to absorb the light at 450 nm and catalyzed numerous xenobiotic and biosynthetic pathways such as xenobiotics detoxification, carbon assimilation, secondary metabolites biosynthesis, drug deactivation, defense-related compound, UV protection, phytohormones, pigmentation, and procarcinogen activation.Citation5–9
Nomenclature and classification of CYPs are based on peptide similarity. According to this system, two CYP proteins sharing a sequence identity of greater than 40% belong to the A-type family, and 55% belong to the non-A-type subfamily. In plants, the A-type was included in CYP71 clads, whereas the non-A type was grouped in ten clads, including CYP51/72/74/85/86/97/710/711/727/746.Citation10 Gene duplications and divergence are responsible for this great diversity of CYP gene families under adaptive diversification.Citation11,Citation12 In-plant genome, CYPs enzymes are more abundant compared to other organisms. Genome-scale identification of CYP has been performed in numerous model plants, such as 272 members in Arabidopsis thaliana, 312 members in Populus trichocarpa, 316 members in Vitis vinifera, 356 members in Oryza sativa, 372 members in Sorghum bicolor, and Glycine max 322 CYPs.Citation13–16 However, the functions of most CYPs are still uncertain. For instance, 30% of CYPs genes are well characterized in Arabidopsis.Citation17 CYPs play a pivotal role in lipid biosynthesis, fungal mycotoxins, and flavonoid biosynthesis.Citation18,Citation19 A legume-specific CYP 93 C (CYP93C) is a key enzyme of isoflavonoid biosynthesis pathway.Citation20 Several cytochromes such as CYP93B/E/G play critical roles as plant secondary metabolites like triterpenoid saponin and flavone biosynthesis.Citation21,Citation22 Similarly, CYPs have already been reported in plant organs such as germinating seed, stem, apical bud, and tulip bulbs.Citation23–25
5-methylcytosine DNA methylation (5mC) is the most common epigenetic modifier and regulator of their targeted genes. In plants, 5mC and histone modification played vital roles in regulating a variety of physiological processes such as gene expression, genome stability, regulating parental imprinting, and in-plant response to abiotic or biotic stresses.Citation1,Citation26–29 However, the global DNA hypomethylation or hypermethylation was also estimated, but their exact mechanism remains unclear.Citation30–32 Rice (O. sativa L.) is a staple food crop that feeds half the world’s population and is an ideal model plant owing to high sensitivity to salinity and drought, particularly at critical growth stages such as pollen development and seedling stage.Citation33,Citation34 Rice plants can cope with environmental hazards by modulating various physiological and biochemical processes. These changes include the changes in enzymatic activities and expression level of different stress-responsive genes involved in salinity, drought, hypoxia, and temperature tolerance.Citation35 However, the functional characterization of these genes on behalf of DNA methylation yet needs to be explored.
Previously, we reported the dynamic role of DNA methylationCitation36 in regulating stress-responsive zinc-finger protein (ZFP) in rice and found that these genes have a varying degree of methylation.Citation37 Wei et al.Citation38 reported that the genome-scale identification of CYPs, but their role in rice DNA methylation regulation is still scarce. To avail this opportunity, we identified a total of 14 DNA methylation regulated CYPs in rice. It was observed that these genes are full or partially methylated in different regions and have the potential to tolerate abiotic stresses such as salt, drought, cold, and phytohormones in rice.
Materials and Methods
In-silico Identification of CYPs in Rice
5-methylcytosine DNA methylation (5mC) level of CYPs in rice genome was qualified as described in Ahmad et al.Citation37 For domain presence, NCBI CDD (https://www.ncbi.nlm.nih.gov/Structure/bwrpsb/bwrpsb.cgi) and SMART database (http://smart.embl-heidelberg.de) were used to validate P450 domain.Citation39 Genome organization and chromosome location information of CYPs were retrieved from the Rice Genome Database of China (http://btn.genomics.org.cn/rice) and Rice Genome Project (RGP, http://rgp.dna.affrc.go.jp). Protein characteristics feature such as molecular weight (MW) and pI (isoelectric point) were assessed in Sequence Manipulation Suite (SMS V2, http://www.bioinformatics.org/sms2/index.html); in-silico subcellular location prediction was analyzed using WOLFPSORT (https://wolfpsort.hgc.jp/), and MapDrawCitation40 was used to display each gene on the chromosome. The structure of CYP genes was visualized in the gene structure display server (GSDS, http://gsds.gao-lab.org/index.php). For cis-regulatory elements prediction, 1000 bp promoter sequences of each gene from the transcription start site were retrieved from RGP and analyzed in NEW PLACE (https://www.dna.affrc.go.jp/PLACE/?action=newplace).
Phylogeny of CYPs in Rice and Arabidopsis
The phylogenetic relationships among the rice and Arabidopsis CYPs were analyzed in MEGA7 to generate an unrooted neighbor-joining (NJ) phylogenetic tree described by Wei et al.,Citation38 Arabidopsis CYP protein sequences were retrieved from TAIR (http://www.arabidopsis.org/index.jsp) and aligned in ClustalOmega (https://www.ebi.ac.uk/Tools/msa/clustalo/) and finally submitted in MEGA7.Citation41 The bootstrap was set at 1000 replicates.
Plant Growth Conditions and Material Collection
The surface-sterilized seeds of Japonica rice (O. sativa cv. Zhonghua11) were grown under conditions described in Ahmad et al.Citation37 The fresh samples of different plant parts, such as stem, root, leaf, node, and panicle, were harvested. For expression analysis of CYPs under various stresses, such as drought, salinity, and phytohormones, including indole-3-acetic acid (IAA), abscisic acid (ABA), and gibberellin (GA), two-week-old rice seedlings were used following as described in Ahmad et al.Citation37 Samples were collected at 0 h, 1 h, 3 h, 6 h, 12 h, and 24 h after post-treatments.
cDNA Synthesis and Quantitative Real-time PCR (Qrt-PCR) Assay
Trizol reagent (Invitrogen, USA) was used for total RNA extraction from harvested samples following the manufacturer’s guidelines. DNase1 (Takara, Japan) was used to remove genomic DNA contamination from samples. RNA was further purified by precipitating the digested DNA. About 2 μg of total RNA was used for cDNA synthesis in the RT-PCR system (Promega, USA) following the manufacturer’s instructions. To perform qRT-PCR of selected genes, SYBR Green Master Mix (Toyobo, Japan) was used in ABI-7500 Fast Real-Time PCR (Applied Biosystems, USA). QuantPrime toolCitation42 was used to design gene-specific primers (Table S1). However, 18s-rRNA was used to normalized gene expression. The expression was estimated by adopting ∆Ct method as described in Jain et al.Citation43
Statistical Analysis
GraphPad prism was used for statistical analysis. Three biological replicates for each sample were used for RT-qPCR analysis and five technical replicates were analyzed for each biological replicate. To determine significant differences two-tailed Student’s t-tests was used at P values (*P < .05; ** P < .01; *** P < .001; **** P < .0001).
Results
Identification and Characterization of Methylation Regulated Candidate CYP Genes
We adopted various bioinformatics approaches to search OsCYP of the grapevine genome, including BLAST and the hidden Markov model (HMM) profile method. A total of 384 CYP genes, including those 355 CYP genes previously identified by Wei et al.,Citation38 were detected and subsequently verified for the P450 domain (PF00067). Among them, 14 potential CYPs showed varying methylation levels were identified through methylated DNA immunoprecipitation (MeDIP)-chip hybridization in rice under salt and osmotic stress. The protein length of methylation regulated OsCYPs ranging from 106 aa (LOC_Os09g26950) to 551 aa (LOC_Os08g43390). shows the additional information about OsCYPs including their peptide length, pI, MW, in-silico subcellular location, and genome distribution. According to gene mapping, 14 OsCYPs were anchored on six chromosomes in the rice genome (). Chromosomes 1 and 6 anchored four genes each, three on chromosome 2, and a single gene was found on chromosomes 7, 8, and 9. Moreover, the number of exons varies from one to nine among 14 methylations regulated OsCYPs. For example, the single exon is found in LOC_Os09g26950 and LOC_Os02g12680. However, LOC_Os07g29960 and LOC_Os01g43740 displayed nine and five exons each whereas, the rest of the genes contained two exons except for LOC_Os02g17760, which contained three (Figure S1).
Table 1. Characteristics of OsCYPs proteins in rice under
Figure 1. Chromosomal distribution of rice OsCYPs in the rice genome. The scale on the right side is corresponding to the length of each chromosome.
Phylogenetic and Motif Analysis of Rice CYPs
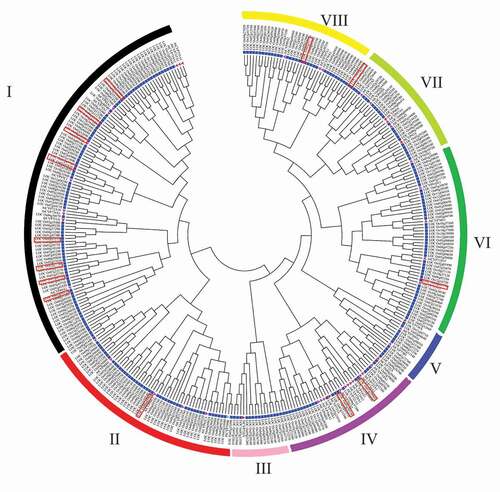
To determine the phylogenetic relationship of OsCYP genes with CYPs from Arabidopsis, Solanum tuberosum, and P. trichocarpa, an unrooted NJ phylogenetic tree was generating. All CYPs were clustered in 9 clades () and rice methylation regulated CYPs grouped in 6 different clans in the phylogenetic tree along with other OsCYPs (). Eight OsCYPs were clustered in Group-I, followed by two OsCYPS in cluster IV. Moreover, group II, VI, VII, and VIII contained a single rice protein. MEME motifs analysis revealed five unique motifs in 12 OsCYPs but absent in LOC_Os01g50520 and LOC_Os09g26950, while LOC_Os01g43720 contained three motifs only. LOC_Os02g12680 and LOC_Os01g43740 contained motif 2/4 and motif 1/3/4, respectively. LOC_Os07g29960, LOC_Os06g43440, LOC_Os06g42610, and LOC_Os01g50530 showed motif 1/2/3/4 in their protein sequences. The rest of the OsCYPs contained all motifs in their peptides (Figure S2).
Figure 2. Phylogeny of CYPs in different plant species. An unrooted phylogenetic tree was generated with 1,000 bootstrap replicates and a p-distance method in the MEGA7 program using protein-coding sequences of CYPs from Arabidopsis, Solanum tuberosum, and Populus trichocarpa.
DNA Methylation Status and Correlation Analysis of Candidate CYPs in Rice
By analyzing microarray data in three different conditions, 14 unique P450 genes exhibiting co-ordinately change in DNA methylation and expression were identified. To analyze whether the genes significantly affected epigenetically (>2-fold changes in methylation and expression) or not, a variable trend of methylation under two comparative conditions (control vs. stressed) was assayed. Here, an average normalized depth of reads as the measurement of methylation level for each gene was used. To quantify methylation level in control, salt, and osmotically stressed samples, we used MEDIPS software package.Citation44 To quantify DNA methylation in genes, all the CYPs were divided into different basic genic regions like a promoter, gene body, 5′ UTR, 3′ UTR, and downstream. Genome-scale peak scanning (unique peaks) for methylation was based on behalf of a defined analysis model (MACS), and the peak standard was fixed on behalf of P-value (p < 10e-5). Peaks of two samples (control vs. stressed) were merged as candidate different methylation regions (DMRs). Genomic regions with at least three consecutive windows statistically significant differentially methylated samples were considered differentially methylated regions (DMRs).
Overall, we observed a wide range of methylation differences in CYPs under two comparative conditions, and the other was predicted in the promoters of the basic region of methylation, and out of 14 genes, nine were methylated in the promoter region. After promoter, downstream and gene body (CDS) were highly methylated regions among CYPs. Different quantities and varying levels of methylation in different regions represent the patterns of methylation, and the changed level of methylation might be the cause for their up/downregulation. Among CYPs genes, we also observed the enrichment of methylation in different genes under two different stresses (control vs. salt or PEG6000 stress). LOC_Os02g12680 showed the methylation quantity in upstream 2 K and downstream 2 K region and showed down-regulation under both stresses. Similarly, LOC_Os06g42610 showed the enrichment of methylation in downstream 2 K, CDS, and intron regions and downregulated under salt and osmotic stresses. Another gene, LOC_Os09g26950, was methylated in upstream 2 K and CDs regions.
Two different natures of stresses cause different changes epigenetically in the rice genome through the up/downregulation of genes. For example, the gene LOC_Os08g43390 showed its maximum DNA methylation 530 under salt stress compared to osmotic stress, where its methylation quantity was 444. Similarly, another gene, LOC_Os06g42610, showed 1125 quantities of methylation under salt stress and 1052 under osmotic stress, while its level of methylation was only 457 under control for downregulation. Another CYP gene (LOC_Os02g12680) was less methylated (98) under osmotic stress compared to salt stress (119). The detailed information of CYP genes about their methylation status and correlation under two comparative conditions is given in and .
Table 2. Methylation (5mC) status of identified P450s under salt and osmotic stresses in rice
Figure 3. Correlation analysis between DNA methylation and genes (CYPs) expression (a) correlation under salt stress (b) correlation between DNA methylation and gene expression under osmotic stress. The X-axis indicates the level of methylation, while Y-axis is the gene’s expression. Each point in the graph represents a specific gene of P450.
Expression Analysis of OsCYPs in Different Parts/organs of the Rice Plant
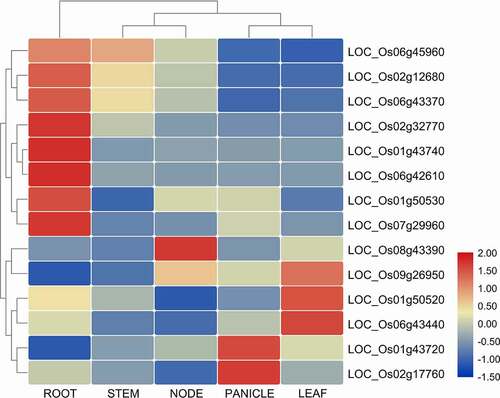
The specific expression pattern of methylation-regulated OsCYPs was analyzed by qRT-PCR in different plant parts including, stem, root, node, panicle, and leaf. It was observed that OsCYPs are highly specific in their expression pattern () which support the idea of tissue-specific epigenetic changes and the regulation of different CYPs under abiotic stresses. LOC_Os06g45960, LOC_Os02g12680, LOC_Os06g43370, LOC_Os02g32770, LOC_Os01g43740, LOC_Os06g42610, LOC_Os01g50530, and LOC_Os07g299660 were highly expressed in root than other tissues. LOC_Os08g43390 expression peaked in nodes, while LOC_Os09g26950 have a weak expression in node but showed strong leaf expression. Similarly, LOC_Os01g50520 and LOC_Os06g43440 peaked in leaf, but the former has a weak expression in root. LOC_Os02g17760 and LOC_Os01g43720 were highly expressed in a panicle ().
Figure 4. Heatmap of tissue-specific expression of CYPs in different parts of the rice plant, including root, stem, leaf, panicles, and node. All the values are logCitation2 transformed. The red and blue color is corresponding to high and low expressions.
OsCYPs Promoter Characteristic Features
Furthermore, for the distribution of cis-acting elements, OsCYP genes promoter sequences were analyzed. The promoter regions of OsCYPs contain a variety of cis-acting elements such as those for abiotic stress include, ABRE (for abscisic acid responsiveness), TGACG-motif (for MeJA responsiveness), ERE (Ethylene responsive), LTR (for low-temperature responsiveness), TATC/GARE (gibberellin-responsive), TCA-Element (for salicylic acid-responsiveness), MBS (drought-inducibility), TGA-Element (Auxin responsive), and AuxRR-Core (auxin responsiveness) (Table S2).
Phytohormone Induced Expression Patterns of OsCYPs
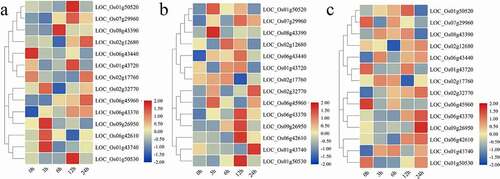
Numerous cis-regulatory sequences related to hormone stresses were identified in promoter sequences of OsCYPs (Table S2). Thus, we examined the phytohormones-induced expression profile of these genes in the rice plant, including root and shoot (). The hormone-induced expression profile analysis revealed that few methylation-regulated rice CYPs genes were highly sensitive, while some of them were insensitive. LOC_Os06g43370, LOC_Os06g45960, LOC_Os07g29960, and LOC_Os08g43390 showed temporal expression at all time intervals. It was found that the promoters of these genes had cis-regulatory elements related to ABA response (ABRE) (Table S2). LOC_Os01g43740, LOC_Os02g32770, LOC_Os09g26950, and LOC_Os06g42610 showed peaked expression at three hours. However, LOC_Os08g43390 at six h; LOC_Os01g43720 and LOC_Os01g50520 at 12 h; LOC_Os02g17760 at 24 h were upregulated (). For IAA treatment, LOC_Os01g50520, LOC_Os08g43390, and LOC_Os06g45960 were upregulated at three hours but downregulated during later time intervals. LOC_Os01g50530, LOC_Os06g43370, LOC_Os07g29960, LOC_Os09g26950, and LOC_Os06g42610 peaked at 12 h after IAA exposure. Similarly, LOC_Os01g43740 and LOC_Os02g32770 were upregulated at 24 h after treatment (). Similarly, we observe that only of these genes’ promoter contained cis-regulatory elements related to IAA among IAA-activated genes. These genes include LOC_Os02g32770 LOC_Os06g42610, LOC_Os06g45960, LOC_Os07g29960, and LOC_Os08g43390 (Table S2). For GA treatment, LOC_Os01g43720, LOC_Os07g29960, and LOC_Os06g45960 were downregulated after treatment. LOC_Os01g43740, LOC_Os08g43390, LOC_Os01g50520, and LOC_Os02g32770 were upregulated all time intervals except for LOC_Os08g43390 and LOC_Os01g50520, which was downregulated at 24 h after treatment. It is worth mentioning that only the promoter of LOC_Os01g50520 contained gibberellin-responsive elements (Table S2), suggesting that other regulatory genes may interact with these CYPs to activate their response to GA. However, LOC_Os06g42610 and LOC_Os09g26950 peaked at 24 h intervals (). It is interesting to note that few genes were upregulated under all stresses while others induced under one of three stresses such as LOC_Os02g32770, LOC_Os06g42610, LOC_Os06g4337, and LOC_Os08g43390 was induced under all stresses whereas LOC_Os01g43720 was induced under IAA, but LOC_Os01g43740 was suppressed. The phytohormones-induced expression of OsCYPs suggested that these stresses might regulate their expression pattern.
Figure 5. Heatmap of expression patterns of 14 OsCYPs under (a) abscisic acid (ABA), (b) indole-3-acetic acid (IAA), and (c) gibberellins (GA3) at 0 h, 3 h, 6 h, 12 h, and 24 h after treatment. The expression was determined relative to expression at 0 h. The red and blue color is corresponding to high and low expressions. All the values are log2 transformed.
Expression Analysis of Rice Methylation Regulated CYPs Genes under Salt and PEG Stresses
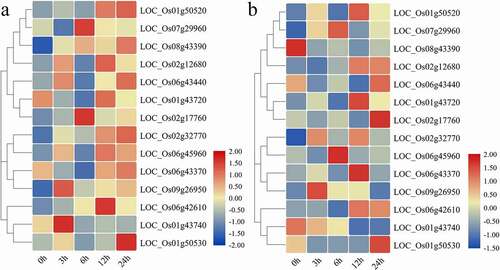
To study the transcriptional regulation of OsCYPs under salinity and drought, we also analyzed the cis-acting elements in the promoters of CYPs. It was predicted that CYP genes contain cis-acting motifs such as temperature (LTR), drought (MBS), light (G-Box), and the pathogens may respond to abiotic stresses (Table S2). To understand the salinity and drought-induced expression profile of OsCYPs, the expression of 14 methylation-regulated genes was profiled. It was observed that LOC_Os01g43740 and LOC_Os09g26950 induced at 3 h; LOC_Os02g17760 and LOC_Os07g29960 at 6 h; LOC_Os06g42610 at 12 h; LOC_Os01g50530 at 24 h under salt stress. LOC_Os01g50520, LOC_Os02g32770, and LOC_Os08g43390 were upregulated at all time intervals and showed peaked expression at 24 h after stress (). For drought, LOC_Os01g43740 and LOC_Os08g43390 were downregulated, but LOC_Os01g50530 and LOC_Os02g17760 peaked at 24 h. LOC_Os02g32770 and LOC_Os09g26950 upregulated at 3 h; however, LOC_Os07g29960 was peaked at 6 h; LOC_Os01g50520 and LOC_Os06g43370 at 12 h; LOC_Os02g17760 was significantly peaked at 24 h (). Overall, some genes were upregulated or downregulated under both stresses, while few showed opposite trends. LOC_Os01g43720 and LOC_Os06g45960 were downregulated under salinity, and LOC_Os02g17760, LOC_Os06g42610, LOC_Os06g43370, and LOC_Os06g45960 were suppressed under drought. LOC_Os01g50530, LOC_Os06g43440, and LOC_Os06g43370 were downregulated under both stresses.
Figure 6. Heatmap of expression patterns of 14 OsCYPs under (a) salinity (b) Drought stresses at 0 h, 3 h, 6 h, 12 h, and 24 h after treatment. All the values are log2 transformed. The expression was determined relative to expression at 0 h. The red and blue color is corresponding to high and low expressions.
Discussion
DNA methylation (5mC) plays a dynamic role in regulating plant development, helping plant adaptation to environmental changes.Citation45–47 The mechanism by which DNA-methylation participates in these complex processes and mechanism is still unclear. The salinity and drought demethylate their responsive transcription factors, such as WRKY, NAC, TCP, and ARF, have been reported as key transcriptional regulators under stress conditions on behalf of DNA-methylation.Citation48–50 Nicotiana tabacum DNA-methyltransferase 1 (met1) mutant removes methyl-group from various genomics regions, activating stress-responsive genes.Citation51 However, the general mechanism of DNA-methylation associated with these stress-responsive genes remains unknown. Genome-scale DNA-methylation analysis was performed in various organisms from insects, chordates, animals to plants.Citation52,Citation53 This revealed that it might be considered as the highlighted feature of all eukaryotes.Citation54
Rice is an important cereal crop worldwide, and a facile genomic model provides an opportunity to study the molecular biology of cereal plants. Rice DNA-methylation is of great interest to geneticists, biotechnologists, and breeders. We observed a significant enrichment of upregulated and downregulated genes associated with DNA-methylation or demethylation in rice. It was also analyzed that a large fraction of DEGs (differentially expressed genes) did not exhibit a significant difference in their methylation level (). Different researchers reported similar findings describing the role of DNA-methylation in transcriptional regulation of specific loci in different crops.Citation51,Citation55,Citation56 Genome analysis of these genes indicated that DNA-methylation plays a pivotal role in regulating hormone-specific CYP genes. A strong correlation of gene promotor and body methylation/demethylation for genes up/downregulation compared to any other flanking sequence is an essential feature of stress-responsive genes like CYPs to support the plant the adaptation of environmental stress like salt and drought. These findings are consistent with previous reports, including rice.Citation6,Citation48,Citation57,Citation58
In the current study, the DNA-methylation in CYPs is estimated for the first time through genome analysis. Changes in the DNA-methylation level of CYPs and other related regulatory genes are the key to future crop breeding programs. Rice, being a salt-sensitive cereal crop, displayed high genotypic variability.Citation59,Citation60 These genotypes can tolerate extreme salinity, while few are highly sensitive. These are indicating that the unique rice genetics and regulatory mechanism are essential for further improvement. This study identified a unique array of genes, including stress tolerance, chromatin modification, retrotransposons, and hormone responsive. It suggests that the evolution of natural variability in rice germplasm for stress tolerance might be independent of the patterns or extent of DNA-methylation. Wang et al.Citation47 unveiled that DNA-methylation variation exhibited tissue specificity and caused significant differential gene expression. In tissues-specific expression analysis, we also find a diverse and variable expression of P450 genes in rice tissues that all genes are constitutively expressed (). Finally, to demonstrate transcription regulation, the cis-acting sequences analysis revealed that OsCYP genes respond to various abiotic stresses such as abscisic acid, MeJA, and ethylene low-temperature, gibberellin, salicylic acid, drought, auxin (Table S2).
Conclusion
Conclusively, a dynamic correlation was observed between DNA methylation and CYP genes’ expression under abiotic stresses by high throughput analysis. Varying level of DNA-methylation was observed in different regions of concerned genes under two comparative conditions. This may show their regulatory role in rice plants against these stresses and predicts the epigenetic role of DNA-methylation in gene suppression or activation. This study provides the foundation to explore the enzymatic activity of CYPs and find out the impact of DNA-methylation in gene stress adaptation mechanisms for rice and other related crops to improve growth and yield as well.
Author’s Contribution
MW, FA, and FH designed and performed the whole experiments. FA and MW prepared material and performed RT-qPCR, and finally analysed results. MW, MMA, and FA performed all bioinformatics analyses. FA prepared libraries for MeDIP-Chip seq. FA, MW, LY, and MMA draft the manuscript, and XY, YQ, YK, UA, WH revised the manuscript. All the authors have read and approved the final manuscript.
Declaration of Competing Interest
No potential conflicts of interest were disclosed.
Supplemental Material
Download MS Word (299.6 KB)Acknowledgments
Yunnan Provincial Science and Technology Department: 2017FH001-005, 2019FH001 (−051), 2018HB100, 2018BB011, Teacher Project of Yunnan Education Department: 2019J0574, Science, Technology Plan Project of Yunnan Provincial Tobacco Company: 2018530000241020, 2018530000241016, 2019530000241011, 2019530000241028 and Science and Technology Project of Yunnan Provincial Education Department: 2021J0716.
Supplementary Material
Supplemental data for this article can be accessed on the publisher’s website.
Additional information
Funding
References
- Ahmad F, Huang X, Lan H, Huma T, Bao Y, Huang J, Zhang HS. Comprehensive gene expression analysis of the DNA (cytosine-5) methyltransferase family in rice (Oryza sativa L.). Genet Mol Res. 2014;13(3):5159–72. doi:https://doi.org/10.4238/2014.July.7.9.
- Lobell DB, Roberts MJ, Schlenker W, Braun N, Little BB, Rejesus RM, Hammer GL. Greater sensitivity to drought accompanies maize yield increase in the. U S Midwest Science (New York, NY). 2014;344:516–19. doi:https://doi.org/10.1126/science.1251423.
- Urano K, Kurihara Y, Seki M, Shinozaki K. ‘Omics’ analyses of regulatory networks in plant abiotic stress responses. Curr Opin Plant Biol. 2010;13:132–38. doi:https://doi.org/10.1016/j.pbi.2009.12.006.
- Danielson P. The cytochrome P450 superfamily: biochemistry, evolution and drug metabolism in humans. Curr Drug Metab. 2002;3:561–97. doi:https://doi.org/10.2174/1389200023337054.
- Capdevila JH, Falck JR, Estabrook RW. Cytochrome P450 and the arachidonate cascade. Faseb J. 1992;6:731–36. doi:https://doi.org/10.1096/fasebj.6.2.1537463.
- Hohn T, Corsten S, Rieke S, Müller M, Rothnie H. Methylation of coding region alone inhibits gene expression in plant protoplasts. Proc Nat Acad Sci. 1996;93:8334–39. doi:https://doi.org/10.1073/pnas.93.16.8334.
- Schuler E, Lee C, Vik D. Method and system to control gastrointestinal function by means of neuro-electrical coded signals. Google Patents. 2006.
- Wrighton SA, Stevens JC. The Human Hepatic Cytochromes P450 Involved in Drug Metabolism. Crit Rev Toxicol. 1992;22:1–21. doi:https://doi.org/10.3109/10408449209145319.
- Ralston L, Yu O. Metabolons involving plant cytochrome P450s. Phytochem Rev. 2006;5:459. doi:https://doi.org/10.1007/s11101-006-9014-4.
- Du H, Ran F, Dong H-L, Wen J, Li J-N, Liang Z, Wu K. Genome-wide analysis, classification, evolution, and expression analysis of the cytochrome P450 93 family in land plants. PloS One. 2016;11(10):e0165020. doi:https://doi.org/10.1371/journal.pone.0165020.
- Nebert DW, Gonzalez FJ. P450 genes: structure, evolution, and regulation. Annu Rev Biochem. 1987;56:945–93. doi:https://doi.org/10.1146/annurev.bi.56.070187.004501.
- Nelson DR, Kamataki T, Waxman DJ, Guengerich FP, Estabrook RW, Feyereisen R, Gonzalez FJ, Coon MJ, Gunsalus IC, Gotoh O, et al. The P450 superfamily: update on new sequences, gene mapping, accession numbers, early trivial names of enzymes, and nomenclature. DNA Cell Biol. 1993;12:1–51. doi:https://doi.org/10.1089/dna.1993.12.1.
- Bak S, Beisson F, Bishop G, Hamberger B, Höfer R, Paquette S, Werck-Reichhart D. Cytochromes p450. Arabidopsis Book. 2011;9:e0144–e. doi:https://doi.org/10.1199/tab.0144.
- Nelson DR, Ming R, Alam M, Schuler MA. Comparison of cytochrome P450 genes from six plant genomes. Trop Plant Biol. 2008;1:216–35. doi:https://doi.org/10.1007/s12042-008-9022-1.
- Nelson DR, Schuler MA. Cytochrome P450 genes from the sacred lotus genome. Trop Plant Biol. 2013;6:138–51. doi:https://doi.org/10.1007/s12042-013-9119-z.
- Xu W, Bak S, Decker A, Paquette SM, Feyereisen R, Galbraith DW. Microarray-based analysis of gene expression in very large gene families: the cytochrome P450 gene superfamily of Arabidopsis thaliana. Gene. 2001;272:61–74. doi:https://doi.org/10.1016/S0378-1119(01)00516-9.
- Mizutani M, Ohta D. Diversification of P450 genes during land plant evolution. Annu Rev Plant Biol. 2010;61:291–315. doi:https://doi.org/10.1146/annurev-arplant-042809-112305.
- Du H, Huang Y, Tang Y. Genetic and metabolic engineering of isoflavonoid biosynthesis. Appl Microbiol Biotechnol. 2010;86:1293–312. doi:https://doi.org/10.1007/s00253-010-2512-8.
- Van Den Brink HM, Van Gorcom RF, Van Den Hondel CA, Punt PJ. Cytochrome P450 enzyme systems in fungi. Fungal Genetics Biol. 1998;23:1–17. doi:https://doi.org/10.1006/fgbi.1997.1021.
- Waki T, Yoo D, Fujino N, Mameda R, Denessiouk K, Yamashita S, Motohashi R, Akashi T, Aoki T, Ayabe S, et al. Identification of protein–protein interactions of isoflavonoid biosynthetic enzymes with 2-hydroxyisoflavanone synthase in soybean (Glycine max (L.) Merr.). Biochem Biophys Res Commun. 2016;469:546–551. doi:https://doi.org/10.1016/j.bbrc.2015.12.038.
- Moses T, Thevelein JM, Goossens A, Pollier J. Comparative analysis of CYP93E proteins for improved microbial synthesis of plant triterpenoids. Phytochemistry. 2014;108:47–56. doi:https://doi.org/10.1016/j.phytochem.2014.10.002.
- Lam PY, Zhu F-Y, Chan WL, Liu H, Cytochrome LC. P450 93G1 is a flavone synthase II that channels flavanones to the biosynthesis of tricin O-linked conjugates in rice. Plant Physiol. 2014;165:1315–27. doi:https://doi.org/10.1104/pp.114.239723.
- Benveniste I, Salaün J-P, Durst F. Phytochrome-mediated regulation of a monooxygenase hydroxylating cinnamic acid in etiolated pea seedlings. Phytochemistry. 1978;17:359–63. doi:https://doi.org/10.1016/S0031-9422(00)89316-4.
- Rich PR, Bendall DS. Cytochrome Components of Plant Microsomes. Eur J Biochem. 1975;55:333–41. doi:https://doi.org/10.1111/j.1432-1033.1975.tb02167.x.
- Young O, Beevers H. Mixed function oxidases from germinating castor bean endosperm. Phytochemistry. 1976;15:379–85. doi:https://doi.org/10.1016/S0031-9422(00)86827-2.
- Feng R, Wei C, Tu S. The roles of selenium in protecting plants against abiotic stresses. Environ Exp Bot. 2013;87:58–68. doi:https://doi.org/10.1016/j.envexpbot.2012.09.002.
- Kim J-M, Sasaki T, Ueda M, Sako K, Seki M. Chromatin changes in response to drought, salinity, heat, and cold stresses in plants. Front Plant Sci. 2015;6:114. doi:https://doi.org/10.3389/fpls.2015.00114.
- Luo M, Wang -Y-Y, Liu X, Yang S, Lu Q, Cui Y, Wu K. HD2C interacts with HDA6 and is involved in ABA and salt stress response in Arabidopsis. J Exp Bot. 2012;63:3297–306. doi:https://doi.org/10.1093/jxb/ers059.
- Xu J, Tian Y-S, Peng R-H, Xiong A-S, Zhu B, Jin X-F, Gao F, Fu X-Y, Hou X-L, Yao Q-H, et al. AtCPK6, a functionally redundant and positive regulator involved in salt/drought stress tolerance in Arabidopsis. Planta. 2010;231:1251–60. doi:https://doi.org/10.1007/s00425-010-1122-0.
- Boyko A, Blevins T, Yao Y, Golubov A, Bilichak A, Ilnytskyy Y, Hollander J, Meins F, Kovalchuk I. Transgenerational Adaptation of Arabidopsis to Stress Requires DNA Methylation and the Function of Dicer-Like Proteins. PLoS One. 2010;5:e9514. doi:https://doi.org/10.1371/journal.pone.0009514.
- Karan R, DeLeon T, Biradar H, Subudhi PK, Wu K. Salt Stress Induced Variation in DNA Methylation Pattern and Its Influence on Gene Expression in Contrasting Rice Genotypes. PLoS One. 2012;7:e40203. doi:https://doi.org/10.1371/journal.pone.0040203.
- Liang D, Zhang Z, Wu H, Huang C, Shuai P, Ye C-Y, Tang S, Wang Y, Yang L, Wang J, et al. Single-base-resolution methylomes of Populus trichocarpa reveal the association between DNA methylation and drought stress. BMC Genet. 2014;15(Suppl 1):S9. doi:https://doi.org/10.1186/1471-2156-15-S1-S9.
- Parihar P, Singh S, Singh R, Singh VP, Prasad SM. Effect of salinity stress on plants and its tolerance strategies: a review. Environ Sci Pollut Res Int. 2015;22:4056–75. doi:https://doi.org/10.1007/s11356-014-3739-1.
- Souri Z, Karimi N, Sandalio LM. Arsenic Hyperaccumulation Strategies: an Overview. Front Cell Develop Biol. 2017;5:67. doi:https://doi.org/10.3389/fcell.2017.00067.
- Tang J, Wang F, Wang Z, Huang Z, Xiong A, Hou X. Characterization and co-expression analysis of WRKY orthologs involved in responses to multiple abiotic stresses in Pak-choi (Brassica campestris ssp. chinensis). BMC Plant Biol. 2013;13:188. doi:https://doi.org/10.1186/1471-2229-13-188.
- Huang J, Wang -M-M, Jiang Y, Bao Y-M, Huang X, Sun H, Xu D-Q, Lan H-X, Zhang H-S. Expression analysis of rice A20/AN1-type zinc finger genes and characterization of ZFP177 that contributes to temperature stress tolerance. Gene. 2008;420:135–44. doi:https://doi.org/10.1016/j.gene.2008.05.019.
- Ahmad F, Farman K, Waseem M, Rana RM, Nawaz MA, Rehman HM, Abbas T, Baloch FS, Akrem A, Huang J, et al. Genome-wide identification, classification, expression profiling and DNA methylation (5mC) analysis of stress-responsive ZFP transcription factors in rice (Oryza sativa L.). Gene. 2019;718:144018. doi:https://doi.org/10.1016/j.gene.2019.144018.
- Wei K, Chen H. Global identification, structural analysis and expression characterization of cytochrome P450 monooxygenase superfamily in rice. BMC Genomics. 2018;19:35. doi:https://doi.org/10.1186/s12864-017-4425-8.
- Schultz TP, Nicholas DD. Naturally durable heartwood: evidence for a proposed dual defensive function of the extractives. Phytochemistry. 2000;54:47–52. doi:https://doi.org/10.1016/S0031-9422(99)00622-6.
- Liu RH, Meng JL. [MapDraw: a Microsoft Excel macro for drawing genetic linkage maps based on given genetic linkage data]. Yi Chuan. 2003;25:317–21.
- Tamura K, Peterson D, Peterson N, Stecher G, Nei M, Kumar S. MEGA5: molecular Evolutionary Genetics Analysis Using Maximum Likelihood, Evolutionary Distance, And Maximum Parsimony Methods. Mol Biol Evol. 2011;28:2731–39. doi:https://doi.org/10.1093/molbev/msr121.
- Arvidsson S, Kwasniewski M, Riaño-Pachón DM, Mueller-Roeber B. QuantPrime–a flexible tool for reliable high-throughput primer design for quantitative PCR. BMC Bioinform. 2008;9:465. doi:https://doi.org/10.1186/1471-2105-9-465.
- Jian C, Luukkonen P, Yki-Järvinen H, Salonen A, Korpela K, Vaz-Moreira I. Quantitative PCR provides a simple and accessible method for quantitative microbiota profiling. PLoS One. 2020;15:e0227285. doi:https://doi.org/10.1371/journal.pone.0227285.
- Chavez L, Jozefczuk J, Grimm C, Dietrich J, Timmermann B, Lehrach H, Herwig R, Adjaye J. Computational analysis of genome-wide DNA methylation during the differentiation of human embryonic stem cells along the endodermal lineage. Genome Res. 2010;20:1441–50. doi:https://doi.org/10.1101/gr.110114.110.
- Boyko A, Kovalchuk I. Epigenetic control of plant stress response. Environ Mol Mutagen. 2008;49:61–72. doi:https://doi.org/10.1002/em.20347.
- Mirouze M, Paszkowski J. Epigenetic contribution to stress adaptation in plants. Curr Opin Plant Biol. 2011;14:267–74. doi:https://doi.org/10.1016/j.pbi.2011.03.004.
- Wang W, Huang F, Qin Q, Zhao X, Li Z, Fu B. Comparative analysis of DNA methylation changes in two rice genotypes under salt stress and subsequent recovery. Biochem Biophys Res Commun. 2015;465:790–96. doi:https://doi.org/10.1016/j.bbrc.2015.08.089.
- Choi C-S, Sano H. Abiotic-stress induces demethylation and transcriptional activation of a gene encoding a glycerophosphodiesterase-like protein in tobacco plants. Mol Genetics Genomics. 2007;277:589–600. doi:https://doi.org/10.1007/s00438-007-0209-1.
- Zhang M, Kimatu JN, Xu K, Liu B. DNA cytosine methylation in plant development. J Genetics Genomics. 2010;37:1–12. doi:https://doi.org/10.1016/S1673-8527(09)60020-5.
- Song Y, Ji D, Li S, Wang P, Li Q, Xiang F, Zhang X. The dynamic changes of DNA methylation and histone modifications of salt responsive transcription factor genes in soybean. PloS One. 2012;7:e41274. doi:https://doi.org/10.1371/journal.pone.0041274.
- Wada Y, Miyamoto K, Kusano T, Sano H. Association between up-regulation of stress-responsive genes and hypomethylation of genomic DNA in tobacco plants. Mol Genetics Genomics. 2004;271:658–66. doi:https://doi.org/10.1007/s00438-004-1018-4.
- Klose RJ, Bird AP. Genomic DNA methylation: the mark and its mediators. Trends Biochem Sci. 2006;31:89–97. doi:https://doi.org/10.1016/j.tibs.2005.12.008.
- Suzuki MM, Bird A. DNA methylation landscapes: provocative insights from epigenomics. Nat Rev Genet. 2008;9:465–76. doi:https://doi.org/10.1038/nrg2341.
- Field LM, Lyko F, Mandrioli M, Prantera G. DNA methylation in insects. Insect Mol Biol. 2004;13:109–15. doi:https://doi.org/10.1111/j.0962-1075.2004.00470.x.
- Steward N, Ito M, Yamaguchi Y, Koizumi N, Sano H. Periodic DNA methylation in maize nucleosomes and demethylation by environmental stress. J Biol Chem. 2002;277:37741–46. doi:https://doi.org/10.1074/jbc.M204050200.
- Zilberman D, Gehring M, Tran RK, Ballinger T, Henikoff S. Genome-wide analysis of Arabidopsis thaliana DNA methylation uncovers an interdependence between methylation and transcription. Nat Genet. 2007;39:61. doi:https://doi.org/10.1038/ng1929.
- Dowen RH, Pelizzola M, Schmitz RJ, Lister R, Dowen JM, Nery JR, Dixon JE, Ecker JR. Widespread dynamic DNA methylation in response to biotic stress. Proc Nat Acad Sci. 2012;109:E2183–E91. doi:https://doi.org/10.1073/pnas.1209329109.
- Wu H, Coskun V, Tao J, Xie W, Ge W, Yoshikawa K, Li E, Zhang Y, Sun YE. Dnmt3a-dependent nonpromoter DNA methylation facilitates transcription of neurogenic genes. Science (New York, NY). 2010;329:444–48. doi:https://doi.org/10.1126/science.1190485.
- Cuartero J, Bolarin MC, Asins MJ, Moreno V. Increasing salt tolerance in the tomato. J Exp Bot. 2006;57:1045–58. doi:https://doi.org/10.1093/jxb/erj102.
- Ismail AM, Heuer S, Thomson MJ, Wissuwa M. Genetic and genomic approaches to develop rice germplasm for problem soils. Plant Mol Biol. 2007;65:547–70. doi:https://doi.org/10.1007/s11103-007-9215-2.