
Abstract
Objective: To determine amyotrophic lateral sclerosis (ALS)-associated costs incurred by patients covered by Medicare and/or commercial insurance before, during and after diagnosis and provide cost details. Methods: Costs were calculated from the Medicare Standard Analytical File 5% sample claims data from Parts A and B from 2009, 2010 and 2011 for ALS Medicare patients aged ≥70 years (monthly costs) and ≥65 years (costs associated with disability milestones). Commercial insurance patients aged 18–63 years were selected based on the data provided in the Coordination of Benefits field from Truven MarketScan® in 2008–2010. Results: Monthly costs increased nine months before diagnosis, peaked during the index month (Medicare: $10,398; commercial: $9354) and decreased but remained high post-index. Costs generally shifted from outpatient to inpatient and private nursing after diagnosis; prescriptions and durable medical equipment costs were much higher for commercial patients post-diagnosis. Patients appeared to progress to disability milestones more rapidly as their disease progressed in severity (14.4 months to non-invasive ventilation [NIV] vs. 16.6 months to hospice), and their costs increased accordingly (NIV: $58,973 vs. hospice: $76,179). Conclusions: For newly diagnosed ALS patients in the U.S., medical costs are substantial and increase rapidly and substantially with each disability milestone.
Introduction
Amyotrophic lateral sclerosis (ALS) is a neurodegenerative, progressive motor neuron disease leading to paralysis and death from respiratory failure typically within three to five years of diagnosis (Citation1). No cure exists and the only drug shown to increase survival does so modestly (Citation2). ALS management is primarily supportive (Citation3), increasing with time and requiring greater assistance and intervention leading to escalating cost burden (Citation4–8). Despite this burden, little has been published on costs associated with disease progression in patients with ALS (Citation9).
Most previous studies examining ALS-associated costs were conducted in restricted patient populations and outside of the United States (U.S.). For example, studies examining direct and indirect costs associated with ALS (as defined by each study) have been conducted in Germany (n = 46) (Citation10), Ireland (n = 119) (Citation11), Canada (n = 49) (Citation12) and Greece (n = 33) (Citation13). The Canadian study also calculated personal economic impact (e.g. substantial out-of-pocket expenses) on ALS patients (Citation12). Moreover, cost and ALS disease severity relationships have been studied in Spain (Citation5), the Netherlands (Citation8), the United Kingdom (Citation6), Denmark (Citation14) and Korea (Citation7), and most found that costs increased with disease severity across the course of the disease.
Costs in the U.S. may differ because unlike countries such as Canada, Japan and most European countries that have universal healthcare (Citation12,Citation15–19), the U.S. has many commercial providers that have different contracts with different health-care and medical supplies providers. Moreover, the U.S. also uses joint commercial and government-funded Medicare insurance. Medicare is generally available for U.S. citizens once they turn 65 years of age but is available for individuals upon diagnosis of ALS regardless of age (Citation20) and transitioning to Medicare frequently offers ALS patients access to additional services.
The one U.S. national retrospective cost-of-illness study (n = 1528), estimated total annual costs of ALS using commercial and Medicare claims as $256–433 million (in 2010 dollars) (Citation4). Although the total national cost of ALS calculated (Citation4) is substantially lower than that of Parkinson’s disease – estimated to exceed $14.4 billion (in 2010 dollars) (Citation21) – average annual cost per ALS patient is substantially higher ($63,693 vs. ∼$22,800 in 2010 dollars). This underscores the need to better understand cost accrual during ALS progression, especially in the current health economic market where the Centers for Medicare and Medicaid Services, the Joint Commission and private payers are focussed on cost reduction in the U.S. (Citation9).
The primary objective of this research was to characterise medical costs, as measured by claims data, incurred by ALS patients in the U.S. covered by Medicare and/or by commercial insurance to determine ALS-associated costs before, during and after diagnosis and provide cost details, including by service category. Because patients with commercial insurance may become eligible for Medicare during the course of their disease, this study also sought to examine ALS medical care costs before and after diagnosis under each programme and during the transition between insurances.
Methods
Data sources
Medical costs per patient were calculated using data from the Medicare Standard Analytical File (SAF) 5% sample claims data from Part A and Part B beneficiaries covered in 2009, 2010 and 2011 and from Truven MarketScan®, a proprietary claims database for members of a large (∼40 million commercially insured lives) national insurance plan containing claims and enrolment information during 2008–2010. Information on claims paid and demographics (for longitudinal tracking) and on diagnosis, procedures and drug details using standard coding systems (i.e. ICD-9 diagnosis code 335.20 [ALS] with no claims with diagnosis-related group codes 58, 59, or 60 [multiple sclerosis and cerebellar ataxia]) were obtained. Use of claims from these two sources allowed for comparison of costs on each and during the unique transition from commercial insurance to Medicare that individuals make when diagnosed with ALS in the U.S.
Case selection
ALS patients were identified as having one inpatient claim, one emergency room (ER) visit or two or more physician outpatient claims with ICD-9 diagnosis code 335.20 (ALS) and no claims with diagnosis-related group codes of 58, 59 or 60. As ALS is diagnosed clinically, the chance of misdiagnosis cannot be excluded. However, the requirement of ≥2 encounters with the ALS diagnosis code reduces this chance, and overall diagnostic accuracy of ALS by neurologists is high (>99.9% observed in large, late-stage ALS studies). Cases were considered new if there were no claims coded as related to ALS from the previous year. Analyses were limited to Medicare patients aged ≥70 years to identify ALS patients newly diagnosed while on Medicare and who had Medicare coverage before their diagnosis. To ensure similar numbers of pre- and post-index (i.e. date of ALS diagnosis) cases and that each case had complete insurance claim data during the cost-estimation period, criteria used to identify pre-index and post-index Medicare cases differed slightly. To estimate monthly post-index ALS costs, patients whose index date occurred after 1 January 2009 and whose death occurred before 31 December 2011 were identified, whereas to estimate monthly pre-index costs, patients whose index date occurred after 1 January 2010 were identified because before 2009 exact dates of Medicare claims were not reported and so these data were not available to estimate pre-index monthly costs. To better understand time and costs to disability, the patient cohort was expanded to patients aged ≥65 years.
Commercial insurance patients aged 18–63 years whose index date occurred in 2010 and who were enrolled continuously for at least one year before their index date, were identified to estimate pre-index monthly costs. To study ALS cost allocation by payer, patients were selected based on data provided in the Coordination of Benefits (COB) field in the MarketScan data. Once a patient is eligible for Medicare, the amount paid by Medicare is recorded in the COB field; allowed costs are total COB plus amounts paid by commercial plans and by patients. However, not all data contributors to MarketScan provided detailed data to allow this tabulation. To exclude these cases and cases eligible for Medicare before the index dates, patients for study of cost allocation by payer were selected as follows: 1) having COB in one month or more after index month; 2) not having COB before or in index month; 3) having COB that is always positive; 4) having COB that is always below allowed costs; and 5) having an index date before 1 July 2010.
Disability milestones
Disability milestones were defined according to the Healthcare Common Procedure Coding System (Citation22), a standardised coding system based on the American Medical Association’s Current Procedural Terminology that describes specific items and services provided. The items/services selected as milestones of ALS severity () focussed on clinical outcomes recognised as being correlated with ALS progression (i.e. loss of limb movement and need for respiratory support) (Citation23).
Table 1. Disability milestones as defined by the Healthcare Common Procedure Coding System (Citation22).
Statistical analyses
Demographic information and claims data were summarised descriptively. Average costs from claims submitted for reimbursement were provided by periods relative to index dates and insurance programme: patients whose initial ALS diagnosis occurred while they were covered by Medicare were defined as ‘pure’ Medicare, whereas patients whose initial ALS diagnosis occurred while they were covered by commercial insurance were included with commercial data. To avoid complications from the transition from commercial insurance to Medicare, pure Medicare and commercial data were analysed separately. Monthly average claims costs per patient were tabulated from one year before index date until death or through 2010. Costs before and after the index date were modelled exponentially in a piecewise fashion. Medical costs from index date to disability milestones (defined only by claims) were tabulated from the Medicare database.
Missing insurance claim lifetime data is the major challenge for recently developed analytical approaches for cost data in this study. Kaplan-Meier estimator is used frequently to measure the fraction of patients starting from a defined point to the occurrence of a given event and the length of time that patients remain free of that event, and it allows for situations such as patients not having follow-up data or not reaching disability or death during the study up to 2010. Because of the nature of ALS disease progression and the coverage of the Medicare programme, the two key assumptions for the Kaplan-Meier estimator–(1) patients would experience disability events eventually until they die or these events would be truncated to the end of the follow-up period and (2) the censoring pattern was independent of the disability occurrence time–seemed valid. Therefore, Kaplan-Meier estimator was used.
Kaplan–Meier Sample Average (KMSA) total costs from the index date to a disability milestone was constructed by obtaining the average monthly cost and the corresponding monthly disability-event-free probability of Kaplan-Meier estimator up to the month when the last patient developed that disability. The sum of the products of these two monthly components becomes the KMSA estimator of total cost for that milestone. The estimated cost for later disability milestones, therefore, included the cost for prior milestones.
Results
Demographics
In total, 655 new ALS patients in Medicare were identified. From these, 222 patients aged ≥70 years whose index date occurred after 1 January 2010 were selected to estimate monthly costs before the index date. Also, 217 patients aged ≥70 years and whose index date occurred after 1 January 2009 and who died before 31 December 2011 were selected to estimate monthly post-index costs and time and costs to disability milestones. To expand the disability milestones analysis, the range for patient age was lowered to ≥65 years, identifying 368 ALS patients whose index date occurred after 1 January 2009.
In the commercial database, 891 new ALS patients were identified. From these, 266 patients aged 18–63 years whose index diagnosis occurred in 2010 and who were enrolled for at least one year before their index date were selected to estimate pre-index monthly costs. There were 78 patients who satisfied COB criteria selected to estimate the monthly post-index costs.
Monthly direct costs – pure Medicare patients
Monthly costs increased nine months before the diagnosis was made (), with the highest-cost month being the month of diagnosis (index month) (). Costs were lower in the month following the index month but were still higher after diagnosis than they were pre-diagnosis. Total costs in the months following diagnosis were substantial and increased with longer survival times (). Inpatient facility costs accounted for most costs incurred in the index month and were over $600 higher in the final month of life versus the post-index period. In contrast, costs associated with durable medical equipment (DME) were highest in the months following the index month and were lower in the final month of life (). Private duty nursing/home health costs also increased across the study period.
Figure 1. Monthly costs to diagnosis for the pure Medicare population. Monthly costs were calculated as average monthly costs per patient. Index month (black square); 1–8 months before (grey diamonds); 9 + months before (black triangles).
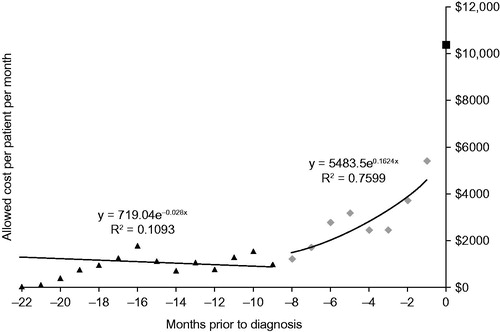
Figure 2. Total allowed costs after index date as a measure of survival time in a pure Medicare population.
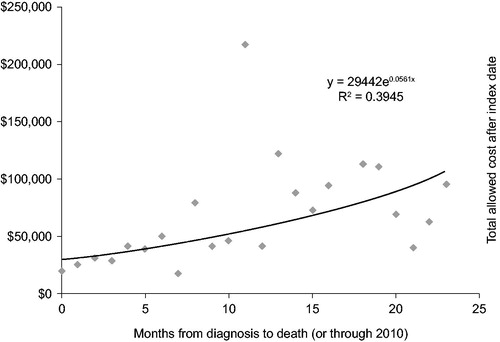
Table 2. Monthly costs per patient associated with ALS in the pure Medicare populationTable Footnote*.
Monthly direct costs – pure commercial patients
Similarly, the highest-cost month for patients with commercial insurance was the index month, with monthly costs increasing during the nine months before the index month (). The average claim paid by commercial insurance in the index month was $9354, $1044 less than the average claims paid by the pure Medicare cases, although this was not statistically significant (). Costs in the month after the index month were lower than those accrued during the index month, but monthly costs increased during the following months. Inpatient costs also accounted for the largest proportion of costs during the index month, and the month in which death occurred was particularly costly. Outpatient and physician costs followed inpatient costs during the index month. Prescription drug costs were more than double for the index month versus previous months and even higher in the months thereafter (). Both DME and private duty nursing/home health costs increased across the study period.
Figure 3. Monthly costs to diagnosis for the pure commercial population. Monthly costs were calculated as average monthly costs per patient. Index month (black square); 1–8 months before (grey diamonds); 9 + months before (black triangles).
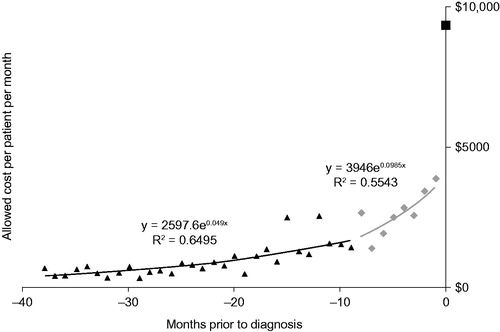
Table 3. Monthly costs per patient associated with ALS in the commercial populationTable Footnote*.
Direct costs during insurance transition and before and after Medicare eligibility
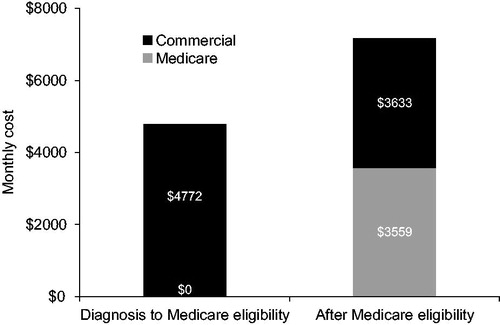
Commercial patients transitioned to Medicare an average of 7.5 months after their initial ALS diagnosis. For the period of nine months and longer before the index month, the monthly cost trend was 5% per month and in the period from eight months to one month before the index month, the monthly cost trend increased to 10% per month. As discussed above, costs were highest during the index month, with an average cost of $9354 (). From the index month forward to the month of Medicare eligibility, the cost averaged $4772/month, regardless of length of this period (see light grey bars in ). Once patients were Medicare eligible, costs increased, averaging $7191/month, regardless of length of this period. Of the $7191, $3559 was paid by Medicare as COB (). This is lower than the cost after the index month by about $1000.
Figure 4. ALS costs during insurance transition. The light grey bars represent costs between coverage stages – for example, after diagnosis and until Medicare eligibility, or after getting eligibility.
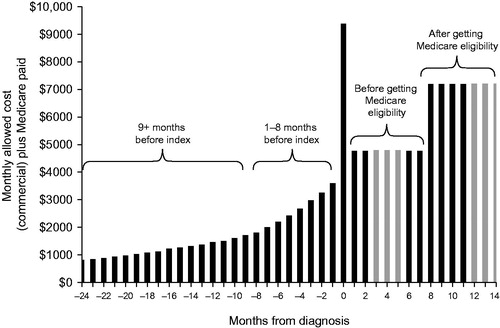
Figure 5. ALS costs before and after Medicare eligibility.
Time and costs to disability milestones – pure Medicare patients
As ALS progressed, the number of months to milestones decreased and costs increased, indicating general increased physical disability (). On average, patients took 10.9 months to progress to wheelchairs and accessories as measured by claims submissions and then progressed through the remaining milestones to hospice just 5.7 months later. Interestingly, time to wheelchairs and accessories was shorter than time to non-invasive (NIV) ventilation. Total costs increased quickly as patients became more severely physically impaired with the largest and the second fastest cost jump occurring from artificial nutrition/NIV to invasive ventilation/speech device. Since KMSA total costs include the cost for prior milestones in the costs of later ones, the estimated cost for invasive ventilation/speech device milestone included the cost for artificial nutrition/NIV. Therefore, it took only an average of 1.7 months from artificial nutrition/NIV to invasive ventilation/speech device, but the estimated total cost increased by $14,636 per patient.
Table 4. Total costs from index date to disability milestones in pure Medicare casesTable Footnote*.
Discussion
This research provided an overview of the burden of ALS in the U.S. by defining an initial estimate of the costs associated with common clinical disability milestones in ALS medical care and estimating the time to various disability milestones based on insurance claim service dates. For both insurance populations, costs increased in the nine months before diagnosis. Costs were highest in the index month, likely because of the claims filed for the visits and tests associated with diagnosis. Inpatient facility costs accounted for most costs during the index month. Private duty nursing/home health costs increased across the study period regardless of insurance type, while outpatient costs generally decreased after diagnosis, demonstrating a shift in cost burden. DME costs were highest following the index month for the pure Medicare population, whereas these costs increased across the study period for the commercial insurance population.
Patients appeared to progress to the disability milestones more rapidly as their disease progressed in severity, and their costs increased accordingly. An analysis of a tertiary referral centre clinical database consisting of 1471 ALS patients seen between 1993 and 2007 estimated that the need for gastrostomy (Stage 4A) and NIV (Stage 4B) occurred at 77% and 80% through the disease course, respectively, supporting the idea that the increase in costs associated with corresponding milestones in this study are directly correlated with disease severity (Citation23).
These U.S. results align with findings of previous studies from other countries, suggesting that increasing cost burden is independent of healthcare system. For example, in Denmark, Jennum et al. (Citation14) also found costs were highest in the index month, sharply rising during the months before diagnosis. Other ex-U.S. studies have found ALS costs increase with disease severity (Citation4–8) and have connected rising costs to characteristics of disease progression such as wheelchairs and ventilators (Citation4,Citation5,Citation8). However, the actual costs associated with ALS and when or how they are distributed across disease progression vary, indicating that the cost of ALS is multifactorial and likely to be dependent on country-specific healthcare policies. In addition, methodology differences such as how disease severity is defined (e.g. whether patients need caregiver assistance (Citation5) vs. involvement of different central nervous system regions (Citation7)) are also important when considering data from different studies. For example, a study using a similar approach and databases (Citation4), calculated different direct medical costs partly because it did not divide costs according to before, during and after diagnosis.
The strengths of this study include its nuanced approach to disease progression, recognising that costs are likely not equally distributed across the three primary time-periods associated with diagnosis. This study determined that nine or more months before diagnosis, average cost increased by 5% monthly, which is annualised to 80%. Assuming 5.8% as the general annual cost trend (health spending growth in the U.S. is projected to average 5.8% for 2015–2025 (Citation24)), and 4% as the annual cost increase attributed to aging for a population in its 50s, the remaining 70.2% was caused by disease progression. This analysis demonstrates that the number of medical claims filed for ALS patients is increasing even before diagnosis, which underscores the need to identify patients earlier in their disease course to help them potentially avoid expensive and invasive tests and therapies.
This study also delineates the services underlying these costs and compares pathways for two different patient populations. Since the average age of ALS onset is 58–60 years (Citation25), understanding the cost-associated patterns of ALS burden at these ages is important. Finally, previous studies have not evaluated the time to, and costs associated with, specific disability milestones. In this study, the average time between artificial nutrition/NIV and between invasive ventilation/speech device was only 1.7 months, but the difference in costs was $14,636, demonstrating that the relationship between time and cost is not necessarily linear. Without a cure (Citation26), therapies are needed to delay the time to these milestones, particularly those associated with an acute increase in burden, and to increase survival.
Limitations of this study include an insufficient number of disability milestones and deaths and limited claim data due to the short follow-up period. Consequently, the mean times to milestones might have been underestimated and the ALS cost profiles required special analysis techniques and assumptions to estimate variance.
Moreover, this analysis only includes Medicare and commercial costs; out-of-pocket costs likely increase economic burden significantly. A case study of a young ALS patient in the U.S. estimated household out-of-pocket expenses as 9% of the total costs associated with the disease ($126,161 over the 10-year duration of the disease) (Citation27). A Canadian study of 50 patients with ALS estimated out-of-pocket expenses to be even higher – 61% of direct costs, amounting to an annual cost of $19,574 (Citation12). Importantly, this study found no association between annual out-of-pocket cost and disease duration, indicating that out-of-pocket costs continue to accumulate over the course of the disease. In addition, the increasingly important roles of risk adjustment (compensating insurers who enrol a greater number of individuals with chronic diseases), re-insurance (redistributing funds from commercial plans to the new individual market to cover unexpected demand) and risk pooling (creating special programmes to provide a safety net for the ‘medically uninsurable’ population) were not assessed in this analysis. Future studies may explore whether delaying time to disability milestones reduces costs, as agents that improve or preserve function in ALS patients are developed.
Conclusions
This study found that for newly diagnosed ALS patients in the U.S., medical costs are substantial. Costs started to increase approximately nine months before diagnosis for both Medicare and commercial cases with the highest costs observed during the index month. Costs post-diagnosis were lower than during the index month but remained higher than pre-diagnosis costs. Medical costs increased rapidly and substantially with each disability milestone as disease progressed, but no trend in costs was observed during the coverage transition to Medicare.
Declaration of interest
LM, AB, SJ and AW are shareholders and full-time employees of Cytokinetics, Inc. JA and JMS are consultants to Cytokinetics, Inc.
Acknowledgements
This analysis was designed and performed by Cytokinetics, Inc. and by Helen Blumen, Kosuke Iwasaki, Bruce Pyenson, on behalf of Milliman, Inc. This work was supported by Cytokinetics, Inc. Cytokinetics, Inc. provided funding for writing and editorial support provided by Deb Stull, on behalf of Evidence Scientific Solutions, Philadelphia, PA, USA.
References
- Vucic S, Rothstein JD, Kiernan MC. Advances in treating amyotrophic lateral sclerosis: insights from pathophysiological studies. Trends Neurosci. 2014;37:433–42.
- Bäumer D, Talbot K, Turner MR. Advances in motor neurone disease. J R Soc Med. 2014;107:14–21.
- Miller RG, Jackson CE, Kasarskis EJ, England JD, Forshew D, Johnston W, et al. Practice parameter update: the care of the patient with amyotrophic lateral sclerosis: drug, nutritional, and respiratory therapies (an evidence-based review): report of the Quality Standards Subcommittee of the American Academy of Neurology. Neurology. 2009;73:1218–26.
- Larkindale J, Yang W, Hogan PF, Simon CJ, Zhang Y, Jain A, et al. Cost of illness for neuromuscular diseases in the United States. Muscle Nerve. 2014;49:431–8.
- López-Bastida J, Perestelo-Pérez L, Montón-Alvarez F, Serrano-Aguilar P, Alfonso-Sanchez JL. Social economic costs and health-related quality of life in patients with amyotrophic lateral sclerosis in Spain. Amyotroph Lateral Scler. 2009;10:237–43.
- Munsat TM, Rivière M, Swash M, Leclerc C. Economic burden of amyotrophic lateral sclerosis in the United Kingdom. J Med Econ. 1998;1:235–45.
- Oh J, An JW, Oh SI, Oh KW, Kim JA, Lee JS, et al. Socioeconomic costs of amyotrophic lateral sclerosis according to staging system. Amyotroph Lateral Scler Frontotemporal Degener. 2015;16:202–8.
- van der Steen I, van den Berg JP, Buskens E, Lindeman E, van den Berg LH. The costs of amyotrophic lateral sclerosis, according to type of care. Amyotroph Lateral Scler. 2009;10:27–34.
- Boylan K, Levine T, Lomen-Hoerth C, Lyon M, Maginnis K, Callas P, et al. Prospective study of cost of care at multidisciplinary ALS centers adhering to American Academy of Neurology (AAN) ALS practice parameters. Amyotroph Lateral Scler Frontotemporal Degener. 2015;17:119–27.
- Schepelmann K, Winter Y, Spottke AE, Claus D, Grothe C, Schröder R, et al. Socioeconomic burden of amyotrophic lateral sclerosis, myasthenia gravis and facioscapulohumeral muscular dystrophy. J Neurol. 2010;257:15–23.
- Connolly S, Heslin C, Mays I, Corr B, Normand C, Hardiman O. Health and social care costs of managing amyotrophic lateral sclerosis (ALS): an Irish perspective. Amyotroph Lateral Scler Frontotemporal Degener. 2015;16:58–62.
- Gladman M, Dharamshi C, Zinman L. Economic burden of amyotrophic lateral sclerosis: a Canadian study of out-of-pocket expenses. Amyotroph Lateral Scler Frontotemporal Degener. 2014;15:426–32.
- Athanasakis K, Kyriopoulos II, Sideris M, Rentzos M, Evdokimidis J, Kyriopoulos J. Investigating the economic burden of ALS in Greece: a cost-of-illness approach. Amyotroph Lateral Scler Frontotemporal Degener. 2015;16:63–4.
- Jennum P, Ibsen R, Pedersen SW, Kjellberg J. Mortality, health, social and economic consequences of amyotrophic lateral sclerosis: a controlled national study. J Neurol. 2013;260:785–93.
- Hatanaka T, Eguchi N, Deguchi M, Yazawa M, Ishii M. Study of global health strategy based on international trends – promoting universal health coverage globally and ensuring the sustainability of Japan’s universal coverage of health insurance system: problems and proposals. Japan Med Assoc J. 2015;58:78–101.
- Kroneman M, Boerma W, van den Berg M, Groenewegen P, de Jong J, van Ginneken E. Netherlands: health system review. Health Syst Transit. 2016;18:1–240.
- Schlitt M. Health care systems in Japan and Germany provide facts, not theories. J Med Assoc Ga. 1993;82:651–5.
- Weil TP. Health management education in Europe and in the United States: a comparative review and analysis. Health Serv Manage Res. 2013;26:76–85.
- Weil TP. What can the Canadians and Americans learn from each other's health care systems? Int J Health Plann Manage. 2016;31:349–70.
- Williams JR, Fitzhenry D, Grant L, Martyn D, Kerr DA. Diagnosis pathway for patients with amyotrophic lateral sclerosis: retrospective analysis of the US Medicare longitudinal claims database. BMC Neurol. 2013;13:160.
- Kowal SL, Dall TM, Chakrabarti R, Storm MV, Jain A. The current and projected economic burden of Parkinson's disease in the United States. Mov Disord. 2013;28:311–18.
- Centers for Medicare & Medicaid Services. Alpha-Numeric HCPSC. 2012. [cited 3 March 2017]; Available from: https://www.cms.gov/Medicare/Coding/HCPCSReleaseCodeSets/Alpha-Numeric-HCPCS.html.
- Roche JC, Rojas-Garcia R, Scott KM, Scotton W, Ellis CE, Burman R, et al. A proposed staging system for amyotrophic lateral sclerosis. Brain. 2012;135:847–52.
- Keehan SP, Poisal JA, Cuckler GA, Sisko AM, Smith SD, Madison AJ, et al. National health expenditure projections, 2015-25: economy, prices, and aging expected to shape spending and enrollment. Health Aff (Millwood). 2016;35:1522–31.
- Talbott EO, Malek AM, Lacomis D. The epidemiology of amyotrophic lateral sclerosis. Handb Clin Neurol. 2016;138:225–38.
- Karceski S, Duran J. Using stem cells to treat ALS. Neurology. 2016;87:e42–4.
- Obermann M, Lyon M. Financial cost of amyotrophic lateral sclerosis: a case study. Amyotroph Lateral Scler Frontotemporal Degener. 2015;16:54–7.