
 ?Mathematical formulae have been encoded as MathML and are displayed in this HTML version using MathJax in order to improve their display. Uncheck the box to turn MathJax off. This feature requires Javascript. Click on a formula to zoom.
Abstract
Aim
To determine the validity of bioelectrical impedance analysis (BIA) in quantifying fat-free mass (FFM) compared to air-displacement plethysmography (ADP) in patients with a motor neurone disease (MND).
Methods
FFM of 140 patients diagnosed with MND was determined by ADP using the BodPod (i.e. the gold standard), and by BIA using the whole-body Bodystat. FFM values were translated to predicted resting energy expenditure (REE); the actual REE was measured using indirect calorimetry, resulting in a metabolic index. Validity of the BIA compared to the ADP was assessed using Bland-Altman analysis and Pearson’s r. To assess the clinical relevance of differences, we evaluated changes in metabolic index and in individualized protein demand.
Results
Despite the high correlation between ADP and BIA (r = 0.93), averaged across patients, the assessed mean fat-free mass was 51.7 kg (± 0.9) using ADP and 54.2 kg (± 1.0) using BIA. Hence, BIA overestimated fat-free mass by 2.5 kg (95% CI 1.8–3.2, p < 0.001). Clinically, an increased metabolic index would be more often underdiagnosed in patients with MND using BIA (31.4% according to BIA versus 44.2% according to ADP, p = 0.048). A clinically relevant overestimation of ≥ 15 g in protein demand was observed for 4 (2.9%) patients using BIA.
Conclusions
BIA systematically overestimates FFM in patients with MND. Although the differences are limited with ADP, underscoring the utility of BIA for research, overestimation of fat-free mass may have consequences for clinical decision-making, especially when interest lies in determining the metabolic index.
Introduction
Body composition plays a pivotal role in the clinical management of patients living with motor neurone disease (MND). Tracking changes in body composition, such as quantifying the loss of fat-free mass (FFM) or fat mass (FM), offers the opportunity for timely dietary interventions to maintain adequate protein and caloric intake (Citation1–3). In addition, it provides an objective method for monitoring disease progression and loss of muscle mass (Citation4,Citation5), which could be useful as an endpoint in clinical trials (Citation6).
Air-displacement plethysmography (ADP) has proven to be a well-validated alternative to Dual-energy X-ray Absorptiometry (DXA) for quantifying FFM in healthy individuals (Citation7,Citation8). The main benefits of ADP over DXA include the lower burden, cost, easier application, and the absence of radiation. In late-stage patients with MND, however, ADP may involve increasing operational difficulties due to the need for patient transfers (Citation9). In addition, ADP assessments are required to be performed in an environment with as table room temperature, and, moreover, the ADP may provide – for a currently unknown reason – outlying data in a limited number of measurements (Citation10). Therefore, whole-body Bioelectrical Impedance Analysis (BIA) may be an interesting alternative. BIA is highly portable and requires no effort from the patient, while being noninvasive and maintaining low costs (Citation7).
Besides above mentioned practical arguments for using BIA versus ADP versus DXA, little is known about the validity of these techniques in patients with MND. DXA has shown to be capable of detecting disease progression in patients with ALS, but no comparison between techniques was made (Citation11). BIA, and its limitations, has been extensively studied in healthy individuals, but not in patients with MND (Citation12). One study described the validity of BIA over DXA in patients with ALS (Citation13). The authors created a specific equation to calculate FFM by BIA. In addition, a strong correlation was found between BIA and ADP in determining FM in patients with MND; there was, however, a lack of agreement existed between the two techniques (Citation14). ADP and DXA are indirect methods for measuring body composition, whereas BIA is a double indirect method. Hence, BIA makes multiple assumptions to translate the impedance data to a body composition, such as hydration status, and timing and contents of last ingested meal (Citation12); assumptions that could be affected by the presence of atrophy (Citation12).
Therefore, the aim of this study is to provide more clarity on anthropometric measures in patients with MND using different methods to assess body composition. The primary objective of this study is to determine the validity of the BIA in quantifying FFM compared to ADP in patients with MND. In addition, we will explore the precision of the Gallagher formula (GAL) – a formula to predict a person’s body composition – based on: sex, age, ethnicity, and BMI as a ‘device-free’ alternative to BIA and ADP (Citation15). Finally, we will examine the potential effect of the data obtained from the BIA versus ADP on the predicted resting energy expenditure (pREE) (Citation16), and the resulting metabolic index (MI), to explore the clinical relevance of our findings.
Methods
Study setting
Cross-sectional data from 140 patients with Amyotrophic Lateral Sclerosis (ALS), Primary Lateral Sclerosis (PLS) or Progressive Muscular Atrophy (PMA), were prospectively collected at the University Medical Center Utrecht, the Netherlands. Patients with ALS were diagnosed according to the El Escorial criteria (Citation17). A diagnosis of PLS was defined as presence of: (1) progressive upper motor neurone (UMN) symptoms for at least two years, and (2) UMN dysfunction in at least two body regions (Citation18). A diagnosis of PMA was defined as having lower motor neurone signs (LMN) only in two or more body regions. Exclusion criteria included the inability to lie in supine position for one hour, presence of a tracheostomy or the use of permanent assisted ventilation, or having an intellectual disability or mental illness. The study was approved by the Medical Research Ethics Committee of the UMCU (METC 15/656, NL54833.041.15). All patients provided written informed consent.
Study procedures
Following diagnosis, patients aged ≥ 18 years were invited to participate in our study. Clinical characteristics were collected, including disease duration, forced vital capacity (FVC) as percentage of predicted (Citation19), and the score on the revised ALS functioning rating scale (ALSFRS-R). The rate of disease progression (ΔFRS) was calculated by: (48 – ALSFRS-R score)/symptom duration (Citation20). The extent of atrophy was quantified as ordinal score, ranging from 0 (no involvement) to 3 (significant and severe involvement) and scored for the right arm and leg only (Citation21), according to the modified Ravits scale (Citation22). This scale is used to assess the potential effect of the extent of atrophy on the differences in body composition between BIA and ADP. To assess patient’s nutritional status, we administered the Patient-Generated Subjective Global Assessment (PG-SGA) (Citation23). Prior to the assessment, patients were requested to abstain from food, tea/coffee and smoking for at least 10 h, and, in addition, not to perform any exceptional physical activity. Furthermore, patients were requested to abstain from water for at least one hour, and to empty their bladder. All assessments were performed on the same day. First, we determined body composition by ADP using the BodPod (Cosmed USA, Rome, ITA) (Citation24), according to standard operating procedures. Patients were dressed in tight/form-fitting underwear or a swimsuit, were requested to remove jewelry and glasses, and had to wear a swimming cap. Thoracic gas volume was predicted using standard prediction equations (Citation25–28). Subsequently, the FM (%) was estimated by ADP, based on the Siri formula (Citation29). Second, we measured the REE (mREE) by indirect calorimetry, using a Quark RMR respirometer (Cosmed). A canopy hood was placed over the patient’s head for a period of 20 min. Adjustment of the flow rate was allowed during the first five minutes to achieve a flow rate of between 0.8 and 1.1 L/min. No adjustment of the flow rate was allowed during the remaining 15 min. Finally, we performed the BIA using a whole-body multifrequency device (Bodystat Quadscan 4000; Bodystat Ltd, Douglas, UK) on the right side of the body. Patients were requested to lie in supine position; then four electrodes were placed on the right side of the body. The electrodes were placed in the middle of the dorsal surface of the right hand and right foot proximal to the metacarpal-phalangeal and metatarsal-phalangeal joint, respectively, and also medially between the distal prominences of the radius and the ulna and between the medial and lateral malleoli at the ankle. Obtained data included the body resistance and reactance at a frequency of 50 kHz. Together with height, weight and sex, these parameters were used to calculate the FFM using Kyle’s equation (Citation30):
We also determined the patient’s FFM using the Gallagher formula (GAL) (Citation15, Citation31). Significantly, GAL does not require input from either BIA or ADP and predicts a patient’s FFM as follows:
For both equations, FM was simply calculated as the total body weight minus FFM. Subsequently, a patient’s predicted resting energy expenditure (pREE) in kcal/day could be obtained using the Sabounchi Structure 4 formula (Citation16, Citation32, Citation33):
Based on these obtained parameters, we were able to calculate the metabolic index (MI) by: (mREE (kcal/day)/pREE (kcal/day)) * 100%. The MI was determined using the data obtained from both the BIA and ADP, in order to compare outcomes. The GAL was not used in this analysis, as the MI has not been determined in previous studies with a ‘device-free’ method. An elevated metabolic index (e.g. hypermetabolism) was defined as an MI of ≥ 110% (Citation34).
To summarize, the pREE outcomes are dependent on the FFM and FM, and, as a result, the metabolic index (MI) might differ between data derived from BIA or ADP. For the sake of consistency, we will refer to the outcome measures of these devices, by mentioning the device that has been used (i.e. BIA or ADP).
Finally, we performed two sensitivity analyses: (1) we used the equation defined by Lukaski et al. to calculate FFM (kg) in order to assess the degree of accuracy between the equations of Kyle et al. and Lukaski et al. (Citation35), as the latter has previously been used as best fitting equation for patients with ALS (Citation36), and (2) we evaluated the hydration status of patients with MND using bioelectrical impedance vector analysis (BIVA) (Citation37,Citation38). The BIA assumes a fixed hydration status of patients of 73%; for illustrative purposes, we, therefore, assessed the hydration status of our study population to provide an insight into potential effect on BIA outcomes (Citation31).
Statistical analysis
Statistical analyses were performed using SPSS Statistics version 28.0 and RStudio (version 1.1.4, Rstudio: Integrated Development for R, Inc., Boston, USA, http://www.rstudio.com/). The characteristics of the patients were expressed as mean ± standard deviation (SD) or as median with their 25–75% interquartile range (IQR), depending on their distribution, or as frequency and percentage. The mean difference between BIA and ADP, and GAL and ADP were assessed using a paired Student’s t-test. Correlations were expressed as a Pearson’s r correlation coefficient, and differences further explored using the Bland-Altman method, together with its 95% limits of agreement (Citation13). Additionally, we estimated the intraclass correlation coefficient (ICC) and the standard error of measurement (SEM) using a linear mixed effects model with solely a random intercept per patient (Citation33). A linear regression model was used to evaluate the impact of atrophy on the difference in FFM between the BIA, GAL and ADP. To translate differences in FFM between the different methods to clinical relevance – besides determining the MI – we estimated a patient’s daily protein demands. According to the Dutch guideline – which is used in clinical practice – a chronically ill patient requires 1.5 g protein per kg FFM (Citation39). An under- or overestimation of 15 g or more in protein demand was deemed clinically relevant. A two-sided p-value of < 0.05 was considered statistically significant.
Results
Of the 140 included patients with MND, 77 were diagnosed with ALS, 30 with PLS and 33 with PMA. The baseline characteristics of the study population are summarized in . The majority of the patients with MND were male (63.6%) with a mean age of 62.0 ± 10.3 years. Patients with ALS were relatively younger (59.9 ± 10.2 years), and fewer were well-nourished (64.9%) compared to patients with PMA (83.3%) or PLS (72.7%). None of the included patients was of Asian descent.
Table 1. Baseline demographics and clinical characteristics of enrolled patients.
Validity of BIA
The relationships between FFM estimated by BIA, GAL or ADP are presented in . The Pearson’s r correlation coefficient between BIA and ADP was 0.93 (95% CI 0.91–0.95, p < 0.001), and between GAL and ADP 0.91 (95% CI 0.88–0.94, p < 0.001). The mean differences in FFM between BIA, GAL and ADP are presented in . The BIA overestimated the FFM by, on average, 2.5 kg FFM (95% CI 1.8–3.2, p < 0.001), resulting in a relative overestimation of 3.0% (95% CI 2.1–3.8, p < 0.001). The GAL overestimated FFM by, on average, 4.9 kg (95% CI 4.2–5.7, p < 0.001), with a relative overestimation of 6.2% (95% CI 5.3–7.1, p < 0.001). A potential cause might be related to a patient’s hydration status, as shown in Supplementary Figure 2. This figure illustrates that our study population is overhydrated, which may result in overestimating FFM using BIA. presents the individual differences in FFM between BIA versus ADP and GAL versus ADP, with 95% limits of agreement ranging from −5.3 to 10.3 kg, and from −3.8 to 13.6 kg, respectively. The ICC for BIA was 0.93 (95% CI 0.91–0.95), and for GAL 0.91 (95% CI 0.88–0.94). Results were similar within MND subtypes (not shown). Lukaski et al. overestimated FFM by 10.2 kg (95% CI 9.1–11.3, p < 0.001), as shown in Supplementary Table 1 and Supplementary Figure 1.
Figure 1. Correlation between fat-free mass obtained by ADP versus BIA and GAL. Scatterplot of the FFM (in kg) values obtained from the (A) BIA and (B) GAL, both compared to ADP. BIA outcomes were used in Kyle’s equation (Citation30). BIA: bioelectrical impedance analysis; ADP: air-displacement plethysmography; r: Pearson’s r correlation coefficient; FFM: fat-free mass; GAL: Gallagher formula.
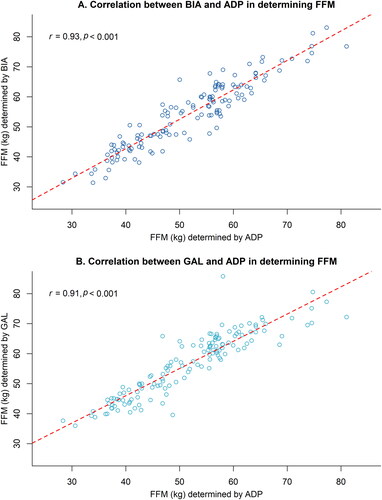
Figure 2. Differences in FFM when determined by BIA, GAL, and ADP. Bland–Altman plots visualizing the differences in FFM (in kg) of the BIA (panel A) and GAL (panel B) compared to ADP in MND patients (n = 140). Blue area indicates the 95% confidence intervals around the mean difference. Dotted lines indicate the 95% limits of agreement. BIA outcomes were used in Kyle’s equation (Citation30). BIA: bioelectrical impedance analysis; ADP: air-displacement plethysmography; ICC: intraclass correlation coefficient; CI: confidence interval; SEM: standard error of measurement; FFM: fat-free mass; GAL: Gallagher formula.
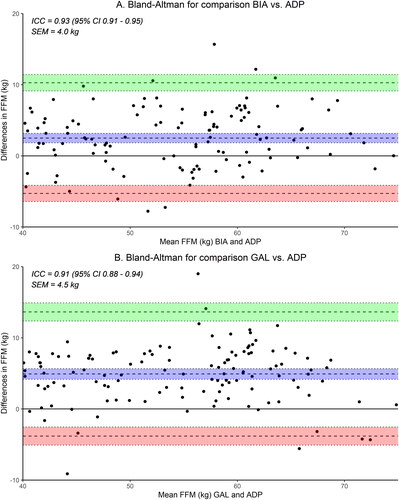
Table 2. Overview of the measured FFM and FM (kg and %) and the difference between the BIA, GAL and ADP in patients with MND (n = 140).
The difference between the BIA and ADP in FFM declined as the atrophy score increased: for each point increase in atrophy score, the mean difference in FFM between BIA and ADP declined by 0.78 kg (95% CI −1.2 to −0.4, p < 0.001). This relationship was less evident for GAL (p = 0.08).
Clinical relevance
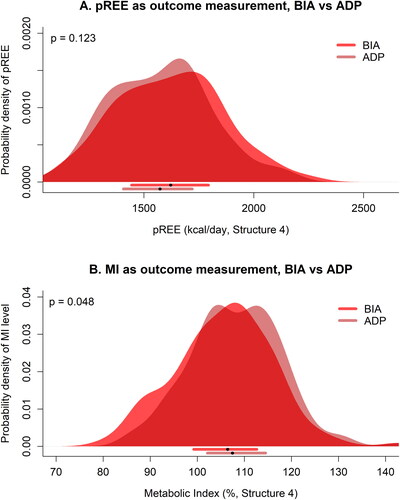
The mean pREE was found to be 1619.9 kcal/day (SD 241.0 kcal/day) when using BIA, and 1577.9 kcal/day (SD 227.5 kcal/day) when using ADP, resulting in a mean difference of 42.0 kcal/day (95% CI −13.5 to 97.4, p = 0.123). We found a mean metabolic index of 105.7% (SD 10.4%) when using BIA, and 108.2% (SD 9.7%) when using ADP, resulting in a mean difference of 2.5% (95% CI 0.1–4.9, p = 0.048). A hypermetabolic state of ≥ 110% was found in 44 (31.4%) patients using BIA, and in 62 (44.2%) patients using ADP. When we used ≥ 120% as cutoff value, 9 (6.4%) patients were hypermetabolic using BIA, compared to 11 (7.9%) patients using ADP (). In addition, mean daily protein demand was 77.5 g according to the ADP, which would increase to 81.3 g and 84.9 g when using the BIA and GAL, respectively. A clinically relevant underestimation of 15 g or more in protein demand was observed for 4 (2.9%) patients using BIA, and 9 (6.4%) patients using GAL. Differences in pREE were found between men (ADP: 1705.8 kcal/day (SD 169.1 kcal/day), BIA: 1751.6 kcal/day (SD 180.0 kcal/day)) and women (ADP: 1354.7 kcal/day (SD 116.8 kcal/day), BIA: 1387.8 kcal/day (SD 137.2 kcal/day)), all p-values < 0.001.
Figure 3. Differences in calculating predicted REE and MI using data provided by BIA and ADP. Figure shows probability densities of (A) the predicted REE based on data provided by BIA versus ADP, and (B) having a certain metabolic index based on data provided by BIA versus ADP, in patients with MND. BIA outcomes were used in Kyle’s equation (Citation30). The horizontal bars below every panel provide the median (black dots) with their 25–75% interquartile range. pREE: predicted resting energy expenditure; BIA: bioelectrical impedance; ADP: air-displacement plethysmography; MI: metabolic index. P-values are Wilcoxon signed-rank test.
Discussion
In this study, we have shown that – despite high correlations – the determination of fat-free mass using bioelectrical impedance or the Gallagher formula will result in a systematic overestimation, compared to air-displacement plethysmography, in patients with MND. As a result, protein demand was overestimated when using BIA and GAL, but this is unlikely to have significant disadvantages for a patient’s health management. Nevertheless, overestimation of fat-free mass may have consequences when interest lies in determining hypermetabolism, which would be underestimated when using BIA data to predict REE. This could be of importance when counseling patients for dietary interventions or in research settings when stratifying patients according to their metabolic index.
A comparison between ADP and BIA has not previously been performed in patients with MND. However, in non-neurologically affected individuals, an overestimation of FFM was found when using BIA compared to ADP (Citation40–45), with differences ranging from 0.5% to 5.3%. Our results seem to be in line with these studies, as we found an overestimation of FFM when using BIA – and GAL – compared to ADP. Nevertheless, both methods were highly correlated with ADP. This suggests that using BIA is a valid and easy device to use in patients with MND, as previously suggested (Citation13). Moreover, repeated measures of BIA and ADP have shown both to have high reliability (Citation46). On the other hand, we have highlighted the clinical relevance and differences in our findings which may be of relevance when assessing REE and, subsequently, determining the MI.
Predicting a patient’s REE is mainly dependent on FFM and FM (Citation32), in addition to their age and sex. A previous study showed that anthropometric measurements – such as body mass index (BMI) and body adiposity index (BAI) – do not seem to be sufficient to determine fat mass in ALS (Citation14), thus questioning the use of the Gallagher formula – which includes BMI as parameter – in patients with ALS/MND. However, as a decline in BMI (Citation47), and weight loss (Citation3) have proved to indicate a less favorable prognosis, it would seem to be important to prevent anthropometric changes by starting dietary interventions in time (Citation48,Citation49). Changes in outcomes of the Gallagher formula, might, therefore, be indicative of a patient’s needs. However, we have shown that the BIA is able to timely identify those patients who are in need of a dietary intervention, and, moreover, this method is low-burden for patients. Besides, BIA determines FFM more accurately than GAL, and the overestimation of FFM by BIA would merely lead to an advice of hypercaloric nutrition. An essential point to emphasize is that the degree of this overestimation might also be dependent on the prediction equation used (Citation32, Citation34). Clinicians should be aware of the potential consequences of the method used, as GAL and BIA overestimate FFM – and, therefore, underestimate FM – which might result in an earlier indication for dietary intervention. Besides, the proportion of patients in our study with a clinically relevant deficient protein intake was low, which might suggest augmentation of energy intake only, as previously described (Citation50).
In the same way, an increased metabolic state (e.g. hypermetabolic state) has proven to be prognostically less favorable in patients with ALS (Citation9). It is, therefore, very important that a patient’s body composition – consisting of FM and FFM – is determined accurately. We have shown differences between BIA and ADP in determining a patient’s metabolic state, which may result in excluding actual hypermetabolic patients with MND from, for example, observational studies and clinical trials (Citation51). This might lead to unjustified exclusion of these patients. Similar to this, GAL overestimates FFM, and, therefore, pREE, which may lead to a lower estimate of the proportion of patients with a hypermetabolic state, and subsequently unjustified exclusion of patients. Furthermore, the use of these different methods to calculate FFM may affect the estimation of patient’s caloric needs.
The main strength of this study is the comparison between BIA versus ADP and GAL versus ADP in patients with MND, and the effect on daily patient care. In addition, all assessments were performed by a trained, consistent study team, which prevented observer bias. As we have not assessed the triceps skinfold thickness (TSF), we were unable to assess the ALS-specific BIA formula (Citation13). The validity of TSF in ALS is arguable, however, due to abnormal fat distribution and asymmetrical muscle atrophy, as well as a rater-dependent variation (Citation13). Moreover, we used the Sabounchi Structure 4 equation to determine the pREE, and, subsequently, the metabolic index, which has recently been shown to be the best fitting equation in patients with MND (Citation33).
A limitation of our study might be the assessment of the BIA on the right side of the body only. This may have generated some deviation in outcomes due to asymmetrical muscle atrophy in this study population. Performing BIA on both sides and subsequently determining the mean, may provide additional information (Citation52). Future studies should compare the validity of one-sided versus double-sided BIA in patients with MND. Furthermore, future studies should collect longitudinal data in this study population, as it might provide greater insight in the validity of these techniques. Moreover, a comparison between the three disease subtypes (ALS versus PMA versus PLS), when using BIA and ADP, might be of value, despite their shared pathological features (Citation53). We do, however, provide unique data on body composition and metabolic rate in these patients. A comparison of pREE and MI between disease subtypes has been described elsewhere (Citation54). Other limitations might be the fact that we did not include non-neurological controls in our study, and that we have not assessed the inter- and intra-rater reliability. We did, however, include a significant number of patients with PMA and PLS, conditions which have not been extensively studied in comparison with ALS. Moreover, all assessments were performed according to our study protocol, to which the same, experienced study team adhered. Finally, future studies should be aware of the impact of hydration status when obtaining data regarding body composition (Citation12, Citation31, Citation55). Measuring body composition in MND patients is very important for creating an international consensus on the available techniques, and, subsequently, the derived data, to advise patients, their caregivers, and health care professionals more appropriately on, for example, nutritional intervention.
In conclusion, BIA and GAL systematically overestimate FFM compared to ADP in patients with MND. Differences are limited, and may have limited clinical impact for dietary interventions. However, overestimation of FFM may have consequences when determining patient’s metabolic index, as the BIA underestimates the metabolic index compared to the ADP.
Supplemental Material
Download Zip (228.2 KB)Disclosure statement
The authors report no conflicts of interest. The authors alone are responsible for the content and writing of this article.
Data availability statement
All protocol, analyses, and anonymized data will be shared on request from any qualified investigator. We take full responsibility for the data, the analyses and interpretation, and the conduct of the research.
Additional information
Funding
References
- Kruizenga H, Beijer S, Huisman-de Waal G, Jonkers-Schuitema C, Klos M, Remijnse-Meester W, et al. Richtlijn ondervoeding – Herkenning, diagnosestelling en behandleing van ondervoeding bij volwassenen. The Netherlands 2019; 1–39.
- Roubeau V, Blasco H, Maillot F, Corcia P, Praline J. Nutritional assessment of amyotrophic lateral sclerosis in routine practice: Value of weighing and bioelectrical impedance analysis. Muscle Nerve. 2015; 51:479–84.
- Janse Van Mantgem MR, Van Eijk RPA, Van Der Burgh HK, Tan HHG, Westeneng HJ, Van Es MA, et al. Prognostic value of weight loss in patients with amyotrophic lateral sclerosis: A population-based study. J Neurol Neurosurg Psychiatry. 2020;91:867–75.
- Holdom CJ, Janse van Mantgem MR, van Eijk RPA, Howe SL, van den Berg LH, McCombe PA, et al. Venous creatinine as a biomarker for loss of fat-free mass and disease progression in patients with amyotrophic lateral sclerosis. Eur J Neurol. 2021;28:3615–25.
- Ngo ST, van Eijk RPA, Chachay V, van den Berg LH, McCombe PA, Henderson RD, et al. Loss of appetite is associated with a loss of weight and fat mass in patients with amyotrophic lateral sclerosis. Amyotroph Lateral Scler Frontotemporal Degener. 2019;20:497–505.
- Van Eijk RPA, Eijkemans MJC, Ferguson TA, Nikolakopoulos S, Veldink JH, Van Den Berg LH. Monitoring disease progression with plasma creatinine in amyotrophic lateral sclerosis clinical trials. J Neurol Neurosurg Psychiatry. 2018;89:156–61.
- Fields DA, Goran MI, McCrory MA. Body-composition assessment via air-displacement plethysmography in adults and children: a review. Am J Clin Nutr. 2002;75:453–67.
- Lowry DW, Tomiyama AJ. Air displacement plethysmography versus dual-energy X-ray absorptiometry in underweight, normal-weight, and overweight/obese individuals. PLoS One. 2015;10:e0115086.
- Steyn FJ, Ioannides ZA, Van Eijk RPA, Heggie S, Thorpe KA, Ceslis A, et al. Hypermetabolism in ALS is associated with greater functional decline and shorter survival. J Neurol Neurosurg Psychiatry. 2018;89:1016–23.
- Muntean P, Micloș-Balica M, Popa A, Neagu A, Neagu M. Reliability of repeated trials protocols for body composition assessment by air displacement plethysmography. Int J Environ Res Public Health 2021;18:10693.
- Lee I, Kazamel M, McPherson T, McAdam J, Bamman M, Amara A, et al. Fat mass loss correlates with faster disease progression in amyotrophic lateral sclerosis patients: Exploring the utility of dual-energy X-ray absorptiometry in a prospective study. PLoS One 2021;16:e0251087.
- Hills AP, Byrne NM. Bioelectrical impedance and body composition assessment. Mal J Nutr [Internet] 1998;4:107–12. Available from: https://www.researchgate.net/publication/225300934
- Desport JC, Preux PM, Bouteloup-Demange C, Clavelou P, Beaufrère B, Bonnet C, et al. Validation of bioelectrical impedance analysis in patients with amyotrophic lateral sclerosis. Am J Clin Nutr. 2003;77:1179–85.
- Ioannides ZA, Steyn FJ, Henderson RD, Mccombe PA, Ngo ST. Anthropometric measures are not accurate predictors of fat mass in ALS. Amyotroph Lateral Scler Frontotemporal Degener. 2017;18:486–91.
- Gallagher D, Heymsfield SB, Heo M, Jebb SA, Murgatroyd PR, Sakamoto Y. Healthy percentage body fat ranges: An approach for developing guidelines based on body mass index. Am J Clin Nutr. 2000;72:694–701.
- Sabounchi NS, Rahmandad H, Ammerman A. Best-fitting prediction equations for basal metabolic rate: Informing obesity interventions in diverse populations. Int J Obes (Lond). 2013;37:1364–70.
- Brooks BR, Miller RG, Swash M, Munsat TL, El Escorial revisited: Revised criteria for the diagnosis of amyotrophic lateral sclerosis. Amyotroph Lateral Scler Other Motor Neuron Disord. 2000;1:293–9.
- Turner MR, Barohn RJ, Corcia P, Fink JK, Harms MB, Kiernan MC, et al. Primary lateral sclerosis: Consensus diagnostic criteria. J Neurol Neurosurg Psychiatry. 2020;91:373–7.
- Quanjer PH, Stanojevic S, Cole TJ, Baur X, Hall GL, Culver BH, et al. Multi-ethnic reference values for spirometry for the 3-95-yr age range: The global lung function 2012 equations. Eur Respir J. 2012;40:1324–43.
- Kimura F, Fujimura C, Ishida S, Nakajima H, Furutama D, Uehara H, et al. Progression rate of ALSFRS-R at time of diagnosis predicts survival time in ALS. Neurology 2006;66:265–7.
- Devine MS, Ballard E, O'Rourke P, Kiernan MC, Mccombe PA, Henderson RD. Targeted assessment of lower motor neuron burden is associated with survival in amyotrophic lateral sclerosis. Amyotroph Lateral Scler Frontotemporal Degener. 2016; May 1817:184–90.
- Ravits J, Paul P, Jorg C. Focality of upper and lower motor neuron degeneration at the clinical onset of ALS. Neurology 2007;68:1571–5.
- Ottery F. PG-SGA/Pt-Global Platform. https://pt-global.org/. 2014.
- COSMED – The Metabolic Company. Estimation of resting metabolic rate based on lean body mass with bod pod. 2012;(June):1.
- Crapo RO, Morris AH, Clayton PD, Nixon CR. Lung volumes in healthy nonsmoking adults. Bull Eur Physiopathol Respir. 1982;18:419–25.
- Fields DA, Hull HR, Cheline AJ, Yao M, Higgins PB. Child-specific thoracic gas volume prediction equations for air-displacement plethysmography. Obes Res. 2004;12:1797–804.
- Hollander F, Hulshof P, Koster E. Measuring fat mass and fat free mas using plethysmography (BOD POD®). Standard Operating Procedure 2020; 1–11.
- Stocks J, Marchal F, Kraemer R, Gutkowski P, Bar Yishay E, Godfrey S. Plethysmographic assessment of functional residual capacity and airway resistance. In: Infant Respiratory Function Testing. 1996. p. 191–238.
- Siri WE. Body composition from fluid spaces and density: analysis of methods. 1961. Nutrition. 1993;9:480–91; discussion 480, 492.
- Kyle UG, Genton L, Karsegard L, Slosman DO, Pichard C. Single prediction equation for bioelectrical impedance analysis in adults aged 20-94 years. Nutrition. 2001;17:248–53.
- Lemos T, Gallagher D. Current body composition measurement techniques. Curr Opin Endocrinol Diabetes Obes. 2017;24:310–4.
- Flack KD, Siders WA, Johnson LA, Roemmich JN. Cross-validation of resting metabolic rate prediction equations. J Acad Nutr Diet. 2016;116:1413–22. Available from:
- Holdom CJ, Janse van Mantgem MR, He J, Howe S, McCombe PA, Fan D. Variation in resting metabolic rate impacts identification of metabolic change in geographically distinct cohorts of amyotrophic lateral sclerosis patients. Neurology 2023;Unpublished.
- Weijs PJM. Hypermetabolism, is it real? The example of amyotrophic lateral sclerosis. J Am Diet Assoc. 2011;111:1670–3.
- Lukaski HC, Bolonchuk WW, Hall CB, Siders WA. Validation of tetrapolar bioelectrical impedance method to assess human body composition. J Appl Physiol (1985). 1986;60:1327–32.
- Nau KL, Dick AR, Peters K, Schloerb PR. Relative validity of clinical techniques for measuring the body composition of persons with amyotrophic lateral sclerosis. J Neurol Sci 1997;1:152.
- Piccoli A, Pastori G. BIVA software. Department of Medical and Surgical Sciences. Padova, Italy: University of Padova. 2002;1:1–17.
- Piccoli A, Nigrelli S, Caberlotto A, Bottazzo S, Rossi B, Pillon L, et al. Bivariate normal values of the bioelectrical impedance vector in adult and elderly populations. Am J Clin Nutr. 1995;61:269–70.
- Kruizenga H, Beijer S, Huisman-de-Waal G, Jonkers-Schuitema C, Klos M, Remijnse-Meester W, et al. Richtlijn Ondervoeding - Herkenning, diagnosestelling en behandeling van ondervoeding bij volwassenen. Stuurgroep Ondervoeding 2009;1:1–39.
- Azcona C, Köek N, Frühbeck G. Fat mass by air-displacement plethysmography and impedance in obese/non-obese children and adolescents. Int J Pediatr Obes. 2006;1:176–82.
- Flakoll PJ, Kent P, Neyra R, Levenhagen D, Chen KY, Ikizler TA. Bioelectrical impedance vs air displacement plethysmography and dual-energy X-ray absorptiometry to determine body composition in patients with end-stage renal disease. JPEN J Parenter Enteral Nutr. 2004;28:13–21.
- Foucart L, De Decker A, Sioen I, De Henauw S, Michels N. Hand-to-foot bioelectrical impedance analysis to measure fat mass in healthy children: A comparison with air-displacement plethysmography. Nutr Diet. 2017;74:516–20.
- Rodrigues NCL, Sala PC, Horie LM, Dias MCG, Torrinhas R d M, Romão JE, et al. Bioelectrical impedance analysis and skinfold thickness sum in assessing body fat mass of renal dialysis patients. J Renal Nutr. 2012;22:409–15.e2.
- Benton MJ, Swan PD, Schlairet MC, Sanderson S. Comparison of body composition measurement with whole body multifrequency bioelectrical impedance and air displacement plethysmography in healthy middle-aged women. Health Care Women Int. 2011;32:1068–78.
- Ferri-Morales A, Nascimento-Ferreira MV, Ubago-Guisado E, De Moraes ACF, Vlachopoulos D, Torres-Costoso A, et al. Agreement between standard body composition methods to estimate percentage of body fat in young male athletes. Pediatr Exerc Sci. 2018;30:402–10.
- Von Hurst PR, Walsh DCI, Conlon CA, Ingram M, Kruger R, Stonehouse W. Validity and reliability of bioelectrical impedance analysis to estimate body fat percentage against air displacement plethysmography and dual-energy X-ray absorptiometry. Nutr Dietetics. 2016;73:197–204.
- Jawaid A, Murthy SB, Wilson AM, Qureshi SU, Amro MJ, Wheaton M, et al. A decrease in body mass index is associated with faster progression of motor symptoms and shorter survival in ALS. Amyotroph Lateral Scler. 2010;11:542–8.
- Altinkaynak M, Gok GK, Ozmen B, Buyukdemir S, Akpinar TS, Erten SN, et al. Prognostic value of regular nutritional treatment in patients with amyotrophic lateral sclerosis. Neurologist. 2023;28:166–72.
- Burkhardt C, Neuwirth C, Sommacal A, Andersen PM, Weber M. Is survival improved by the use of NIV and PEG in amyotrophic lateral sclerosis (ALS)? A post-mortem study of 80 ALS patients. PLoS One. 2017;12:e0177555.
- Kasarskis EJ, Berryman S, Vanderleest JG, Schneider AR, McClain CJ. Nutritional status of patients with amyotrophic lateral sclerosis: relation to the proximity of death. Am J Clin Nutr. 1996;63:130–7.
- Scaricamazza S, Salvatori I, Amadio S, Nesci V, Torcinaro A, Giacovazzo G, et al. Repurposing of Trimetazidine for amyotrophic lateral sclerosis: A study in SOD1G93A mice. Br J Pharmacol. 2022;179:1732–52.
- Jensen B, Braun W, Both M, Gallagher D, Clark P, González DL, et al. Configuration of bioelectrical impedance measurements affects results for phase angle. Med Eng Phys. 2020;84:10–5.
- Saberi S, Stauffer JE, Schulte DJ, Ravits J. Neuropathology of Amyotrophic Lateral Sclerosis and Its Variants. Neurol Clin. 2015;33:855–76.
- Janse van Mantgem MR, van Eijk RPA, Holdom CJ, Meyjes M, Ngo ST, Steyn FJ, et al. Assessing the metabolic rate in patients with amyotrophic lateral sclerosis, progressive muscular atrophy, and primary lateral sclerosis. Eur J Neurol. 2023. Unpublished but submitted work.
- Barazzoni R, Jensen GL, Correia MITD, Gonzalez MC, Higashiguchi T, Shi HP, et al. Guidance for assessment of the muscle mass phenotypic criterion for the Global Leadership Initiative on Malnutrition (GLIM) diagnosis of malnutrition. Clin Nutr. 2022;41:1425–33. Apr;