
 ?Mathematical formulae have been encoded as MathML and are displayed in this HTML version using MathJax in order to improve their display. Uncheck the box to turn MathJax off. This feature requires Javascript. Click on a formula to zoom.
Abstract
Human mobility behaviour is far from random and can be predictable. Predicting human mobility behaviour has the potential to improve location selection for facilities, transportation services, urban planning, and can be beneficial in providing more efficient sustainable urban development strategies. However, it is difficult to model urban mobility patterns since incentives for mobility is complex, and influenced by several factors, such as dynamic population, weather conditions. Thus, this paper proposes a prediction-oriented algorithm under the framework of a Hidden Markov Model to predict next-location and time-of-arrival of human mobility. A comprehensive evaluation of these two schemes for the representation of latent and observable variables is discussed. In conclusion, the paper provides a valuable contribution to the field of mobility behaviour prediction by proposing a novel algorithm. The evaluation shows that the proposed algorithm is stable and consistent in predicting the next location of users based on their past trajectories.
1. Introduction
The increase in population and urbanization has led to a greater demand for services, resulting in more traffic demand and other related issues. According to research, Urban areas are already host to more than 50% of the world's population, and this tendency is anticipated to continue (Desa Citation2014). Urban areas strongly affect the world's energy consumption, and they have a key role in climate change strategies to steer against sustainable development (Dhakal Citation2009). An essential part of the ‘urban metabolism’ (Clift et al. Citation2015) is the population's mobility patterns in the cities. One major problem in urban areas is the significant increase in car use as the principal transport mode (Huang, Cheng, and Weibel Citation2019; Sadeghian, Håkansson, and Zhao Citation2021). To reduce the environmental impact of human mobility in cities, it is necessary for city planners and developers to capture human mobility and assess the corresponding impact on urban energy consumption (Yazdanie and Orehounig Citation2021). The environment can significantly influence human mobility behaviour, as individuals often adjust their movement patterns in response to environmental factors such as weather, traffic conditions, and the availability of transportation options (Lo and Sumalee Citation2013). Numerous applications of predicting human mobility patterns include in urban planning, transportation management, and public safety (Lanzaro, Sayed, and Alsaleh Citation2022). By accurately predicting where people are likely to go next, cities can optimize transportation infrastructure, plan emergency responses, and improve overall quality of life for their residents (Lam, Lo, and Wong Citation2013; Ni et al. Citation2017).
A potent statistical tool that has been utilized applied in a wide variety of fields, ranging from speech recognition to bioinformatic is called a Hidden Markov Model (HMM) (Jaradat, Alzubaidi, and Otoom Citation2022; Shen, Park, and Warnow Citation2022). While HMMs may not be as widely used for predicting human mobility patterns as they are in other areas, their flexibility and ability to model complex data sequences make them a potentially powerful tool for understanding and predicting human behaviour in various contexts. However, HMMs require detailed data input, since urban mobility behaviour of citizens is highly complex and volatile (Alvarez-Garcia et al. Citation2010; L. Li, Li, and Ni Citation2021; Wong et al. Citation2014). Traditional approaches rely on expensive manual surveys, which give a relatively coarse-grained description of a person’s mobility (Abbar et al. Citation2018; C. Zhang and Schmöcker Citation2019). In addition, some of the commonly used data collection methods are based on stated preferences rather than revealed preferences of actual behaviour. When wearing a GPS tracker, users record in detail their outdoor positions with longitude, latitude, date, time, and speed. In combination with GIS layers, activities like going to work, shopping, leaving kids to kindergarten, and sports activities could also be identified. However, although many studies have been conducted to identify human mobility patterns, by using GPS tracking data (Molloy et al. Citation2022; Namdarpour et al. Citation2022; B. Wang, Gao, and Juan Citation2018), there is a limited number of studies that have implemented the data in a HMM (Khoroshevsky and Lerner Citation2017; Qiao et al. Citation2018).
Markov models can be used to perform a variety of analyses on GPS data, such as predicting the future location of an individual or object, identifying patterns in mobility behaviour, and analysing the effectiveness of different navigation strategies. HMMs are also used in applications such as traffic analysis, route planning, and location-based advertising (Dang et al. Citation2022; Yao, Zhang, and Chen Citation2023; Yun et al. Citation2019). Moreover, predicting human mobility behaviour from a large amount of location information collected from GPS trackers is challenging. Among all locations that people visit during the day, some are visited less often, or only once, while others are visited more frequently and can be seen as points of interest (POI). These points of interest are connected with the user’s latent states, such as living address or workplace. In order to provide location-based services for practical applications, human mobility patterns can be better understood and generalized through the use of POI modelling. Only a few studies have been conducted to predict the human mobility pattern based on the GPS tracking dataset (Alvarez-Garcia et al. Citation2010; Khoroshevsky and Lerner Citation2017). One major problem with these studies is that the dataset used in the studies were rather small and based on a few users (Alvarez-Garcia et al. Citation2010; Lv et al. Citation2016).
In addressing the above challenges, this paper proposes a model for predicting human mobility patterns by learning the destination choice of travellers based on large GPS tracking dataset in two schemes. In Scheme 1, the POI is a latent variable, and the considered time slot is an observable variable, while in Scheme 2, the representations are swapped. The evaluations of different schemes for the representation of latent and observable variables in HMMs are important for several reasons. Firstly, the choice of representation scheme can have a significant impact on the performance of a HMM. Different schemes can lead to different levels of accuracy, computational efficiency, and robustness to noise and uncertainty. By comparing the performance of different schemes under a range of conditions and scenarios, we can gain a better understanding of their strengths and weaknesses and make more informed decisions about which scheme to use in a particular application. Moreover, in this study, we have utilized a first-order Hidden Markov Model (HMM) for human mobility prediction. This choice is driven by the balance between model complexity and computational efficiency. First-order HMMs, with their assumption of the Markov property, where the future state depends only on the current state, offer a simpler and more computationally manageable framework. This is particularly important given the large datasets typically involved in human mobility studies.
Therefore, the performance of predictors on different user groups is also evaluated. Specific aims of this paper are:
To design a prediction-oriented algorithm for HMM in predicting next-location and time-of-arrival.
To conduct comprehensive evaluations of two schemes for the representation of latent and observable variables in HMM and examine how different types of POIs and time points differ when making the predictions.
The remainder of this paper is organized as follows. Section 2 provides a survey of the related work. Section 3 describes the methodology, Section 4 presents the processing and preparing of the dataset, and Section 5 describes the results of the model. Section 6 of the paper finishes with a summary of our findings, a discussion of the limitations of our study, and recommendations for further research.
2. Related work
A human's displacement within a geographical region usually follows a pattern in developed cities and societies where life is sedentary and comfortable. Many of these displacements occur towards familiar places, such as homes, workplaces, cinemas, or shopping centres. Consequently, patterns of this mobility can be investigated, and a prediction system can be developed by storing all the places where a user might go so that he or she can anticipate their arrival. Therefore, the mobility of people is a principal part of the ‘urban metabolism’ (Clift et al. Citation2015). Mobility models are usually considered on the individual level and the whole population level (Barbosa et al. Citation2018; Benmansour, Bouchachia, and Feham Citation2017; Kato Citation2021; Kim and Song Citation2018). Individual-level mobility models have been widely studied and applied in transport and urban planning (Barbosa et al. Citation2018; Peng et al. Citation2022; Sadeghian et al. Citation2022; Sá et al. Citation2019; M. Li et al. Citation2019). Studies on the individual level have shown that individuals do not travel randomly (Lv et al. Citation2016; Qiao et al. Citation2018; Y. Xu et al. Citation2022). In transportation models, human mobility has been acknowledged as a factor influencing urban planning and urban building energy use (Johari et al. Citation2020). Mohammadi and Taylor (Citation2017) developed a multivariate autoregressive model to predict how human mobility could impact the energy demand of buildings. Although various models are possible for identifying human mobility, two types of ways have been widely used: intervening opportunities, and radiation models.
Intervening opportunities models consider human mobility and assert the number of cumulative key points in migration between origin and destination, to determine how people move between services and residences (Lenormand, Bassolas, and Ramasco Citation2016). Radiation models usually apply a conditional probability approach to approximate the spatial distribution of opportunities (Lenormand et al. Citation2012; Lenormand, Bassolas, and Ramasco Citation2016; Masucci et al. Citation2013; Schläpfer et al. Citation2021). Radiation models allow the absence of a parameter to calibrate the observed data. However, this mechanism limits the robustness of the model in the change of spatial scales (Barbosa et al. Citation2018; Lenormand, Bassolas, and Ramasco Citation2016; Liang et al. Citation2013; Schläpfer et al. Citation2021). An opportunity selection radiation model was developed to address this flaw (Alis, Legara, and Monterola Citation2021; Simini, Maritan, and Néda Citation2013), as well as an extended radiation model (Hong, Jung, and Jo Citation2019; Yang et al. Citation2014), have been proposed to measure the shift in the spatial scales and keep the model robust.
Hidden Markov Models (HMMs) and Markov Models (MMs) are both powerful tools for modelling sequence data, but they differ fundamentally in how they handle observable and hidden states (Loo et al. Citation2021). MMs operate on the assumption that each state in the sequence is directly observable and that the transition from one state to another is based solely on the current state. In contrast, HMMs are designed for situations where the states are not directly observable (hidden). Instead, the observable elements are seen as probabilistic functions of these hidden states (Alvarez-Garcia et al. Citation2010; Mathew, Raposo, and Martins Citation2012). This feature of HMMs makes them particularly suitable for analysing complex phenomena like human mobility patterns, where the true state (like the intent or destination) is not directly observable but can be inferred from observable elements like location data and time. By employing HMMs, we can more accurately model and predict human behaviour, which often depends on underlying factors not immediately apparent in the raw data (Loo et al. Citation2021; Lv et al. Citation2016).
Markov modelling is widely utilized in prediction models, due to the efficiency, simplicity, and low computation cost of this modelling (Alvarez-Garcia et al. Citation2010; Jitta and Klami Citation2017; Xia, Hu, and Chen Citation2023). The Markov model, which uses a series of a user's prior visited locations to produce predictions about their upcoming destination. The order-k of the Markov chain model is determined by the length of the sequence of locations. The four primary types of Markov-based prediction models are as follows: (1) order-k Markov-based models that only use historical locations to determine individual mobility patterns; (Song et al. Citation2006; Song et al. Citation2006), (2) order-k Markov-based models that incorporate external information in addition to trajectory data (Gogate et al. Citation2012), (3) hybrid Markov-based models that incorporate other prediction models (Bellahsene and Kloul Citation2010), and (4) algorithms developed using both Markov and hidden models (Qiao et al. Citation2018). Markov properties with the combination of external information, such as information about human’s schedules, have been used to improve the prediction of the model’s accuracy. The first study using probabilistic models for predicting urban mobility by using a GPS tracking dataset was carried out in 2003 (Ashbrook and Starner Citation2003).
A HMM was mainly used to predict the next frequently visited location based on human mobility patterns (Alvarez-Garcia et al. Citation2010; Benmansour, Bouchachia, and Feham Citation2017; Qiao et al. Citation2018). Some other external information was Microsoft outlook and google calendar, in order to obtain more information about users (Sun and Blough Citation2007). Other study proposed a model for predicting the trip destination based on a GPS tracking dataset (Alvarez-Garcia et al. Citation2010). The used dataset is rather small and based on only 6 users. Their proposed model achieved an accuracy of more than 80% for four users. In another study, both a first-order and a second-order Markov chain were used for making mobility predictions, when the profile of a user who has the tendency to regularly move is unavailable (Barth, Bellahsene, and Kloul Citation2011). As an extension of fixed order, the order of the Markov chain was estimated by considering individual mobility patterns, where the travel indicators are non-Gaussian (Qiao et al. Citation2018). In a study not relying on a street-map, a HMM was used to detect the destination places in the latent variable (Qiao et al. Citation2018).
Their model achieved an accuracy level of 56% for predicting human mobility. The observable variables were represented by actual places, where trips of each user overlap. Another study developed the HMM for a spatio-temporal and a next-place predictor by adopting information of living habits (Lv et al. Citation2016). They also recommended that entropy profile should be considered for mobility prediction. A Baum-Welch algorithm was used for parameter estimation in a HMM where the latent variables are time (Mathew, Raposo, and Martins Citation2012). However, the predicted location only achieved an accuracy of 13.85%.
In recent years, deep learning-based models have revolutionized the field of human mobility prediction, offering significant advancements over traditional statistical methods (Ma and Zhang Citation2022; Sadeghian, Håkansson, and Zhao Citation2021). These models leverage complex neural network architectures to capture the non-linear and high-dimensional patterns inherent in human mobility data. Studies have demonstrated the superiority of deep learning approaches in terms of accuracy and predictive power, particularly in contexts with large-scale and heterogeneous datasets (Feng et al. Citation2018; P. Tao et al. Citation2021; Zhang, Koutsopoulos, and Ma Citation2023; Zhou et al. Citation2021). This has led to a growing consensus that deep learning models provide a more robust and flexible framework for understanding and forecasting human movement patterns. Their capacity to integrate diverse data sources and model intricate dependencies makes them especially suited for the dynamic and multifaceted nature of human mobility. This emerging trend underscores the necessity of incorporating and comparing deep learning methodologies in our research to stay at the forefront of the field (Mo et al. Citation2021).
While deep learning models have significantly impacted the field of human mobility prediction, especially in handling large and complex datasets, the Hidden Markov Model (HMM) often demonstrates superior performance in certain contexts. HMM's strength lies in its ability to efficiently model sequences and transitions in data, making it particularly effective for predicting human mobility where data patterns are more sequential or cyclic. This is evident in scenarios with limited or specific data types, where HMM's simplicity and lower computational requirements offer practical advantages over deep learning's complexity.
To address the lack of a model for predicting next-location and time-of-arrival with using a GPS tracking data, this study presents an in-depth investigation on the performance of the predicted next-locations and the time-of-arrival on individuals, on a large scale with different living habits. The paper assumes that a knowledge base containing past mobility patterns and behaviours of objects or individuals already exists. This information is used to compare the mobility pattern of a particular object to the stored data, with the objective of predicting its future locations. The underlying assumption is that human mobility behaviour tends to repeat itself, and that similar contexts or situations could indicate similar mobility patterns in the future. Therefore, by analysing past mobility patterns and comparing them to the current context, it is possible to make predictions about an object or individual's future movements.
3. Input GPS tracking data
This part conducts a case study to investigate the point of interest in the city and detect human mobility patterns, based on the GPS trajectory data in Borlänge, Sweden. Borlänge has a geographical coordinate of latitude of 60.4856, and longitude of 15.4363. The total area of the city is 586.74 km² and has 52,590 inhabitants in 2019. The dataset contains the mobility of 91 volunteers with more than four million GPS point data that was collected from September 2019 to October 2020. These volunteers, aged between 20 and 70 years, represent a demographic primarily composed of active, working individuals. This particular composition of the sample group is critical, as their consistent work-related travel patterns likely present the kind of structured mobility that is well-suited for analysis through the Hidden Markov Model (HMM). The GPS points contain the information of point ID, date, time, longitude, latitude, altitude, and speed. The sampling rate of positional recording of the dataset was approximately every five seconds. All the users were requested to carry the device (Renkforce) during the sampling time when they started a trip, and to turn off the device after they reached a certain destination, or when the trip of the day finished. In total, more than 4.5 million positional recordings were collected. Training set comprises 80% of the whole dataset, and testing set comprises the remaining 20%.
Some GPS points with latitude and longitude of zero were present due to GPS error; these GPS points were eliminated from the dataset as noise. Then, from the dataset, the cleaned GPS trajectories were taken. The GIS layers from Open Street Map (OSM) of the public road and rail network, and facilities in the study area are used in order to identify different types of point of interest in the city. A common method of identifying a trip is to measure the time between two sequential positional recordings and compare it with the defined threshold, ranging from 3 to 20 min, depending on study area (Alvarez-Garcia et al. Citation2010; Gong et al. Citation2012). Based on previous study, in order to define a trip, a threshold of 20 min is set between two sequential points, in this study. In total, 11,415 trips were obtained; the destination point of every trip was marked as its trip destination.
To use the GPS dataset in the study, it is necessary to clean the outliers, align with the spatial and temporal features of the dataset, and deal with missing values. The first step used in this study is noise reduction, where the dataset filter is based on a temporal feature, which means that the positional recording with a time stamp greater than the next positional recording is identified and removed. Moreover, all points with a long distance to the next positional recording and high speed are recognized and removed from the dataset (2478 positional recording). Features, such as date, time, longitude, and latitude, can easily be extracted from the GPS tracking data for each positional recording. However, in order to have a better understanding of the dataset, more features are required to be extracted. Therefore, features, such as days at a place, days of data collection, origin and destination, for each positional recording and user, are extracted.
3.1. Points of interest (POI)
In this part, the clustering algorithm for constructing location clusters and investigate the POIs from individuals’ trajectories is presented. The clustering algorithm adopted a hierarchical density-based spatial clustering of applications, with a noise method called HDBSCAN (McInnes, Healy, and Astels Citation2017). This algorithm is based on the traditional density-based clustering algorithm DBSCAN (Campello et al. Citation2015; Campello, Moulavi, and Sander Citation2013). This algorithm proves to be effective in detecting arbitrary shapes like neighbourhoods within a city. It has the ability to recognize different levels of density and can isolate irregular patterns in data. Although it is beneficial to have access to the distributions of both starting points and ending points, it is crucial to gain an understanding of the specific regions within the city that are more attractive to people and to examine the spatial arrangements of these appealing areas. This part employs the HDBSCAN algorithm to identify clusters, enabling the occurrence of clusters at different scales and eliminating the need for a fixed density requirement (McInnes, Healy, and Astels Citation2017), which removes the static density requirement and allows for various scales of clusters to occur. The benefit of clustering includes the following two parts: (1) A high density cluster can be classified using the spatial density-based approach HDBSCAN. Additionally, the G.I.S. layer data allows for the identification of the precise locations within each cluster. (2) HDBSCAN can filter out the interfering noise data. (3) While DBSCAN only uses two parameters, the HDBSCAN algorithm creates clusters of varying densities. While both algorithms have a minimum number of sample parameters, which determine the neighbour threshold for a record to become a core point, they differ in their approach to defining clusters. DBSCAN uses the parameter epsilon, which specifies the radius within which neighbouring points must fall to form a cluster core. In contrast, HDBSCAN uses the parameter minimum cluster size to determine how big a cluster must be. The absence of an epsilon value in HDBSCAN allows for the detection of diverse density clusters and makes it more resilient to parameter selection than DBSCAN, which struggles with varying densities.
The distance between an object and its nearest neighbour, as measured by HDBSCAN, is known as the core distance, or dcore. However, the constructed hierarchy is based on the mutual reachability distance, which for two point data p1, p2 is Equation (10):
(1)
(1) where d(p1, p2) refers to the ‘normal’ distance, according to the chosen metric, e.g. Euclidean distance, which is defined as the following equation:
(2)
(2) where, (pl1, pl2) are Euclidean vectors, and n is n-space. This method makes the clustering more noise-resistant by separating sparse points from others by at least their core distance. In this study, the minpoints are set equal to 100 (W. Xu Citation2018). Due to its straightforward mathematical structure and low processing cost, the HDBSCAN method has been frequently employed for density-based clustering of large-scale data. It is a useful tool for classifying data into separate groups since it allocates all point densities that can be reached from various sites into clusters (Ferreira et al. Citation2021; Malzer and Baum Citation2020). The HDBSCAN removes the static density requirement and allows for various scales of the cluster to occur. In this study, we apply HDBSCAN to generate clusters of varying densities. After applying the HDSBSCAN, in order to identify the public point of interest, the k-means algorithm is also applied to cluster the users’ habitat. In total, 91 users participated in the data collection. By applying the k-means algorithm, the total number of POIs for habitat location was reduced from 91 to 27.
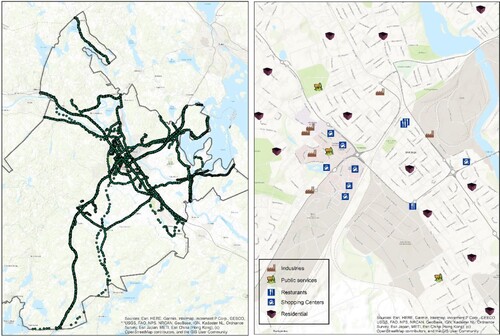
To identify points of interest in the study area, the HDBSCAN algorithm is applied to users’ trajectories. This algorithm requires two input parameters for the selected dataset for clustering. In the calculation of distance, the minimum number of points is the first parameter. In this study, we selected 100, based on the dataset (McInnes, Healy, and Astels Citation2017). The minimum cluster size p is the second needed parameter, which set a lower bound on the number of data points required to form a cluster that we selected the preferred software (ArcGIS Pro) selection. The results of HDBSCAN showed that the 45 clusters are candidates for being points of interest in the study area. Based on the obtained results from HDBSCAN, all 45 clusters are checked manually by using the GIS information layers. 22 out of 45 points are selected as the most visited public points of interest (POIs) in the study area, such as a commercial area, industrial area, and public services. Furthermore, in order to cluster 91 users’ inhabitants’ locations, the k-means algorithm is also implemented. The three different numbers are selected for k, in the k-means algorithm (k = 10, 20, and 30); based on the results, in order to cover all 91 user's habitats into clusters, k = 20 is selected for this study. However, after manually scanning and comparing the results of the k-means algorithm on a map, we decided to increase the number of clusters to 26 to cover most of the residential area. As a result, we reduced the number of POIs for the residential area from 91 to 26 POIs. All destination data with no POI were marked as POI equal to 0. In total, for this study, 49 POIs are identified (Figures (a, b)). Based on the volunteer privacy policy, all POI-related residential area in Figure (b) has been moved with a radius of 1 kilometre. This selection was guided by the need to represent the diversity of activity locations visited by the 91 volunteers. While not every single POI visited by each volunteer may be included, the selected POIs are representative of the most significant and frequently visited locations, ensuring a comprehensive coverage of their mobility patterns. This approach allows us to effectively model and predict human mobility behaviours using HMM within the scope of our dataset.
4. Methodology
This paper proposes a model for predicting the next location and time of arrival, based on a large scale of GPS tracking dataset. The collected GPS tracking data and GIS layer information as input data are preprocessed before being used in the methods section. Through the steps of data processing and cleaning and feature extraction, the dataset is prepared for future analyses (Sadeghian et al. Citation2022). The prepared dataset is fed into the methods section in order to develop a model for predicting the human mobility pattern in two schemes. The methods part begins by identifying the point of interest in the study area. It continues with the user clustering based on the time period of the collected dataset, and concludes with the HMM modelling algorithm in two schemes.
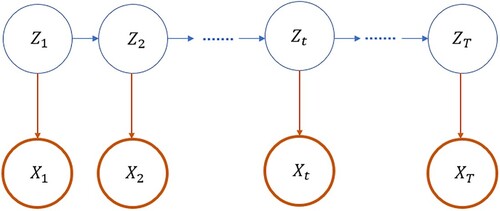
The HMM is a generative mixture model in which a state's latent variable sequential dependency is only imposed on the value of the preceding state (Figure .). A discrete latent variable in a standard HMM, , describes which component of the mixture is responsible for generating the corresponding observable
,
(Bishop and Nasrabadi Citation2006). In this paper,
is also discrete, representing a POI, or a time slot of a day. Since
can be viewed as a K-dimensional variable, a 1-of-K coding method specifies the transition probability matrix
, with elements
to be
(3)
(3) where
are the level of states of
. To start the process, the probability of observing the initial state can be defined as a vector
with the elements:
(4)
(4)
Figure 1. Representation of HMM.
The probability distribution of the observable variable, known as emission probability, is conditional on , which is given by
(5)
(5) where
is the specific observation value in 1-of-O coding that
can take. It should be noted that
is also organized in a matrix form,
, for discrete
and each row represents a distribution.
Two assumptions are usually made, based on a graphical model. On the one hand, the homogeneous assumption, , shows that
only depends on
among all preceding variables when
is known. However, dependency may exist between
and
for unknown
. On the other hand, the output independence assumption,
, explains that the observable variable only has a dependency on the latent variable that directly generates it.
In this paper, we consider two schemes for building the models and evaluate which scheme has more effect on the accuracy of the model (Table ). POI is set as a latent variable; time slot is the observable variable in Scheme 1, while Scheme 2 swaps the representations. Scheme 1 takes people’s mobility as an intrinsic behaviour, and the temporal feature is a passive reflection of the behaviour. Recurrent visits of the same POI during the day are allowed. Conversely, Scheme 2 regards the transition between POIs as a consequential behaviour of time, where the transition only occurs chronologically (Figure .). In our model, we consider Points of Interest (POIs) as latent variables because they represent underlying factors influencing human mobility patterns, which are not directly observable from the data. On the other hand, time slots are treated as observable variables because they are explicit and measurable aspects of the data. The rationale for this approach is grounded in the idea that human mobility is significantly influenced by unobserved preferences or needs that POIs represent, while time slots offer a direct, temporal framework for mobility analysis. This conceptualization helps in capturing the complex dynamics of human movement more effectively. Figure shows an example of an instantiated HMM for spatial temporal mobility that has five time slots. The hidden states are represented by four different POIs. The aim is to make next-POI and time-of-arrival predictions for both schemes and evaluate the performance of the proposed method. The prediction can either be based on the current state, or on the past state. Nevertheless, both predictions should converge with each other in reality. Thus, we further distinguish whether the current POI of the time slot is known when predicting the next occasions. As seen in Table , the specifications are symmetric for both themes. The probabilities for each scenario are expressed for both schemes indicated by the superscript parentheses. is initially given and
and
will be updated to improve prediction accuracy. The initial value of
is calculated based on the GPS trajectory of users.
Figure 2. Representation of HMM in two schemes.
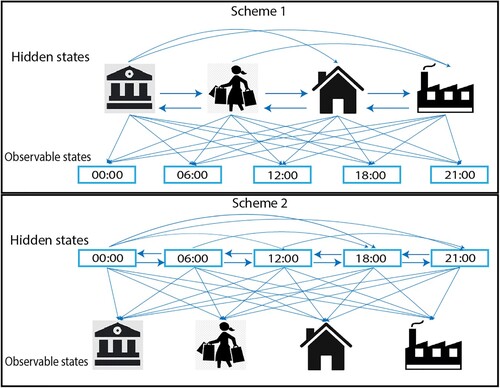
Table 1. Predictions of next POI and time-of-arrival.
The model we proposed is to iteratively update A and B, such that the predictions with known and unknown
converge to each other, namely setting
and
for both schemes. Thus, there are three probabilities in implicit forms that need to be further examined to implement the procedures in model.
Firstly, is decomposed by naturally introducing
that connects
and
. Since
takes value from 1 to
, we have
(6)
(6)
Secondly, we denote the joint probability of as
(7)
(7) to evaluate the remaining probabilities.
can be recursively obtained from
by
(8)
(8)
Given Equation (6), the joint probability
(9)
(9) can be used for evaluating
which is given in Equation (8):
(10)
(10)
Thirdly, starts from Equation (8) by including the emission probability at the state
, which is given in Equation (9):
(11)
(11)
Table
Moreover, the comparative evaluation between two schemes and scenarios are discussed. As opposed to prediction accuracy showing the ratio between the number of correct predictions and the total number of attempted predictions, prediction precision is the ratio between the number of correct predictions and the number of predictions predicting the user to be at a POI.
As part of the performance evaluation, we also conducted a parameter evaluation of the proposed algorithm to assess the impact of different parameter settings on its accuracy and efficiency. By systematically varying the values of key parameters, such as the number of iterations, the size of the data, and the learning rate, we were able to identify the optimal parameter settings that led to the best performance Figure .
Figure 3. (a). Positional recordings of the GPS dataset in study area (b) Selected POIs based on clustering algorithms in study area.
5. Results
5.1. Model prediction and accuracy (Scheme 1)
The proposed HMM is evaluated using real GPS tracking datasets by assessing the results of each applied approach and comparing the accuracy of each prediction at each stage. Additionally, the model's prediction accuracy is compared to that of other studies to provide further evaluation. In Scheme 1, POI is set as a latent variable, and the time slot is set as an observable variable. Scheme 1 uses human mobility as an intrinsic behaviour, and the temporal feature is a passive reflection of the behaviour; visiting the same POI during the day is allowed.
To increase the prediction accuracy of simple Markov algorithms, we used the HMM algorithm to predict human mobility. The prediction accuracy metric for each POI is the ratio of the number of correct predictions to the total number of attempted predictions for a user in the testing set. The prediction accuracy metric for each time slot measures the proportion of correct predictions over all attempted predictions in the testing set. A prediction is considered correct if the model predicts that the user will be at a certain POI, at a specific time, T. Figure shows the model accuracy for predicting the POIs for each 49 points of interest. The result shows that the model performed well in predicting the next place.
The evaluation results in Figures and show that the proposed HMM performed well in predicting the next POI and time slot for users’ trajectories extracted from real GPS tracking datasets in Scheme 1. The model accuracy for predicting the POIs for each 49 points of interest was more than 75%, which indicates that the model can effectively predict the next place that a user will visit. Moreover, the model performed outstandingly for users with fixed daily patterns, and for some POIs, the model can predict a 100% level of accuracy.
Figure 4. predicted model accuracy of each point of interest for Scheme 1.
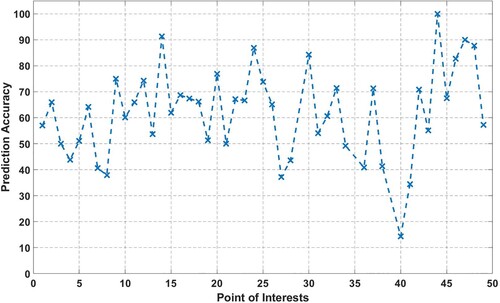
Figure 5. predicted model accuracy of each time slot for Scheme 1.
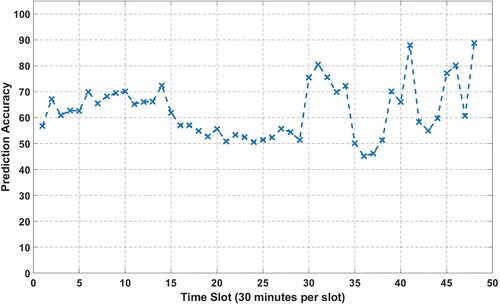
Figure shows the next place prediction model accuracy for each 48-time segment. The model for predicting the time slot performed well, with more than 70% accuracy for most of the time segments in Scheme 1. This indicates that the model can accurately predict the time when a user will visit a particular POI. The evaluation of the proposed HMM, using real GPS tracking datasets, is a crucial step in demonstrating the effectiveness of the model. By evaluating the results of each used method and comparing the accuracy of each prediction at each stage of the model, the researchers can assess the model's performance comprehensively. Furthermore, comparing the accuracy of model with other prediction methods provides additional insights into the model's strengths and weaknesses. Comparing the proposed model to previous studies, the fact that it performed well with an overall accuracy of more than 75% is promising, while the accuracy of other studies is around 60% (Lv et al. Citation2016; Qiao et al. Citation2018). The model achieved higher accuracy to predict the human mobility for public POIs (from 1 to 22), the accuracy of the POIs related to residential area is dependent on the amount of the GPS dataset for each POI. The accuracy of the predictions for residential POIs may be more variable and less reliable, depending on the amount of GPS data available for each POI. This suggests that the proposed model is a significant improvement over existing models and has the potential to provide useful insights into users’ next locations and time slots. Overall, the evaluation results demonstrate the effectiveness of the proposed HMM in predicting human mobility, and it can be a valuable tool for location-based services, personalized recommendations, and urban planning.
5.2. Model prediction and accuracy (Scheme 2)
In Scheme 2, the transition between POIs is a consequential behaviour of time, where the transition only occurs chronologically. The aim is to make next-POI and time-of-arrival predictions for both schemes and evaluate the performance. The prediction can either be based on the current state, or on the past state. Nevertheless, both predictions should converge with each other in reality. Thus, we further distinguish whether the current POI of the time slot is known when predicting the next occasions.
Figure shows the model accuracy for both groups for each POI. The results indicate that in Scheme 2, when the transition between POIs is a consequential behaviour of time, and the transition only occurs chronologically, the model could not perform as well as in Scheme 1.
Figure 6. predicted model accuracy of each point of interest for Scheme2.
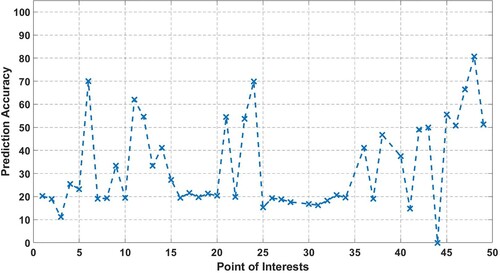
Figure shows the proposed model's accuracy for each time in Scheme 2. The model can perform well for some of the time segments, which is more than 80%. However, the accuracy of the proposed model for Scheme 2 in each time segment is around 50%. Overall, the HMM-based predictor performs better in Scheme 1. Based on the evaluation results shown in Figures and , it appears that the HMM-based predictor performs better in Scheme 1 than in Scheme 2. The accuracy of the proposed model in predicting the next POI and time-of-arrival in Scheme 2 is lower compared to Scheme 1. This may be because the transition between POIs is a consequential behaviour of time in Scheme 2, which limits the flexibility of the model in predicting the next POI based on the current or past state. In Scheme 2, the accuracy of the proposed model for each time segment is around 50%, indicating. This result suggests that the proposed model may not be suitable for predicting POI transitions in scenarios where time is the primary factor driving the transition.
Figure 7. predicted model accuracy of each POIs for Scheme 2.
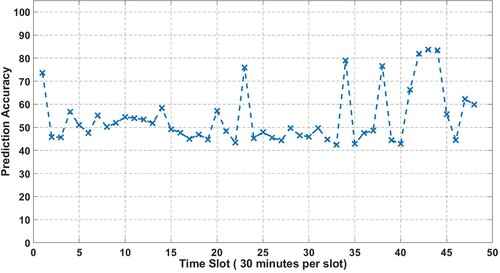
Overall, these findings suggest that the HMM-based predictor may be better suited for predicting POI transitions in scenarios where the transition is not solely dependent on time, such as in Scheme 1, where the transition depends on the user's current location and mobility pattern. To elaborate further, the lower accuracy of the proposed HMM-based predictor in Scheme 2 can be attributed to the fact that the transition between POIs is a consequential behaviour of time. In other words, in Scheme 2, the user's mobility from one POI to the next is primarily determined by the passage of time, rather than their current location or mobility pattern. This limits the flexibility of the model in predicting the next POI based on the current or past state, which may explain why the accuracy of the model in Scheme 2 is lower compared to Scheme 1.
5.3. Evaluating model performance: parameter convergence
To evaluate the performance, we checked the convergence patterns regarding six different POIs in four selected time slots obtained from the proposed algorithm in Scenario 1. Furthermore, to assess the accuracy of the proposed algorithm, we compared the predicted probabilities of the next location of users obtained from our model with the actual locations visited by users, denoted as A, B, and Pi. In addition to the evaluation of convergence patterns for the six different POIs in four selected time slots, we also tested the performance of the proposed algorithm on other randomly selected POIs (4,9,12,22,32,47). The time slot selection is based on peak hour, the first time slot is from 08:00-08:30, the second time slot is 12:00–12:30, the third time slot is 16:00-16:30, and the final time slot is from 20:00-20:30. We found that for all the tested POIs, after seven iterations, the convergence patterns were the same. This indicates the stability and consistency of the proposed algorithm in predicting the next location of users based on their trajectories. Figure shows the convergence of the parameters in each time slot.
Figure 8. Parameters convergence in four different time slots (30 min per slot).
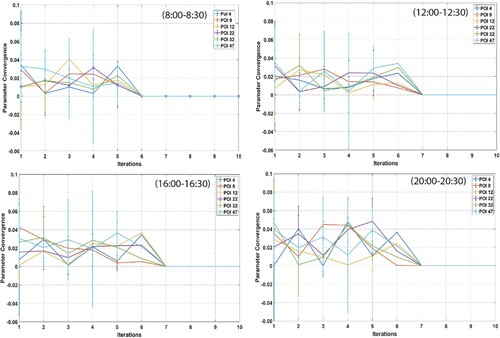
It is worth noting that the POIs were selected randomly, and four out of six POIs were related to public places, while the remaining two were related to home clusters. This diversity in POIs adds to the validity and generalizability of the proposed algorithm as it can accurately predict the next location of users regardless of their destination type. The performance evaluation of the proposed algorithm was not limited to the six different POIs in the four selected time slots mentioned earlier. In fact, the evaluation was tested to include other randomly selected POIs.
To check the stability and consistency of the proposed algorithm in predicting the next location of users based on their trajectories, the convergence patterns of the algorithm's parameters were analysed for each of the additional POIs. The results of this analysis showed that the convergence patterns for these POIs were the same as the patterns observed for the original six POIs, after seven iterations.
Therefore, the performance of the proposed algorithm was found to be consistent and reliable, not only for the initial set of POIs, but also for the additional randomly selected POIs. This further strengthens the validity and generalizability of the algorithm's predictions and confirms its effectiveness in predicting human mobility patterns, using GPS tracking datasets. Overall, the proposed algorithm has demonstrated its effectiveness in predicting human mobility patterns using GPS tracking datasets. Its fast convergence and high accuracy make it a valuable tool for various applications, such as urban planning, transportation management, and location-based services. Regarding Figure , where all POIs seem to converge at the same iteration, it's important to note that this convergence indicates the optimization of the model's parameters for the selected POIs across the dataset. The convergence at a similar iteration suggests a consistency in the model's learning across different POIs, which can be a positive indicator of the model's stability and reliability.
Comparing different time slots is crucial to understand how the model's performance varies across different times of the day, as human mobility patterns are often time-dependent. This comparison aims to provide insights into the temporal dynamics of mobility, which is a key aspect of accurately predicting human movements.
6. Comparative analysis of model performance
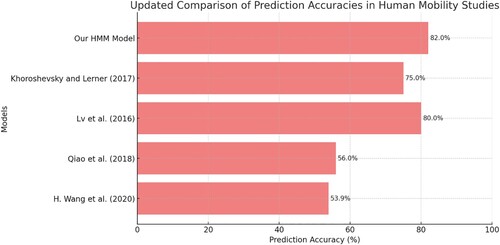
This section provides a comparative evaluation of our HMM model's accuracy in predicting human mobility patterns against other models reported in recent literature, all using the same GPS dataset as utilized in our study. Our HMM model exhibits 82% accuracy, showing its strength, especially in structured mobility patterns. Such comparisons not only highlight the strengths of our model but also provide insights into the evolving landscape of mobility prediction methodologies. H. Wang et al. (Citation2020), introduces a multi-task learning-based algorithm for human mobility prediction. By leveraging similarities among users’ mobility patterns, the algorithm achieves an impressive prediction accuracy of 53.9% on average and 73.2% for users with high-quality mobility data.
Qiao et al. (Citation2018)'s hybrid approach combines the strengths of Markov models with individual pattern recognition, achieving 56% accuracy. This reflects the model's adaptability to diverse mobility behaviours. Lv et al. (Citation2016). further the application of HMM by integrating lifestyle habits, illustrating the model's versatility in understanding human mobility with accuracy of 80%. The accuracy achieved by Khoroshevsky and Lerner (Citation2017) is around 75%, with a focus on individual data, highlights the potential of personalized prediction. In this context, our HMM model stands out with its 82% accuracy, offering a robust solution that balances computational efficiency with high predictive power, especially suitable for structured and cyclic mobility patterns. These comparisons not only validate our model's effectiveness but also contribute to a more comprehensive understanding of current trends and challenges in mobility prediction research. Figure visually represents the prediction accuracies of various models in the field of human mobility prediction, all within the context of the same GPS dataset used in our study.
Figure 9. Comparative analysis of prediction accuracies in human mobility studies.
7. Conclusion
In this paper, we predict the human mobility for spatial–temporal and next-place predictions, by investigating the potential of using HMMs with two schemes. The two schemes in this paper refer to different ways of building the models and evaluating their accuracy. In Scheme 1, time slot is the observable variable, and POI is set as a latent variable, whereas in Scheme 2, POI is the observable variable and time slot is set as a latent variable. Scheme 1 considers people's mobility as an intrinsic behaviour with temporal features as a passive reflection, while Scheme 2 regards the transition between POIs as a consequential behaviour of time. Both schemes aim to make next-POI and time-of-arrival predictions based on the current or past state of the model. The specifications for each scheme are symmetric and the probabilities for each scenario are expressed for both schemes. The purpose of the study is to evaluate which scheme has a greater effect on the accuracy of the model. The investigation applied a large-scale and detailed dataset of human mobility that was collected from a GPS tracking method.
The results reveal that HMM is feasible in predicating human mobility based on GPS tracking data. The accuracy of the spatio-temporal mobility prediction from HMM depends on the design of schemes. This paper has validated that the HMM model worked both in the scheme of predicting next-location and in the scheme of predicting time-of-arrival.
Users with short trajectories are better modelled from the spatial–temporal perspective and could achieve more than 80% of accuracy in order to identify the time of arrival. Predicting the next location provides an efficient way to model human mobility for those leading highly mobile lives. One of the key findings of this study is that the proposed HMM model is effective in predicting the time of arrival for users with regular mobility patterns and short traces. Our results show that the spatial–temporal perspective of the HMM model can achieve an accuracy rate of over 80% in identifying the time of arrival. This finding is particularly useful for applications, such as transportation management and location-based services, where predicting the time of arrival is critical for providing timely and efficient services to users. In conclusion, this paper offers valuable insights on the feasibility of using HMMs on modelling human mobility patterns. The findings can be useful in various applications, including urban planning, transportation management, and location-based services.
We found that increasing the number of iterations beyond a certain point did not significantly improve the accuracy of the algorithm, while increasing the size of the data window led to improved accuracy but also increased computation time. Additionally, we observed that adjusting the learning rate had a significant impact on the speed of convergence and the stability of the algorithm. The parameter evaluation provided valuable insights into the trade-offs between accuracy and efficiency in the proposed algorithm and allowed us to fine-tune its performance for optimal results.
For future studies, it also suggests that the factor of transportation modes and the length of user traces should be taken into consideration. Furthermore, in order to compare the suggested model with existing traditional prediction algorithms, substantial experimental assessments on a range of datasets need be carried out. These assessments should provide quantitative and qualitative comparisons between the model and traditional prediction algorithms in terms of prediction accuracy, time complexity, energy use, and resource utilization. By understanding the relationship between human mobility patterns and the environment, researchers and policymakers can develop more effective strategies to manage and optimize urban mobility.
Disclosure statement
No potential conflict of interest was reported by the author(s).
References
- Abbar, Sofiane, Tahar Zanouda, Noora Al-Emadi, and Rachida Zegour.2018. “City of the People, for the People: Sensing Urban Dynamics via Social Media Interactions.” In Social Informatics. SocInfo 2018. Lecture Notes in Computer Science. Vol. 11186, edited by S. Staab, O. Koltsova, and D. Ignatov. Cham: Springer. https://doi.org/10.1007/978-3-030-01159-8_1.
- Alis, Christian, Erika Fille Legara, and Christopher Monterola. 2021. “Generalized Radiation Model for Human Migration.” Scientific Reports 11 (1): 22707. https://doi.org/10.1038/s41598-021-02109-1.
- Alvarez-Garcia, J. A., J. A. Ortega, L. Gonzalez-Abril, and F. Velasco. 2010. “Trip Destination Prediction Based on Past GPS Log Using a Hidden Markov Model.” Expert Systems with Applications 37 (12): 8166–8171. doi:https://doi.org/10.1016/j.eswa.2010.05.070.
- Ashbrook, Daniel, and Thad Starner. 2003. “Using GPS to Learn Significant Locations and Predict Movement across Multiple Users.” Personal and Ubiquitous Computing 7 (5): 275–286. https://doi.org/10.1007/s00779-003-0240-0.
- Barbosa, Hugo, Marc Barthelemy, Gourab Ghoshal, Charlotte R. James, Maxime Lenormand, Thomas Louail, Ronaldo Menezes, José J. Ramasco, Filippo Simini, and Marcello Tomasini. 2018. “Human Mobility: Models and Applications.” Physics Reports 734: 1–74. https://doi.org/10.1016/j.physrep.2018.01.001.
- Barth, Dominique, Samir Bellahsene, and Leïla Kloul. 2011. “Mobility Prediction Using Mobile User Profiles.” In 2011 IEEE 19th Annual International Symposium on Modelling, Analysis, and Simulation of Computer and Telecommunication Systems, 286–294. IEEE.
- Bellahsene, Samir, and Leila Kloul. 2010. “A New Markov-Based Mobility Prediction Algorithm for Mobile Networks.” In European Performance Engineering Workshop, 37–50. Berlin, Heidelberg: Springer.
- Benmansour, Asma, Abdelhamid Bouchachia, and Mohammed Feham. 2017. “Modeling Interaction in Multi-Resident Activities.” Neurocomputing 230: 133–142. doi:https://doi.org/10.1016/j.neucom.2016.05.110.
- Bishop, Christopher M, and Nasser M Nasrabadi. 2006. Pattern Recognition and Machine Learning. Vol. 4. New York: Springer-Verlag.
- Campello, Ricardo J G B, Davoud Moulavi, and Jörg Sander. 2013. “Density-Based Clustering Based on Hierarchical Density Estimates.” In Pacific-Asia Conference on Knowledge Discovery and Data Mining, 160–172. Heidelberg : Springer.
- Campello, Ricardo J G B, Davoud Moulavi, Arthur Zimek, and Jörg Sander. 2015. “Hierarchical Density Estimates for Data Clustering, Visualization, and Outlier Detection.” ACM Transactions on Knowledge Discovery from Data (TKDD) 10 (1): 1–51. https://doi.org/10.1145/2733381
- Clift, Roland, Angela Druckman, Ian Christie, Christopher Kennedy, and James Keirstead. 2015. “Urban Metabolism: A Review in the UK Context.” Foresight Future of Cities Project.
- Dang, Weizhen, Haibo Wang, Shirui Pan, Pei Zhang, Chuan Zhou, Xin Chen, and Jilong Wang. 2022. “Predicting Human Mobility via Graph Convolutional Dual-Attentive Networks.” In Proceedings of the Fifteenth ACM International Conference on Web Search and Data Mining, 192–200.
- Desa, U N. 2014. “World Urbanization Prospects: The 2014 Revision, Highlights.” Retrieved from United Nations-Department of Economic and Social Affairs. Available Online: Http://Esa. Un. Org/Unpd/Wup/Highlights/WUP2014-Highlights. Pdf (Accessed on 9 August 2016).
- Dhakal, Shobhakar. 2009. “Urban Energy Use and Carbon Emissions from Cities in China and Policy Implications.” Energy Policy 37 (11): 4208–4219. https://doi.org/10.1016/j.enpol.2009.05.020.
- Feng, Jie, Yong Li, Chao Zhang, Funing Sun, Fanchao Meng, Ang Guo, and Depeng Jin. 2018. “Deepmove: Predicting Human Mobility with Attentional Recurrent Networks.” In Proceedings of the 2018 World Wide Web Conference, 1459–1468. https://doi.org/10.1145/3178876.3186058
- Ferreira, Flora, Weronika Wojtak, Carlos Fernandes, Pedro Guimarães, Sérgio Monteiro, Estela Bicho, and Wolfram Erlhagen. 2021. “Dynamic Identification of Stop Locations from GPS Trajectories Based on Their Temporal and Spatial Characteristics.” In International Conference on Artificial Neural Networks. Lecture Notes in Computer Science. Vol. 12894, 347–359. Lecture Notes in Computer Science(), vol 12894. Cham: Springer.
- Gogate, Vibhav, Rina Dechter, Bozhena Bidyuk, Craig Rindt, and James Marca. 2012. “Modeling Transportation Routines Using Hybrid Dynamic Mixed Networks.” ArXiv Preprint ArXiv:1207.1384.
- Gong, Hongmian, Cynthia Chen, Evan Bialostozky, and Catherine T Lawson. 2012. “A GPS/GIS Method for Travel Mode Detection in New York City.” Computers, Environment and Urban Systems 36 (2): 131–139. https://doi.org/10.1016/j.compenvurbsys.2011.05.003.
- Hong, Inho, Woo-Sung Jung, and Hang-Hyun Jo. 2019. “Gravity Model Explained by the Radiation Model on a Population Landscape.” PLoS One 14 (6): e0218028.
- Huang, Haosheng, Yi Cheng, and Robert Weibel. 2019. “Transport Mode Detection Based on Mobile Phone Network Data: A Systematic Review.” Transportation Research Part C: Emerging Technologies 101: 297–312. https://doi.org/10.1016/j.trc.2019.02.008
- Jaradat, Ghadeer A, Mohammad A Alzubaidi, and Mwaffaq Otoom. 2022. “A Novel Human-Vehicle Interaction Assistive Device for Arab Drivers Using Speech Recognition.” IEEE Access 2022 (10): 127514–127529. https://doi.org/10.1109/ACCESS.2022.3226539.
- Jitta, Aditya, and Arto Klami. 2017. “Partially Hidden Markov Models for Privacy-Preserving Modeling of Indoor Trajectories.” Neurocomputing 266: 196–205. doi:https://doi.org/10.1016/j.neucom.2017.05.035.
- Johari, Fatemeh, Giuseppe Peronato, Paria Sadeghian, Xiaoyun Zhao, and Joakim Widén. 2020. “Urban Building Energy Modeling: State of the Art and Future Prospects.” Renewable and Sustainable Energy Reviews 128: 109902. https://doi.org/10.1016/j.rser.2020.109902.
- Kato, Haruka. 2021. “Development of a Spatio-Temporal Analysis Method to Support the Prevention of COVID-19 Infection: Space-Time Kernel Density Estimation Using GPS Location History Data.” In Urban Informatics and Future Cities. The Urban Book Series, 51–67. Cham: Springer.
- Khoroshevsky, Faina, and Boaz Lerner. 2017. “Human Mobility-Pattern Discovery and next-Place Prediction from GPS Data.” In Multimodal Pattern Recognition of Social Signals in Human-Computer-Interaction: 4th IAPR TC 9 Workshop, MPRSS 2016, Cancun, Mexico, December 4, 2016, Revised Selected Papers 4, 24–35. Springer.
- Kim, Dong Yup, and Ha Yoon Song. 2018. “Method of Predicting Human Mobility Patterns Using Deep Learning.” Neurocomputing 280: 56–64. doi:https://doi.org/10.1016/j.neucom.2017.07.069.
- Lam, William H K, Hong K Lo, and S. C. Wong. 2013. “Transportation Network Reliability.” Transportmetrica B: Transport Dynamics 1 (3): 171–173. https://doi.org/10.1080/21680566.2013.874218.
- Lanzaro, Gabriel, Tarek Sayed, and Rushdi Alsaleh. 2022. “Can Motorcyclist Behavior in Traffic Conflicts Be Modeled? A Deep Reinforcement Learning Approach for Motorcycle-Pedestrian Interactions.” Transportmetrica B: Transport Dynamics 10 (1): 396–420. https://doi.org/10.1080/21680566.2021.2004954.
- Lenormand, Maxime, Aleix Bassolas, and José J. Ramasco. 2016. “Systematic Comparison of Trip Distribution Laws and Models.” Journal of Transport Geography 51: 158–169. https://doi.org/10.1016/j.jtrangeo.2015.12.008.
- Lenormand, Maxime, Sylvie Huet, Floriana Gargiulo, and Guillaume Deffuant. 2012. “A Universal Model of Commuting Networks.” PLoS One 7 (10): e45985. https://doi.org/10.1371/journal.pone.0045985.
- Li, Mingxiao, Song Gao, Feng Lu, and Hengcai Zhang. 2019. “Reconstruction of Human Movement Trajectories from Large-Scale Low-Frequency Mobile Phone Data.” Computers, Environment and Urban Systems 77: 101346. doi:https://doi.org/10.1016/j.compenvurbsys.2019.101346.
- Li, Linbo, Yang Li, and Daiheng Ni. 2021. “Incorporating Human Factors into LCM Using Fuzzy TCI Model.” Transportmetrica B: Transport Dynamics 9 (1): 198–218. https://doi.org/10.1080/21680566.2020.1837033.
- Liang, Xiao, Jichang Zhao, Li Dong, and Ke Xu. 2013. “Unraveling the Origin of Exponential Law in Intra-Urban Human Mobility.” Scientific Reports 3: 2983. https://doi.org/10.1038/srep02983.
- Lo, Hong K, and Agachai Sumalee. 2013. “Transport Dynamics: Its Time Has Come!.” Transportmetrica B: Transport Dynamics 1 (1): 1–2. https://doi.org/10.1080/21680566.2013.787659.
- Loo, Becky P Y, Feiyang Zhang, Janet H Hsiao, Antoni B Chan, and Hui Lan. 2021. “Applying the Hidden Markov Model to Analyze Urban Mobility Patterns: An Interdisciplinary Approach.” Chinese Geographical Science 31 (1): 1–13. https://doi.org/10.1007/s11769-021-1173-0.
- Lv, Qiujian, Yuanyuan Qiao, Nirwan Ansari, Jun Liu, and Jie Yang. 2016. “Big Data Driven Hidden Markov Model Based Individual Mobility Prediction at Points of Interest.” IEEE Transactions on Vehicular Technology 66 (6): 5204–5216.
- Ma, Zhenliang, and Pengfei Zhang. 2022. “Individual Mobility Prediction Review: Data, Problem, Method and Application.” Multimodal Transportation 1 (1): 100002. https://doi.org/10.1016/j.multra.2022.100002.
- Malzer, Claudia, and Marcus Baum. 2020. “A Hybrid Approach to Hierarchical Density-Based Cluster Selection.” In 2020 IEEE International Conference on Multisensor Fusion and Integration for Intelligent Systems (MFI),, 223–228. Karlsruhe, Germany: IEEE.
- Masucci, A. Paolo, Joan Serras, Anders Johansson, and Michael Batty. 2013. “Gravity versus Radiation Models: On the Importance of Scale and Heterogeneity in Commuting Flows.” Physical Review E - Statistical, Nonlinear, and Soft Matter Physics 88 (2): 1–8. https://doi.org/10.1103/PhysRevE.88.022812.
- Mathew, Wesley, Ruben Raposo, and Bruno Martins. 2012. “Predicting Future Locations with Hidden Markov Models.” In Proceedings of the 2012 ACMConference on Ubiquitous Computing, 911–918. New York, NY, United States: Association for Computing Machinery. https://doi.org/10.1145/2370216.2370421.
- McInnes, Leland, John Healy, and Steve Astels. 2017. “Hdbscan: Hierarchical Density Based Clustering.” The Journal of Open Source Software 2 (11): 205. https://doi.org/10.21105/joss.00205.
- Mo, Baichuan, Zhan Zhao, Haris N Koutsopoulos, and Jinhua Zhao. 2021. “Individual Mobility Prediction in Mass Transit Systems Using Smart Card Data: An Interpretable Activity-Based Hidden Markov Approach.” IEEE Transactions on Intelligent Transportation Systems 23 (8): 12014–12026.
- Mohammadi, Neda, and John E Taylor. 2017. “Urban Energy Flux: Spatiotemporal Fluctuations of Building Energy Consumption and Human Mobility-Driven Prediction.” Applied Energy 195: 810–818. https://doi.org/10.1016/j.apenergy.2017.03.044
- Molloy, Joseph, Alberto Castro, Thomas Götschi, Beaumont Schoeman, Christopher Tchervenkov, Uros Tomic, Beat Hintermann, and Kay W Axhausen. 2022. “The MOBIS Dataset: A Large GPS Dataset of Mobility Behaviour in Switzerland.” Transportation. Springer 50 (5): 1–25.
- Namdarpour, Farnoosh, Mahmoud Mesbah, Amir H Gandomi, and Behrang Assemi. 2022. “Using Genetic Programming on GPS Trajectories for Travel Mode Detection.” IET Intelligent Transport Systems 16 (1): 99–113. https://doi.org/10.1049/itr2.12132.
- Ni, Daiheng, Linbo Li, Haizhong Wang, and Chaoqun Jia. 2017. “Observations on the Fundamental Diagram and Their Interpretation from the Human Factors Perspective.” Transportmetrica B: Transport Dynamics 5 (2): 159–176. https://doi.org/10.1080/21680566.2016.1190673.
- Peng, Yusheng, Gaofeng Zhang, Jun Shi, Benzhu Xu, and Liping Zheng. 2022. “SRAI-LSTM: A Social Relation Attention-Based Interaction-Aware LSTM for Human Trajectory Prediction.” Neurocomputing 490: 258–268. doi:https://doi.org/10.1016/j.neucom.2021.11.089.
- Qiao, Yuanyuan, Zhongwei Si, Yanting Zhang, Fehmi Ben Abdesslem, Xinyu Zhang, and Jie Yang. 2018. “A Hybrid Markov-Based Model for Human Mobility Prediction.” Neurocomputing 278: 99–109. doi:https://doi.org/10.1016/j.neucom.2017.05.101.
- Sá, Thiago Hérick de, Phil Edwards, Rafael Henrique Moraes Pereira, and Carlos Augusto Monteiro. 2019. “Right to the City and Human Mobility Transition: The Case of São Paulo.” Cities 87 (April): 60–67. https://doi.org/10.1016/J.CITIES.2018.12.024.
- Sadeghian, Paria, Johan Håkansson, and Xiaoyun Zhao. 2021. “Review and Evaluation of Methods in Transport Mode Detection Based on GPS Tracking Data.” Journal of Traffic and Transportation Engineering (English Edition) 8 (4): 467–482. doi:https://doi.org/10.1016/j.jtte.2021.04.004.
- Sadeghian, Paria, Xiaoyun Zhao, Arman Golshan, and Johan Håkansson. 2022. “A Stepwise Methodology for Transport Mode Detection in GPS Tracking Data.” Travel Behaviour and Society 26 (January): 159–167. doi:https://doi.org/10.1016/j.tbs.2021.10.004.
- Schläpfer, Markus, Lei Dong, Kevin O’Keeffe, Paolo Santi, Michael Szell, Hadrien Salat, Samuel Anklesaria, Mohammad Vazifeh, Carlo Ratti, and Geoffrey B West. 2021. “The Universal Visitation Law of Human Mobility.” Nature 593 (7860): 522–527. https://doi.org/10.1038/s41586-021-03480-9.
- Shen, Chengze, Minhyuk Park, and Tandy Warnow. 2022. “WITCH: Improved Multiple Sequence Alignment Through Weighted Consensus Hidden Markov Model Alignment.” Journal of Computational Biology 29 (8): 782–801. https://doi.org/10.1089/cmb.2021.0585.
- Simini, Filippo, Amos Maritan, and Zoltán Néda. 2013. “Human Mobility in a Continuum Approach.” PLoS One 8 (3): e60069. https://doi.org/10.1371/journal.pone.0060069.
- Song, Libo, Udayan Deshpande, Ulaş C Kozat, David Kotz, and Ravi Jain. 2006. Predictability of WLAN Mobility and Its Effects on Bandwidth Provisioning.”.
- Song, Libo, David Kotz, Ravi Jain, and Xiaoning He. 2006. “Evaluating Next-Cell Predictors with Extensive Wi-Fi Mobility Data.” IEEE Transactions on Mobile Computing 5 (12): 1633–1649. https://doi.org/10.1109/TMC.2006.185.
- Sun, Michael H, and Douglas M Blough. 2007. “Mobility Prediction Using Future Knowledge.” In Proceedings of the 10th ACM Symposium on Modeling, Analysis, and Simulation of Wireless and Mobile Systems, 235–239.
- Tao, Shuo, Jingang Jiang, Defu Lian, Kai Zheng, and Enhong Chen. 2021. “Predicting Human Mobility with Reinforcement-Learning-Based Long-Term Periodicity Modeling.” ACM Transactions on Intelligent Systems and Technology (TIST) 12 (6): 1–23.
- Wang, Bao, Linjie Gao, and Zhicai Juan. 2018. “Travel Mode Detection Using GPS Data and Socioeconomic Attributes Based on a Random Forest Classifier.” IEEE Transactions on Intelligent Transportation Systems 19 (5): 1547–1558. https://doi.org/10.1109/TITS.2017.2723523.
- Wang, Huandong, Sihan Zeng, Yong Li, Pengyu Zhang, and Depeng Jin. 2020. “Human Mobility Prediction Using Sparse Trajectory Data.” IEEE Transactions on Vehicular Technology 69 (9): 10155–10166. https://doi.org/10.1109/TVT.2020.3002222.
- Wong, R. C. P., W. Y. Szeto, S. C. Wong, and Hai Yang. 2014. “Modelling Multi-Period Customer-Searching Behaviour of Taxi Drivers.” Transportmetrica B: Transport Dynamics 2 (1): 40–59. https://doi.org/10.1080/21680566.2013.869187.
- Xia, Chen, Yuqing Hu, and Jianli Chen. 2023. “Community Time-Activity Trajectory Modeling Based on Markov Chain Simulation and Dirichlet Regression.” Computers, Environment and Urban Systems 100: 101933. doi:https://doi.org/10.1016/j.compenvurbsys.2022.101933.
- Xu, Wenfei. 2018. “Urban Explorations: Analysis of Public Park Usage Using Mobile GPS Data.” ArXiv Preprint ArXiv:1801.01921.
- Xu, Yang, Dan Zou, Sangwon Park, Qiuping Li, Suhong Zhou, and Xinyu Li. 2022. “Understanding the Movement Predictability of International Travelers Using a Nationwide Mobile Phone Dataset Collected in South Korea.” Computers, Environment and Urban Systems 92: 101753. doi:https://doi.org/10.1016/j.compenvurbsys.2021.101753.
- Yang, Yingxiang, Carlos Herrera, Nathan Eagle, and Marta C. González. 2014. “Limits of Predictability in Commuting Flows in the Absence of Data for Calibration.” Scientific Reports 4: 1–9. https://doi.org/10.1038/srep05662.
- Yao, Yuhao, Haoran Zhang, and Qi Chen. 2023. “Trip Segmentation and Mode Detection for Human Mobility Data.” In Handbook of Mobility Data Mining, 97–115. Elsevier.
- Yazdanie, M., and K. Orehounig. 2021. “Advancing Urban Energy System Planning and Modeling Approaches: Gaps and Solutions in Perspective.” Renewable and Sustainable Energy Reviews 137: 110607. https://doi.org/10.1016/j.rser.2020.110607.
- Yun, Meiping, Wenwen Qin, Xiaoguang Yang, and Feiwen Liang. 2019. “Estimation of Urban Route Travel Time Distribution Using Markov Chains and Pair-Copula Construction.” Transportmetrica B: Transport Dynamics 7 (1): 1521–1552. https://doi.org/10.1080/21680566.2019.1637798.
- Zhang, Pengfei, Haris N Koutsopoulos, and Zhenliang Ma. 2023. “DeepTrip: A Deep Learning Model for the Individual Next Trip Prediction With Arbitrary Prediction Times.” IEEE Transactions on Intelligent Transportation Systems 24 (6): 5842–5855. https://doi.org/10.1109/TITS.2023.3252043.
- Zhang, Cen, and Jan-Dirk Schmöcker. 2019. “A Markovian Model of User Adaptation with Case Study of a Shared Bicycle Scheme.” Transportmetrica B: Transport Dynamics 7 (1): 223–236. https://doi.org/10.1080/21680566.2017.1378599.
- Zhou, Fan, Yurou Dai, Qiang Gao, Pengyu Wang, and Ting Zhong. 2021. “Self-Supervised Human Mobility Learning for next Location Prediction and Trajectory Classification.” Knowledge-Based Systems 228: 107214. https://doi.org/10.1016/j.knosys.2021.107214