
Abstract
Novel formulations of nanocomposites derived from ZnO nanoparticles have provided potential biomedical applications as a new strategy for treatment of breast cancer. In this research, two types of ZnO nanomaterials were synthesized by sol–gel hydrothermal process and co-precipitation containing fast quenching and also surface modification methods. The cytotoxic effects on growth of the breast cancer cell lines MCF-7 were evaluated by 3-(4,5-dimethylthiazol-2-yl)-2,5-diphenyl tetrazolium bromide (MTT) assay. Cell viability of the breast cancer cell line MCF-7 was reduced with increasing ZnO nanofluid concentrations at 48 and 72 h of treatment. The IC50 value of MCF-7 cells after 72 h of treatment with the first product ZnO (a) and second one ZnO (c) were measured as 51.02 and 48.63 μg/ml, respectively (P < 0.05).
Introduction
Highly reactive nanoparticles (NPs) and nanomaterials with the size of 1–100 nm that display different physical and chemical behaviors have a wide range of potential applications in biomedical sciences, clinical medicine, and biological systems. Nanotechnology has advanced at each level of medical procedure: molecular imaging, therapeutics, diagnostics, detection, and bioinformatics (Nie et al. Citation2007), and different interesting properties of NPs have opened new windows and insights for a successful future in cancer treatment. Metal nanoparticles, such as extremely small zinc oxide NPs (1–10 nm) and their nanocomposites, are fine semiconductors containing electron vacancies called electron holes in the valance band (Mansur Citation2010), which makes them strong candidates for nanobiotechnology and nanomedicine. The ability of ZnO NPs as preferential anticancer, antibacterial, and UV-blocking agents (Becheri et al. Citation2008) makes them the most diverse family of nanostructures that can be employed for different applications, including breast cancer treatment, due to their low toxicity, biodegradability (Hong et al. Citation2011), and biocompatible nanoplate forms. These are the most promising findings that explore various ways nanotechnology may help treat breast cancer in the future. Zinc oxide quantum dots (QDs) with special and strong band gap energy (a mobile charge carrier) as typical photoluminescent (PL) semiconductor NPs have demonstrated antibacterial and anticancer effects. ZnO QDs can be synthesized in liquid media such as alcohol and become water dispersible by conjugation via functionalized groups such as fatty acids, PEG molecules, organosilanes, and polymers (Hsu et al. Citation2013). Previously, our investigations suggested that various ZnO QDs and NPs with modified morphologies have a great antibiotic activity against many dangerous Gram-negative and -positive bacteria (Fakhroueian et al. Citation2013). Our previous study also demonstrated the anticancer effects of modified ZnO QDs NPs including herbal fatty acids, and biological non-ionic surfactants, against breast and colon cancer lines (Fakhroueian et al. Citation2014). Li Yuan et al. (Citation2014) explored the synergistic effects and mechanisms involved in ZnO NPs cytotoxicity and isoorientin in human hepatoma (HepG2) cells (Yuan et al. Citation2014) and indicated these effects. Mohd Javed Akhtar et al. (Citation2012), Cory Hanley et al. (Citation2008), and Syeda Arooj et al. (Citation2015) showed zinc oxide NPs cause more damage on rapidly dividing human cancer cells than normal cells. For instance, cancerous human T cells were demonstrated to be about 30 times more sensitive to ZnO NPs treatment than normal T cells (Akhtar et al. Citation2012, Arooj et al. Citation2015, Hanley et al. Citation2008). Reactive oxygen species (ROS) generation and oxidative stress have been proposed as common mediators for apoptosis involved in ZnO NPs cytotoxicity (Fakhroueian et al. Citation2013, Fakhroueian et al. Citation2014). Several observations suggested that ZnO NPs may be employed as selective and smart cytotoxic agents for the eradication of cancer cells. In this regard, Aaron Thurber et al. (Citation2012) reported a new method to improve the selective anticancer effects of ZnO NPs using 7.5% Fe doping (Thurber et al. Citation2012). Additionally, ZnO NPs exerted a cytotoxic effect on the human MCF-7 and glioma cell lines, while no cytotoxic effect was observed on normal human cell (Fakhroueian et al. Citation2014; Ostrovsky et al. Citation2009). Recently, Yasumasa Kato et al. (Citation2013) pointed to the extracellular pH of tumor tissues that is often acidic, due to lactate secretion from anaerobic glycolysis. Therefore, an acidic microenvironment is closely associated with tumor metastasis (Kato et al. Citation2013) and plays the role of homeostasis and the immune defense system. This acidic microenvironment can mediate dissolution-induced preferential toxicity of ZnO nanocrystals (NCs) containing SiO2, starch and PEG modifications only against cancer cells with IC50 ≈ 150 μM and, therefore, leaving normal cells unaffected (Sasidharan et al. Citation2011). In fact, it is according to proton dynamics disciplinary for the fight against cancer. Kee Woei Ng et al. (Citation2011) suggested that cellular response may be more effective through endogenous genetic, transcriptomic, and proteomic landscape of the target cells than through the specific nanoparticle properties (Ng et al. Citation2011). Indeed, this comment can be an exciting idea and a concept for application of nanotechnology in medicine. Tianshu Kang et al. (Citation2013) indicated that among three ZnO NPs with different sizes, the smallest (26-nm) showed the highest cytotoxicity to CaCO2 cells. However, 90-nm rather than 62-nm ZnO NPs showed the second highest cytotoxicity. On the other hand, several studies showed that IC50 value increased by increasing the size of ZnO NPs (Fakhroueian et al. Citation2014, Kang et al. Citation2013) and they also demonstrated the cytotoxicity of ZnO NPs was time dependent and does dependent (Prasanth and Gopinath Citation2013). Shantikumar Nair et al. (Citation2009) presented a systematic study of the influence of size scale and surface chemistry which are critical to an understanding of the toxicity mechanisms (Nair et al. Citation2009), and it is clear that the type of target cells is important when considering toxicity of ZnO NPs in human cells. In this study, we synthesized and investigated two new ZnO nanocomposite nanofluids such as (ZnO, ZnO/PVP, nano Ag) was named ZnO (c) and (Ag/Fe/ZnO) as ZnO (a). Also these strong nanoformulations with regard to their cytotoxic effects in human breast cancer cells (MCF-7) were studied and their IC50 value of MCF-7 cells was compared with normal human lung fibroblast cells (MRC-5) after 72 h of treatment. We could also consider the important relationship between physical activities of large bandgap energy with strong diffusion of nanoparticles for the first time in this research.
Methods
Preparation and synthesis of original nanoformulation namely: ZnO (c) by 3 steps
1. Synthesis of hydrophilic ZnO (QDs) NPs andsurface-modification
The first step in preparation of ZnO (c) nanoformulation is the synthesis of ZnO (QDs) NPs by amine hydrolysis of zinc nitrate 6H2O in water–alcohol solution. Amin hydrolysis was done by ethylene diamine solution in the presence of favorable non-ionic surfactants and green fatty acid mixture in critical pH (8–9) at 60–80 °C. The sol–gel and cold-quenching process at 0 °C in an ice bath were performed as reported by previous studies (Fakhroueian et al. Citation2013, Citation2014).
2. Fabrication of ZnO/PVP nanocomposites by sol–gel method assisted by hydrothermal process
In this part, ZnO NPs should be functionalized by polyvinylpyrrolidone (PVP) food polymer, as co-assistant and stabilizer nanomaterial in making original ZnO (c) nanoproduct. About 0.033 mole zinc acetate dihydrate from Merck Company (Kenilworth, NJ) was dissolved in 50 ml distilled water, 20 ml methanol, and 0.5–3 g PVP matrix polymer under vigorous magnetic stirring at 30–40 °C, followed by chilling to 5–10 °C in ice bath. The resulting solution was hydrolyzed by 0.1–0.2 mole warm KOH and ethylene diamine (EDA) solution containing 20 ml methanol, 20 ml ethanol, 15 ml isopropanol, and 30 ml distilled water with dropwise under 60 °C mixing and adjusted at pH 10–11 for 2 h (cold quenching addition). The reaction was maintained for 3–4 h reflux condition, which contained 800 ml total volume by dilution. After refluxing the reaction mixture, 2–4 ml non-ionic surfactant acac (acetylacetone) was added and stored at 70–80 °C in oven for 1 week, owing to generate the complete formation of final precipitation by hydrothermal process (Guo and Yang Citation2000). In order to improve the purification of product, its supernatant was decant and washed several times with cold alcohol and distilled water mixture in ice bath at 0 °C and filtered, evaporated, and finally dried at 85 °C in oven again. The colloidal nanoproduct was obtained by suspending in mixture of alcohol–water solution. Finally, the nanocomposite of ZnO NPs incorporated on PVP substrate was kept at room temperature in dark place.
3. Formulation of final nanoproduct of ZnO (c)
The desired concentration of ZnO (QDs) NPs was dissolved in 10 ml distilled water under vigorous stirring at 40–50 °C for 30 min and ZnO/PVP nanocomposites in 10 ml DEG (diethylene glycol) solvent was added and pH value was kept in acidic condition using HCl 30% (v:v). While mixing continuously at 50–60 °C, mostly 0.01–0.06 g Ag nanometal in 10 ml distilled water was added to increase ZnO NPs surface activity and then the mixture was heated and refluxed at 70–80 °C for 1–2 h 1–2 ml span 80 (sorbitan monooleate) and 0.06–0.2 g PVA (polyvinylalcohol) from Merck (Kenilworth, NJ) as a stabilizer was added and in order to acquire more critical stabilization of nanoproduct, 1–2 ml ethoxylated nonylphenol-10 moles EO as wetting agent (from Kimyagaran Emrooz Company, Tehran, Iran) was also used in 5 ml distilled water mixture and pH was fixed by sodium bicarbonate buffer. The final nanofluid was refluxed for 4–5 h at 70–90 °C and then maintained at 80 °C overnight and evaporated until the original nanosolution reaches to required colloid solution, and kept at 4 °C for 2 d. Our major objective is to show a synergistic energy between the ZnO (QDs) with ZnO/PVP and Ag nanoparticles in nanofluid product.
4. Synthesis of nanocomposites by coprecipitationtechnique, wet chemical, and hydrothermal methods, namely ZnO (a)
The fabrication of ZnO nanocomposites was carried out using 0.06 mole Zn (NO3)2.6H2O and 0.0037 mole FeCl3.6H2O dissolved in alcohol under vigorous stirring at 70–80 °C. The pH was adjusted with alkali while the hydrolysis reaction was carrying out with oleylamine and DEA reagent solutions slowly via dropwise at 80–90 °C and heated to reflux reaction for 5 h. The stirred solution was also contained oleic acid, acac, and sodium oleate suitable surfactants which were added to reaction solution. In the following work, the total volume would necessarily reached to 500 ml. The resulted solution was put in hot air oven at 90–100 °C for 2 d, and then fully evaporated for 1–2 h including 0.3–2 g starch, 0.05–0.1 g polyethylene glycol 6000 (PEG, Merck), and 0.05–0.1 g CMC stabilizer (hydroxy ethyl cellulose, 90%). After complete evaporating, the obtained black precipitation was exposed to ultraviolet light (λ = 250 nm) irradiation for 35 min, and maintained in oven at 100 °C including acidic acid pH value using H3PO4 30% (v: v). It is experimentally found that acidic pH-mediated dissolution of ZnO nanoformulation and associated toxicity have a great importance in cancer management, because it has been shown that tumor microenvironment is highly acidic (Sasidharan et al. Citation2011). In order to employ surface modification process, less than 0.001 mole Ag NPs containing diethylene glycol (DEG) and isopropanol solvents, PVA as strong stabilizer reagent using non-ionic solubilizer Tween 80 (Kimyagaran Emrooz Co., Tehran, Iran) solutions were added to reaction product and were refluxed for 3 h at 85 °C under constant stirring. Finally, the black modified precipitation nanoproduct was washed several times with mixture of cold water/acetone/methanol solutions and then was dried in oven at 100 °C, and calcined at 700–800 °C for 6–8 h in a muffle furnace.
Cell lines and cell culture studies
The human breast cancer cell line (MCF-7) and normal human fibroblast cell line (MRC-5) were obtained from the Pasteur Institute of Iran. The cell lines were grown adherently in RPMI-1640 media supplemented with 10% fetal bovine serum, 100 U/ml of penicillin, and 100 μg/ml of streptomycin and incubated at 37 °C in the presence of 5% CO2 and 95% humid air. Cells were harvested at 70–100% confluence with trypsin / EDTA and were either used fresh or were frozen on liquid nitrogen and stored at −70 °C.
Measurement of 3-(4,5-dimethylthiazol-2-yl)-2,5-diphenyl tetrazolium bromide (MTT) cytotoxicity assay
Cell viability was determined by MTT assay as previously described (Hamzeloo-Moghadam et al. Citation2015). Cells were seeded at 5 × 10³ cells/well in 5% CO2 at 37 °C in RPMI medium (containing 10% FBS, 100 units/ml penicillin and 100 μg/ml streptomycin) in 96-well plates. After incubation overnight to allow for cell attachment, the RPMI medium in each well was replaced with media containing various concentrations of compounds and incubated for 48 and 72 h individually. Afterwards, 20 μl of MTT reagent at 5 mg/ml final concentration added to each well, and 4 h later DMSO (100 μl) was added to dissolve the formed violet formazan crystals within metabolically viable cells. The plates were shaken for an additional 10 min and the absorbance values were read by the microplate reader (Bio-Rad, Hercules, CA) at 570 nm to determine the number of viable cells. Cell viability was calculated as a percentage using the formula: (mean OD of treated cells/mean OD of control cells) × 100. Data were collected from several experiments and the percentage of cell-growth inhibition was determined by comparison with the untreated control cells (Fakhroueian et al. Citation2014). The IC50 values were generated from the dose–response curves for the cell lines (MCF-7).
Statistical analysis
The results of quantitative studies are reported as mean ± SD. IC50 value was determined using Graphpad Prism 5 software (GraphPad Software Inc., San Diego, CA). All experiments were repeated at least three times. To compare data, one-way analysis of variance (ANOVA) with Dunnett’s post-hoc test was used. In all cases, P < 0.05 was taken as the level of significance.
Results of efficient cancer treatment
Anti-proliferative effect of ZnO nanoproducts in human breast cancer cell line by MTT assay
To determine the cytotoxicity effects of ZnO (a) and ZnO (c) on MCF-7 and MRC-5 cell lines, MTT assay was carried out as shown in and . The most significant inhibitory effects of ZnO (a) in MCF-7 cells were 67% and 79% at 1000 μg/ml after treatment for 48 and 72 h, respectively. Similarly, treatment with 1000 μg/ml ZnO(c) caused a reduction of approximately 66% and 73% in cell viability after 48 and 72 h, respectively. The IC50 values (the effective dose that inhibits 50% growth) of MCF-7 cells after 48 h of treatment with ZnO (a) and ZnO (c) were 80.6 and 64.16 μg/ml, respectively (P < 0.05). The half maximal lethal concentration IC50 values were 51.02 and 48.63 μg/ml, respectively, after 72 h of treatment with ZnO (a) and ZnO (c) as shown in .
Figure 1. (a) ZnO (a) and (b) ZnO (c) induced growth inhibition in breast cancer cell line MCF-7. Growth inhibition was assessed using MTT assay. Each value is presented as mean ± SD of three experiments. *P < 0.05; **P < 0.01 compared with the untreated control group.
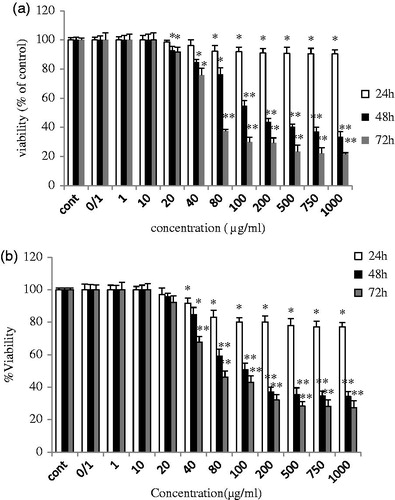
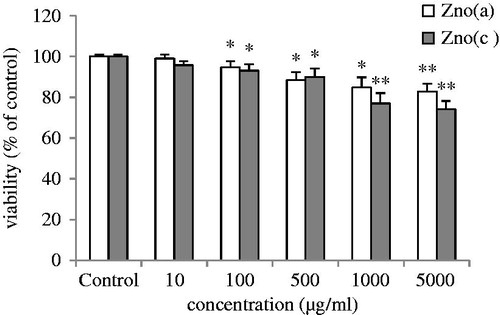
Figure 2. Diagram of (d) shows induced growth inhibition in breast cancer normal human fibroblast cell, MRC-5. ZnO (a) and ZnO (c) inhibited the growth of normal human fibroblast cell line MRC-5, after 72 h of treatment, in a dose-dependent manner with the IC50 values of 194 and 352 μg/ml, respectively. The data revealed that ZnO (a) and ZnO (c) displayed significantly higher cytotoxic effects on cancer cells than on normal cells.
Detection of cytotoxic effects of ZnO (c) and ZnO (a) nanoproducts on normal cells MRC5
MRC-5 and MCF-7 cells at the same passage 18 (P18) were used to plot the growth curve by using the MTT method which is based on the conversion of MTT to formazan crystals by mitochondrial dehydrogenases (Mosmann Citation1983). The cells were plated into 96 well plates, 2 × 10³ cells per well and allowed to attach for 24 h, resulting in log-phase growth at the time of drug treatment. ZnO nanoformulation (c) and ZnO nanocomposites (a) (5, 10, 15, and 20 μg/ml) were added to the wells for 24, 48, and 72 h. After treatment, 10 ml MTT was added to each well. After 4 h of incubation at 37 °C, the solution was removed and the produced formazan was solubilized in 100 ml of dimethyl sulfoxide (DMSO). Absorbance was measured at 550 nm using an automated microplate reader (Bio-Rad, Hercules, CA). The cell viability was expressed as a percentage of the value for control cultures. The cytotoxic effects of safranal on both cell lines were expressed as IC50 values (the drug concentration that reduced the absorbance of treated cells by 50% compared to untreated cells). The growth curve was plotted and the population doubling time of these three cell lines were calculated during the exponential growth phase of the cells in . All experiments were carried out in triplicate.
Investigation of cytotoxicity studies on cancer cell with ZnO (c) and ZnO (a) nanoproducts
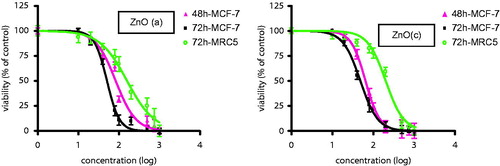
To evaluate the effects of compounds ZnO (a) and ZnO (c) on the viability of the cancer cell line, MTT assay was performed. The MTT viability assay of the compounds showed significant cytotoxicity in a time- and dose-dependent manner on MCF-7 human breast cancer cell line. The IC50 values indicated that ZnO (c) nanoformulation has a higher cytotoxic effect in MCF-7 cells compared with ZnO (a) nanocomposite. In addition, our data reveal that ZnO (a) and ZnO (c) displayed significantly higher cytotoxic effects on cancer cells than on normal standard cell lines. displays three viability (%) versus log (concentration) curves for ZnO (a) and ZnO(c) after 48 and 72 h of treatment comparing with normal human fibroblast cells MRC-5. The nanoproducts had very low effects on the viability of MRC-5 normal cells even at the highest concentration tested (1000 μg/ml), as indicated in . The IC50 value of MRC-5 cells after 72 h of treatment with ZnO (a) and ZnO (c) was 159 and 201 μg/ml, respectively.
Figure 3. Cytotoxicity effect of ZnO (a) and ZnO(c) induced growth inhibition in breast cancer cells MCF-7 and normal human fibroblast cells MRC-5. Growth inhibition was assessed using MTT assay. Each value is presented as mean ± SD of three experiments.
Final consideration of cytotoxicity studies on MCF-7 cancer cells after 48 and 72 h
To evaluate the effects of two nanoproducts of ZnO (a) and ZnO (c) on the viability of the cancer cell line, MTT assay was performed. The MTT viability assay of the compounds showed significant cytotoxicity in a time- and dose-dependent manner on MCF-7 human breast cancer cell line. The IC50 values indicated that ZnO (c) nanoformulation has a higher cytotoxic effect in MCF-7 cells compared with ZnO (a) nanocomposite. In addition, our data reveal that ZnO (a) and ZnO (c) displayed significantly higher cytotoxic effects on cancer cells than on normal standard cell lines. displays the results of MTT assay which derived after 48 and 72 h of treatment, and log IC50 was measured compared with IC50 (μg/ml).
Table 1. IC50 measurement and absorbance of breast MCF7 cancer cell lines after 48 and 72 h.
Morphologic analysis
To observe cells undergoing apoptosis, Hoechst 33258 staining was performed. Briefly, cells were grown in eight-well chamber slides and allowed to adhere. After treatment with ZnO (a) and ZnO (c) for 48 h, cells were fixed with 4% paraformaldehyde for 30 min at room temperature and then washed twice with PBS. Hoechst 33258 (50 ng/ml) was added to the fixed cells, incubated for 30 min at 37 °C in dark, and then washed with PBS. Cells were examined by fluorescence microscopy. Apoptotic cells were identified by their characteristic nuclei condensation, whereas nuclei from normal cells demonstrated a normal uniform chromatin pattern ().
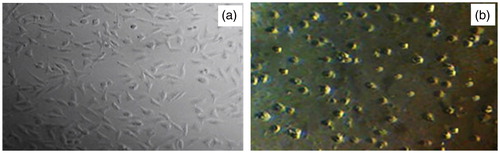
Presentation of cell death as microscopic deformation images before and after using ZnO (c) and ZnO (a)
The observed optical morphological changes are recorded in . Deformation phase formed of cancer cell line MCF-7 textures before and after the addition of ZnO (a) and ZnO (c) nanoproducts by light microscopy method was shown, so optical microscopic observations confirm MTT assay results. MCF-7 cells without any treatment attached to the plate with normal shape (). Treatment with nanoproducts ZnO (a) and ZnO (c) caused significant morphological changes that are signs of cell death and cell membrane disruption after enough time of treatment processing and evident cytotoxicity effect of synthesized nanoproducts ().
Figure 4. Detection of typical features for apoptosis nuclear condensation by Hoechst 33258 staining. MCF-7control (untreated) and treated with 100 μg/ml of ZnO (a) and ZnO (c) were stained with Hoechst 33258.
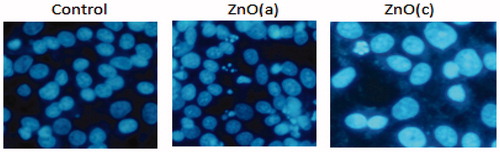
Figure 5. Microscope fluorescence images of (a) original cell lines MCF-7 before any treatment by nanoproducts, and (b) after treatment with influence of ZnO (a) and ZnO (c) nanodrugs caused significant morphological changes which are signs of cell death (the kind of deformation and agglomeration of MCF-7 cancer cell models).
Discussion
Characterization of two ZnO nanoproducts
SEM images of ZnO (c) and ZnO (a)
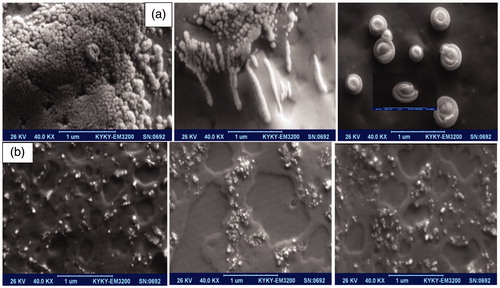
indicates the mixture of nanospherical and nanorod–nanotubes’ morphologies for ZnO(c) nanoformulation and demonstrates interesting photoluminescence of nanospherical in nanocomposites for ZnO (a). Of course the combination of Ag-doped ZnO nanoparticles including Fe2O3 NPs as a conjugated structure could influence in obtaining of surface modification and progressed towards the specific elongated nanoparticle morphologies with homogeneous hexagonal patterns in nanofluid media.
Figure 6. Presentation of various kinds of SEM pictures of ZnO (c) nanoformulation containing (a) fine nanospherical-shaped, nanorod–nanotubes mixture, and rare beautiful snail-shaped images with functionalized surface, (b) the luminance nanoparticles through the extended nanorods in ZnO (a) nanocomposites along with homogeneous pattern.
FTIR spectroscopy of two ZnO (c) and ZnO (a) nanoproducts’ structures
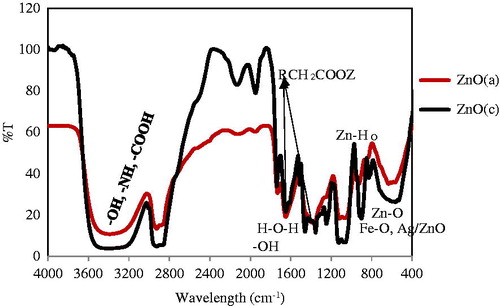
The defect and impurity content in these materials were characterized by Fourier transfer infrared spectroscopy. FTIR spectra are investigated fundamentally in the region of 400–4000 cm−1 at room conditions for ZnO (c) sample in KBr matrix which was recorded on a Bruker Co. model Tensor 27 (Bruker Co., Billerica, MA). It represented two peaks located at 565 and 592 cm−1 that correspond to the E2 mode of hexagonal Zn–O stretching bond, the bands at 520–499 cm−1 may be associated with oxygen deficiency and/or oxygen vacancy (VO) defect complex in ZnO NPs (Xiong et al. Citation2006) and deformation vibration for Ag/ZnO, respectively. Due to the synergistic effect of silver and zinc oxide NPs these peaks overlapped and so their wavelengths were barely displaced (Fakhroueian et al. Citation2013, Fakhroueian et al. Citation2014, Xiong et al. Citation2006). It is clear that metal oxides generally give absorption bands in fingerprint region in below 1000 cm−1. The broad band at 3390 cm−1 was allocated to the O–H water, –NH amine groups, and –COOH carboxylic acid stretching bands. The peak at 1654 cm−1 is corresponding to H–O–H stretching vibration and –OH bending of water in product formulation. FTIR spectroscopy for ZnO (a) also is shown in which contains three week absorption peaks at 569 cm−1, 602, and 633 cm−1 arising from the stretching bonding of Zn–O, Fe–O, and Ag/ZnO with some minor differences in overlapping absorption bonds (Fakhroueian et al. Citation2014, Jafari et al. Citation2011, Rahman et al. Citation2013).The broad and sharp absorption band at 3391 cm−1 could be assigned as the stretching vibration of –OH group in water over the surface of nanocomposites and –NH stretching vibration mode. The band at 1650 cm−1 is attributed to the asymmetric and water tensional tremble δ (H–O–H). The peaks observed at 1635 and 1356 cm−1 are assigned to the asymmetrical and the symmetrical stretching of zinc carboxylate, respectively. Peaks between 2930 and 2862 cm−1 are due to C–H stretching vibration of alkane groups. Two sharp peaks at 868–956 cm−1 showed lattice Zn–HO mode.
Figure 7. FTIR important spectroscopy of two nano products of ZnO (c) (black curve) and ZnO (a) with red line. It could characterized all the vacancy defect.
UV–Vis absorbance spectrum for two nanoproducts ZnO (c) and ZnO (a)
The optical characterization of two samples was recorded on UV–Vis absorption spectrophotometer. demonstrates the UV–Vis (Perkin Elmer model lambda 35, Perkin Elmer Inc., Shelton, CT) absorption spectroscopy of typical absorption peaks for ZnO (c) and ZnO (a) nanoproducts as a function of wavelength in distilled water solvent between λ = 200–600 nm.
Figure 8. UV-Vis absorption spectra of two nanoproducts, ZnO(c) with black line and ZnO (a) with red one in blue shifts experimental conditions. ZnO (c) shows higher intensity compared to ZnO (a) in UV-Vis curve
ZnO (c) showed three intensive absorbances at 213.3, 226.2, and 275.5 nm while ZnO (a) indicated three absorptions at 214.1, 221.9, and 328 nm. The excitonic absorption peaks of the samples are at about 275.5 and 328.0 nm absorption at 213.3, 226.2, and 214.1, 221.9 nm indicate higher QDs excitations of them. Moreover, wide band gap, surface trapping states, oxygen vacancies, high surface area, effective nanoporous, and modified surface defects are the best major characteristics of these NPs (Fakhroueian et al. Citation2013). The wide band gap values of ZnO (c) and ZnO (a) were measured as 4.19 and 3.47 eV, respectively. Therefore, they demonstrate very high surface energy and undergo a significant UV–Vis absorption spectroscopy. In addition, regarding to the large number of defects (oxygen vacancies/interstitials) on modified surface and effective surface area (BET) of ZnO NPs can trap bacteria and major functional groups of plasma membrane proteins in cancerous cells and also react to different types of infection diseases during diffusion process and electrostatic interactions in the reaction mechanism. These were strongly correlated to the ability of ZnO (QDs) NPs to induce reactive oxygen radicals, oxidative stress, and inflammation (Mallika et al. Citation2015, Wahab et al. Citation2014).
Photoluminescence spectrum of two nanoproducts of for ZnO (c) and ZnO (a)
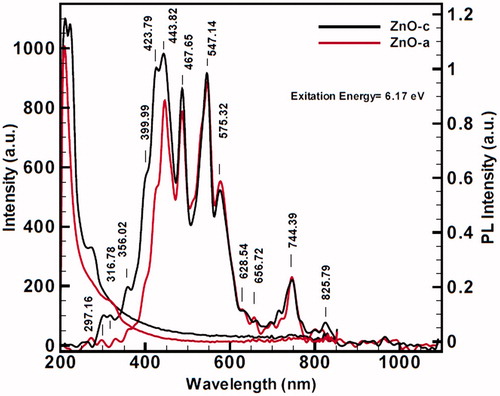
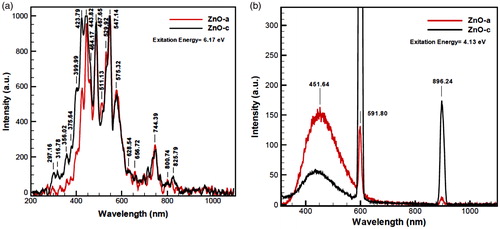
The photoluminescence (PL) spectra were carried out at room temperature under the illumination of 201 nm equal to 6.17 eV, to obtain PL emission spectra for ZnO (a) and ZnO(c) in . The peaks in between 300 and 850 nm are the signature of trapping states and their intensities are corresponding to electron density of these states. These states are mostly near conduction bond due to existence of more amounts of electrons rather than holes. Also, existence of these trapping states exceeds the electron–hole recombination time. This longer recombination time means more opportunity for electrons and holes to reduction and oxidation, respectively. These states are due to very strong and especial point defects and we believe that this occurs because of the formation of nanoparticles surface defect complexes which belong to the oxygen-deficient region. The quantum confinement effects from ZnO QDs are well confirmed by the optical adsorption and PL spectra ( and ).
Figure 9. Schematic overview of relevant photoluminescence diagram, optical adsorption, and ZnO NPs’ characteristics and their effects on nanotoxicological properties including wide band gap with more trapping states containing high excitation energies.
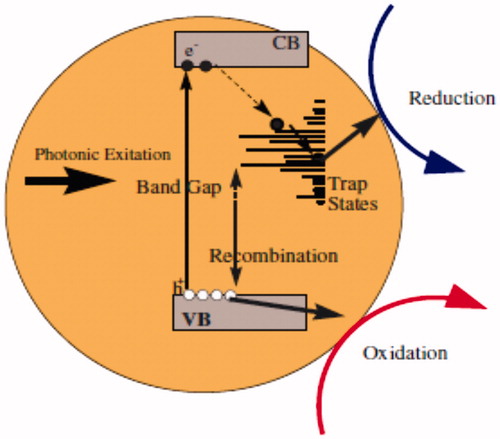
Figure 10. Photoluminescence (PL) spectrum of red color ZnO (a) and black color ZnO (c) in 200–1000 nm, including many blue and red shifts with high excitation energies, (a) contains 6.17 excitation energy (λ = 201 nm), and photoluminescence expansion spectra for (b) contains 4.13 eV excitation energy. PL spectra also indicate broad saturations for strong surface functionalization for two nanoproducts. In (a), ZnO(c) begins with more velocity than ZnO (a), and in diagram of (b), the intensity of ZnO (a) at 451.64 nm comes above the ZnO (c).
Determination of band gap energy
The novel band gap energies have also been shown in for two ZnO nanoproducts. We found 4.19 eV (black line) for ZnO (c) and 3.47 eV (red line) for ZnO (a), respectively, according to quantum confinement effect (Kumar and Rani Citation2013, Rana et al. Citation2013) on the base of Tauc method.
Figure 11. The bandgap energy transition for two nanofluids, (a) black line ZnO (c), and (b) red line ZnO (a). Inset of two transitions has been shown in the up of Figure. The presence of a high-intensity of ZnO(c) is observed.
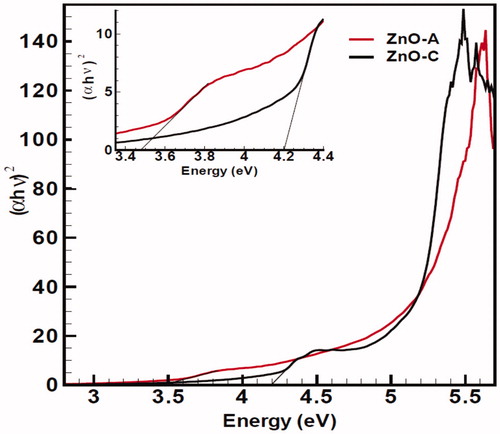
Furthermore, ZnO (c) has smaller size than ZnO (a), and has broader band gap energy which could provide more radicals to diffuse into the membrane of cancer cells more than of ZnO (a). They also reveal to have higher band gap in compared with ZnO bulk counterpart and the amount of surface atoms increases drastically compared with the number of bulk atoms. Additionally, the band gap of semiconductor ZnO NPs has been proposed recently as a key function that determines their toxicological response at cellular and whole animal levels (Punnoose et al. Citation2014). It was found that the wide band gap transition and optical absorption of ZnO QDs NPs can produce a significant influence on their interactions with cancer cells and also follow by decreased cell viability. Furthermore, we tried to express and focus on this new approach related to the advantage of large band gap energy and localized surface states compared with lake of it, regarding to their influences of better cytotoxicity effects towards cancer therapy as one of the new and most interesting challenge in biological systems.
Investigation of interesting challenge of advantage of ZnO QD NPs broad band gaps and their influence on better cytotoxicity effect towards cancer therapy
Research and development on the presence of wide band gap energy (energy donor capacity) to achieve the best result regarding to diffusion power and coming in contact with cell membrane of tumor, is one of the major idea in this recent, and for this evidence, we could propose and classify our main reasons in four categories. We believe that it is a new insight about the possible mechanism of tumor suppressors and perturbation through the particularly cancer cell death programs, and the scope of this article is focused on better toxicity application and inverse relationship between ZnO nanoparticle size and cytotoxicity property which arising from their highly surface energy, and wide band gap including more trapping states semiconductor small-sized ZnO NPs. Extremely fine nanosized ZnO NPs are able to protect the particles from aggregation and instability in liquid media due to modification and engineering their surface-bound chemical groups. It seems that in this circumstance small ZnO QDs NPs could attach to biomolecule receptors and seat on easily by favorable contact angles and make typical core and shell or encapsulation model. Also in quantum confinement effect, which obtains by fine sizes of ZnO QDs NPs, electron excites to conduction band (Bajwa et al. Citation2015), and hole created in valance band forms an exciton, the created excitons have longer relaxation time because of their broader band gap and many trapping states owing to structural defects and oxygen vacancies during the modified surface processing. Exciton emission, which is due to recombination of electron and hole, could be direct or indirect. The direct recombination could be caused by UV phone emission because of broad band gap. The indirect recombination could be raised through trapping states by thermal emission and lower photon energy. The last case is due to favorable crystal structural property of the synthesized ZnO QDs NPs. Oxidation of biological cells by hole as mentioned longer relaxation time could also be occurred because of broader band gap and trapping states with regard to defect structural, free radicals, and oxygen vacancies over the functionalized surface, when they attack to cell membrane and into cell cytoplasm. So this approach gives enough time to oxidize the amino acid proteins and DNA in cell wall and cell membrane, which would finally led to mitochondria weakness, eventual cellule growth inhibition, and cell death (Sirelkhatim et al. Citation2015). Therefore, it is very important point that ZnO QD NPs indicate very strong penetration and diffusion power into the membrane of cancer cells, by strong electrostatic interaction, electro valance bonding, and generating of stable hydrogen bonding towards amino acids of proteins.
Conclusions
[ZnO QDs NPs, ZnO/PVP, and sorbitan monooleate] as ZnO (c) nanoformulation fluid and [Ag/Fe2O3/ZnO] as ZnO (a) nanocomposites were synthesized by sol–gel, hydrothermal, and co-precipitation during fast quenching method including surface chemical modifying and engineering process. They were carry out as new nanoproducts as biocompatible breast anti-cancer in this work. These findings indicated promising nanodrugs for the treatment of cancer cell line MCF-7 in vitro containing many particular and distinct physicochemical unique characteristics in nanomedicine. The nanoproducts were characterized by SEM, FTIR, PL, and UV–Vis spectroscopy including a wide band gap energy such as 4.19 and 3.47 eV in short UV wavelengths. The presence of a few exciton energies behavior in semiconductor nanoproducts, many trapping states possessing of electron transitions, large band gap energies, small sized of ZnO QDs NPs, favorable surface modifiers, production of thermal energy obtained of quantization electron–hole transitions, high-absorption energy at UV spectroscopy, and enhanced ability and stability in absorption UV–Vis irradiation are many key parameters which we could think about them in this new research. Our data showed that these two nanoproducts have profound cytotoxic activity against MCF-7 human breast cancer cell line. Therefore, we believe that they might be promising agents in cancer chemotherapy and further efforts to explore their precise molecular mechanisms are also necessary. Interestingly, there is a new design for possible relationship between large band gap energy and better cytotoxicity property as anticancer treatment for the first time. The investigation of in vivo studies (animal testing) and proposed molecular mechanism will be considered in future.
Disclosure statement
The authors report no conflicts of interest and are responsible for the content and writing of the manuscript.
References
- Akhtar MJ, Ahamed M, Kumar S, Khan MM, Ahmad J, Alrokayan SA. 2012. Zinc oxide nanoparticles selectively induce apoptosis in human cancer cells through reactive oxygen species. Int J Nanomed. 7:845–857.
- Arooj S, Nazir S, Nadhman A, Ahmad N, Muhammad B, Ahmad I, Mazhar K, Abbasi R. 2015. Novel ZnO: Ag nanocomposites induce significant oxidative stress in human fibroblast malignant melanoma (Ht144) cells. Beilstein J Nanotechnol. 6:570–582.
- Bajwa N, Mehra NK, Jain K, Jain NK. 2015. Targeted anticancer drug delivery through anthracycline antibiotic bearing functionalized quantum dots. Artificial Cells Nanomed Biotechnol. 44:1774–1782. (Early online: 1–6).
- Becheri A, Dürr M, Nostro PL, Baglioni P. 2008. Synthesis and characterization of zinc oxide nanoparticles: application to textiles as UV-absorbers. J Nanopart Res. 10:679–689.
- Fakhroueian Z, Dehshiri AM, Katouzian F, Esmaeilzadeh P. 2014. In vitro cytotoxic effects of modified zinc oxide quantum dots on breast cancer cell lines (MCF7), colon cancer cell lines (HT29) and various fungi. J Nanopart Res. 16:2483 (14 pp).
- Fakhroueian Z, Harsini FM, Chalabian F, Katouzian F, Shafiekhani A, Esmaeilzadeh P. 2013. Influence of modified ZnO quantum dots and nanostructures as new antibacterials. Adv Nanopart. 2:247–258.
- Guo L, Yang S. 2000. Synthesis and characterization of poly (vinylpyrrolidone)-modified zinc oxide nanoparticles. Chem Mater. 12:2268–2274.
- Hamzeloo-Moghadam M, Aghaei M, Fallahian F, Jafari SM, Dolati M, Abdolmohammadi MH, Hajiahmadi S, Esmaeili S. 2015. Britannin, a sesquiterpene lactone, inhibits proliferation and induces apoptosis through the mitochondrial signaling pathway in human breast cancer cells. Tumour Biol. 36:1191–1198.
- Hanley C, Layne J, Punnoose A, Reddy KM, Coombs I, Coombs A, Feris K, Wingett D. 2008. Preferential killing of cancer cells and activated human T cells using ZnO nanoparticles. Nanotechnology 19:295103–2910.
- Hong H, Shi J, Yang Y, Zhang Y, Engle JW, Nickles RJ, Wang X, Cai W. 2011. Cancer targeted optical imaging with fluorescent zinc oxide nanowires. Nano Lett. 11:3744–3750.
- Hsu S, Lin YY, Huang S, Lem KW, Nguyen DH, Lee DS. 2013. Synthesis of water-dispersible zinc oxide quantum dots with antibacterial activity and low cytotoxicity for cell labeling. Nanotechnology 24:475102 (11 pages).
- Jafari A, Ghane M, Arastoo S. 2011. Synergistic antibacterial effects of nano zinc oxide combined with silver nanocrystals. African J Microbe Res. 5:5465–5473.
- Kang T, Guan R, Chen X, Song Y, Jiang H, Zhao J. 2013. In vitro toxicity of different-sized ZnO nanoparticles in Caco-2 cells. Nanoscale Res Lett. 8:496–8.
- Kato Y, Ozawa S, Miyamoto C, Maehata Y, Suzuki A, Maeda T, Baba Y. 2013. Acidic extracellular microenvironment and cancer. Cancer Cell Inter. 13:8.
- Kumar H, Rani R. 2013. Structural and optical characterization of ZnO nanoparticles synthesized by microemulsion route. Int Lett Chem Phy Astronomy. 14:26–36.
- Mallika AN, Ramachandra RA, Venugopal RK. 2015. Annealing effects on the structural and optical properties of ZnO nanoparticles with PVA and CA as chelating agents. J Adv Ceram. 4:123–129.
- Mansur HS. 2010. Quantum dots and nanocomposites. Wiley Interdiscip Rev Nanomed Nanobiotechnol. 2:113–129.
- Mosmann T. 1983. Rapid colorimetric assay for cellular growth and survival: application to proliferation and cytotoxicity assays. J Immunol Methods 65: 55–63.
- Nair S, Sasidharan A, Divya Rani VV, Menon D, Nair S, Manzoor K, Raina S. 2009. Role of size scale of ZnO nanoparticles and microparticles on toxicity toward bacteria and osteoblast cancer cells. J Mater Sci Mater Med. 20:S235–S241.
- Ng KW, Khoo SPK, Heng BC, Setyawati MI, Tan EC, Zhao X, et al. 2011. The role of the tumor suppressor p53 pathway in the cellular DNA damage response to zinc oxide nanoparticles. Biomaterials. 32:8218–8225.
- Nie S, Xing Y, Kim GJ, Simons JW. 2007. Nanotechnology applications in cancer. Annu Rev Biomed Eng. 9:257–288.
- Ostrovsky S, Kazimirsky G, Gedanken A, Brodie C. 2009. Selective cytotoxic effect of ZnO nanoparticles on glioma cells. Nano Res. 2:882–890.
- Prasanth R, Gopinath D. 2013. Effect of ZnO nanoparticles on nasopharyngeal cancer cells viability and respiration. Appl Phys Lett. 102:113702–1134pp.
- Punnoose A, Dodge K, Rasmussen JW, Chess J, Wingett D, Anders C. 2014. Cytotoxicity of ZnO nanoparticles can be tailored by modifying their surface structure: a green chemistry approach for safer. ACS Sustainable Chem Eng. 2:1666–1673.
- Rahman MM, Gruner G, Al-Ghamdi MS, Daous MA, Khan SB, Asiri AM. 2013. Fabrication of highly sensitive phenyl hydrazine chemical sensor based on as-grown ZnO–Fe2O3 microwires. Int J Electrochem Sci. 8:520–534.
- Rana SB, Singh A, Singh S. 2013. Characterization and optical studies of pure and Sb doped ZnO nanoparticles. Int J Nanoelectronics Mat. 6:45–57.
- Sasidharan A, Chandran P, Menon D, Raman S, Nair S, Koyakutty M. 2011. Rapid dissolution of ZnO nanocrystals in acidic cancer microenvironment leading to preferential apoptosis. Nanoscale. 3:3657–3669.
- Sirelkhatim A, Mahmud S, Seeni A, Kaus NHM, Ann LC, Bakhori SKM, Hasan H, Mohamad D. 2015. Review on zinc oxide nanoparticles: antibacterial activity and toxicity mechanism. Nano-Micro Lett. 7:219–242. (Early online:1–24).
- Thurber A, Wingett DG, Rasmussen JW, Layne J, Johnson L, Tenne DA, et al. 2012. Improving the selective cancer killing ability of ZnO nanoparticles using Fe doping. Nanotoxicology. 6:440–452.
- Wahab R, Siddiqui MA, Saquib Q, Dwivedi S, Ahmad J, Musarrat J, Al-Khedhairy AA, Shin HS. 2014. ZnO nanoparticles induced oxidative stress and apoptosis in HepG2and MCF-7 cancer cells and their antibacterial activity. Collo Sur B Biointerfaces. 117:267–276.
- Xiong G, Pal U, Serrano JG, Ucer KB, Williams RT. 2006. Photoluminescence and FTIR study of ZnO nanoparticles: the impurity and defect perspective. Phys Stat Sol. (C) 3:3577–3581.
- Yuan L, Wang Y, Wang J, Xiao H, Liu X. 2014. Additive effect of zinc oxide nanoparticles and isoorientin on apoptosis in human hepatoma cell line. Toxicol Lett. 225:294–304.