
Abstract
The gold nanoparticles (AuNPs) have been widely used as drug delivery systems at several biomedical fields. However, the effect of AuNPs on the components of human blood is not well characterized. AuNPs firstly interacted with blood when using AuNPs as the drug delivery carries. Therefore, it is urgent to investigate the effect of AuNPs (including the ligands of AuNPs) on human blood, especially its components. In this study, we investigated the possible effects of polyethylene glycol-coated AuNPs (PEG@AuNPs) and citric acid-coated AuNPs (CT-AuNPs) on the blood cell function and distribution of those nanoparticles in blood components including erythrocytes, leukocytes, platelets (PLTs) cells and plasma. We found that the amount of CT-AuNPs engulfed by leukocytes was four folds more compared to PEG@AuNPs, indicating that PEGylation might have the ability to escape the immune system. We found that each individual leukocyte uptaked more AuNPs particles than individual platelet. However, there are more PLTs than leukocytes in the blood. The total amount of AuNPs including PEG@AuNPs and CT-AuNPs accumulation in PLTs were more than in leukocytes. Moreover, we found that both CT-AuNPs and PEG@AuNPs-induced PLTs activation at high concentration. We therefore concluded that the interactions between nanodrug delivery systems (AuNPs) and human blood components, especially the PLTs should be careful evaluated prior to their clinical applications.
Introduction
The widely applications of gold nanoparticles (AuNPs) on human diseases diagnosis, drug delivery and cancer therapy are getting ever more attentions [Citation1,Citation2]. However, it has been demonstrated that the side effects and the potential toxicity of AuNPs were closely associated with the AuNPs properties including size, shape and surface chemistry of AuNPs [Citation3,Citation4]. For example, thiolate-capped AuNPs with 1.5 nm exhibited high toxic to human embryonic stem cells by altering the DNA methylation and hydroxymethylation patterns in the cells [Citation5]. AuNPs induced oxidative damage of erythrocytes and tissues through increasing the reactive oxygen species and depleting the antioxidant enzyme status [Citation6]. These AuNPs-related toxicities were closely associated with the induction of oxidative stress. Several studies have found that polyethylene glycol surface functionalized AuNPs reduced the oxidative stress through their unique properties including higher biocompatibility and longer circulation time in blood. For example, poly(ethylene glycol)-modified AuNPs reduced its cytotoxicity [Citation7], increased its blood circulation time and biocompatibility [Citation8]. In 2006, significant progress had been made by constructing a novel nanomedicine, CYT-6091 by assembling recombination human tumor necrosis factor alpha to the surface of AuNPs with thiol PEG in the form of a mixed monolayer. The result showed that PEGylated AuNPs could enhance the delivery of tumor necrosis factor (TNF) 7 folds than that of TNF monomer [Citation9]. However, PEG@AuNPs exert cytotoxicity and side effects including induction of nitric oxide (NO), and IL-6 through activating of p38 mitogen-activated protein kinases and nuclear factor-kappa B pathway [Citation10]. Small size of PEG@AuNPs particles has been found trapped in cytoplasmic vesicles and lysosomes of Kupffer cells, macrophages, spleen and mesenteric lymph node. They also activated YP1A1 and 2B (phase I metabolic enzymes) and caused hepatic in liver tissues from 24 h to 7 days after treatments [Citation11]. We previously found that PEG@AuNPs affected the deformability and oxygen-delivering ability of erythrocytes through the interaction between PEG@AuNPs and erythrocyte membrane [Citation12]. AuNPs firstly interacted with the blood cell and plasma once they were intravenous injected as drug delivery vehicles.
The whole blood major components contain blood cells and plasma. The blood cells include red blood cells (RBCs), white blood cells (WBCs) and platelets (PLTs). The function of RBCs is transporting oxygen and nutrients to the lungs and tissues; and PLTs have a major role in blood clots to prevent excess blood loss in the wound situation. WBCs are defending invader by phagocytosis to engulf pathogens, developing antibodies to fight infection. The plasma maintains the balancing acid–base pH and osmotic pressure, and participating in blood coagulation with platelet during the wounding. The aims of our study are to investigate the distribution of AuNPs in blood components, to evaluate whether AuNPs affect the functions of blood cells and plasma prior to their clinical application. AuNPs with 13 nm have been widely used in the diagnosis, therapy and imaging due to their low cytotoxicity. PEG@AuNPs and CT-AuNPs are the two most common AuNPs in applications. CT-AuNPs have strong activity to participate chemical reactions [Citation13]. In this study, we use PEG@AuNPs (13 nm) and CT-AuNPs (13 nm) to investigate the effect of AuNPs on the function of blood, to clarify the importance of surface chemistry in haemocompatibility of AuNPs and to evaluate the biosafety prior to its clinical application.
Material and methods
Synthesis and characterization of Au nanoparticles
Citrate-coated gold nanoparticles (CT-AuNPs) with 13 nm in diameter were synthesized as previously reported [Citation14], the PEGylated 13 nm gold nanoparticles (PEGylated AuNPs) were prepared by reacting CT-AuNPs with a 2500-fold excess of PEG-5000 for 3 h at 25 °C according to our previous study [Citation12]. PEGylated AuNPs morphology and particle size were evaluated using transmission electron microscopy (TEM, JEM-200CX, Jeol Ltd., Japan). The nanoparticles surface charge (zeta potential, mV) and size distribution were determined using a ZetaSizer Nano series Nano-ZS (Malvern Instruments Ltd., Malvern, UK). The suspensions were sonicated for 5 min before use.
The haemolysis assay
Whole blood (3 ml) was mixed with 13 nm CT-AuNPs or 13 nm PEG@AuNPs at various final concentrations (6.25, 12.5, 25, 50 and 100 μg ml−1). Phosphate buffered saline without AuNPs was used as negative control. The blood mixture was gently vortexed and incubated at room temperature for 2 h. To determine free haemoglobin (Hb) concentration in plasma, blood samples were centrifuged at 3000 g for 10 min at 4 °C. The supernatant was further centrifuged at 15,000 g for 30 min to remove materials from plasma. The supernatant Hb levels were measured by the three wavelengths method: supernatant Hb (mg/L) = [1.68 × A415–0.84 × (A380 + A450)] × 1000 mg ml−1. Total haemoglobin (HGB) and haematocrit (HCT) were analyzed by auto haematology analyzer (BC-5800, Mindray Corp., Shenzhen, China). Haemolytic rate (%) was calculated using a standard formula: Haemolytic rate (%) = (supernatant Hb × [1 − Hct%])/total Hb ×100.
Inductively coupled plasma mass spectrometry (ICP-MS)
The phagocytosis and sticking of nanoparticles on three blood cells (WBC, RBC and platelet) were assessed by quantitative measurement of Au levels in three blood cells. The WBC, RBC and platelet cells were separated by discontinuous percoll density-gradient centrifugation. The three separated blood cells were washed and resuspended in physiological saline in respectively. WBC, RBC and platelet cell counts were measured by BC-5800 automated blood counter system. The samples were digested in aqua fortis (nitric acid:hydrochloric acid =3:1) in the solution volume to 2 ml using 2% nitric acid and 1% hydrochloride acid (1:1). ICP-MS assays were performed on Elemental X7 (Thermo Electron) for quantitatively measuring Au content.
Detection of blood coagulation system
Prothrombin time (PT), activated partial thromboplastin time (APTT), thrombin time (TT), fibrinogen (Fbg) and Coagulation Factors activity (FII, FV, FVII, FVIII, FIX, FX, FXI, FXII) were performed using a CA-1500 automated coagulation analyzer (Sysmex, Japan) [Citation15]. Coagulation Factors activity assays were determined with one-stage clotting assays with coagulation factor-deficient plasma (Sysmex). The PT, APTT and TT levels were analyzed to screen the overall integrity of the coagulation system.
Transmission electron microscopy
Blood samples were centrifuged at 3000 g for 10 min. The buffy coat was pipetted into PBS (pH 7.24) containing 2.5% glutaraldehyde and 2% paraformaldehyde for 30 min, and washed for three times. Subsequent processing and inspections were conducted by Wuhan Servicebio Technology Co., Ltd with a TECNAI G2 20 electron microscope.
Blood preparation and incubation with CT-AuNPs/PEG@AuNPs
The study project and human blood sampling protocol were approved by Ethics Committee of Institute of Blood Transfusion, Chinese Academy of Medical Sciences and Peking Union Medical College. Blood samples were collected from 6 healthy volunteer donors into Sterile tubes containing CPDA anticoagulant solutions (blood:CPDA =50:7, volume ratio). Blood cell counts were measured by an automated blood counter system (BC-5800, Mindray Corp., China). To illuminate the interaction between nanoparticles and blood components, a sufficient volume of CT-AuNPs and PEG@AuNPs were added to 10 ml fresh blood to obtain a final concentration from 5.5 to 88 μg ml−1. The samples were gently shaken on the platform of an orbital incubator (60 r/min) overnight at 37 °C. The processing step was similar to whole blood monocyte activation test (MAT). All operations were performed under aseptic conditions.
Discontinuous percoll density-gradient centrifugation
Following the nanomaterials incubation with blood overnight, RBCs, WBCs and PLTs were separated based on their density in the discontinuous Percoll density-gradient centrifugation. Percoll solution (GE Corp.) with a density of 1.130 g ml−1 was diluted with concentrated phosphate buffered saline (ten times) to obtain an osmolarity of 310 to 320 mosm kg−1 and then further diluted with regular PBS to obtain different concentrations [Citation16].
Four Percoll layers (2 ml each) with densities of 1.072, 1.095, 1.106 and 1.125 g/ml were carefully layered on top of each other in a plastic tube with the densest layer at the bottom. 0.5 ml of blood was gently layered on the least dense layer and the tube was centrifuged at 2500 g for 25 min at 22 °C. Three types of blood cells were harvested from separated density fractions. WBCs were lighter than RBCs and heavier than PLTs. PLTs were at the top that accumulated between 1.072–1.095 g ml−1 layer. WBCs were accumulated between 1.095 and 1.105 g ml−1 layer. RBCs were at the bottom that accumulated between 1.105 and 1.125 g/ml layer.
Erythrocytes deformability assay
Erythrocytes deformability was analyzed by a Laser-diffraction Ektacytometer (LBY-BX, Beijing Precil Instrument Co., Ltd, China) according to the manufacturer's manual. In briefly, approximately 20 μl blood was suspended in 1 ml PBS containing 15% polyvinylpyrrolidone. A thin layer of the RBCs suspension was sheared between two concentric cylinders (size of the gap was 0.5 mm) at different shear stresses at 37 °C. The shear rate was increased by a faster rotation of the outer cup to cause RBCs deformation, and erythrocytes deformability was detected at four different shearing forces according to the laser diffraction principle.
Platelet aggregation assay and platelet activation
Platelet aggregation was estimated using an aggregometer (Helena Corp.) under agitation as previous described [Citation17]. In briefly, after nanomaterials incubated with fresh blood overnight at 37 °C, platelet-rich plasma (PRP) was extracted by the centrifugation. The aggregation of PLTs was determined from samples of 225 μl platelet-rich plasma after stimulation with 25 μl arachidonic acid (Helena Corp.). The maximum aggregation rate was calculated by software. Platelet activation was assessed by measuring expression of platelet P-selectin (CD62p) with flow cytometry, using previously described methods [Citation18,Citation19].
Human whole blood monocyte activation test
Following the nanomaterials incubation with blood overnight, blood samples were centrifuged at 5000 g for 10 min. The supernatant plasma was used for IL-1β detection. IL-1β released by monocytes was quantified by ELISA (Shanghai ExCell Biology, Inc.) according to the manufacturer’s directions.
The monocyte activation test (MAT) has been widely used for the detection of pyrogens in pharmaceuticals and medical devices. Moreover, the MAT procedure, with its five variants, has been implemented in the European Pharmacopoeia. The basis of the MAT is that pyrogens, via Toll-like receptors (TLRs) expressed on monocytes, stimulate cytokine (such as IL-1β) production. However, it was founded that some kinds of nanoparticles could activate the NLR pyrin domain containing 3 (Nlrp3) inflammasome and lead to IL-1β secretion in Primary Human Keratinocytes. So it is necessary to explore whether different types of nanoparticles have “pyrogen-like” phenomenon. And we employed monocyte activation test and detection of IL-1β concentration to study the effect of nanoparticles on immune system.
Statistical analysis
All statistical analyses were performed using the SPSS 13.0 statistical software package (SPSS Inc., Chicago, IL). The results are expressed as means ± SD of at least six independent experiments. The differences among experimental groups were evaluated by the t-test. p < .05 was considered statistically significant.
Results and discussion
The distribution of CT-AuNPs and PEG@AuNPs in blood
The CT-AuNPs and PEG@AuNPs were synthesized and characterized according to our previous study (Figure S1 and S2) [Citation14]. The CT-AuNPs/PEG@AuNPs were incubated with the whole blood for 16 h [Citation20], we found that CT-AuNPs/PEG@AuNPs cannot penetrated percoll layers unless engulfed by blood cells (), and whole blood was separated by discontinuous Percoll density-gradient centrifugation into four blood components according to their specific gravity (). Detection of blood coagulation system shows that both CT-AuNPs/PEG@AuNPs did not cause significant influence on PT, APTT, TT, fibrinogen and Coagulation Factors activity (data not shown).
Figure 1. (a) The separation effect of AuNPs by density centrifugation, free CT-AuNPs and PEG@AuNPs cannot penetrate percoll layers unless engulfed by blood cells. (b) The effect of discontinuous percoll density-gradient centrifugation on the separation of blood pre-treated with AuNPs, the purity of blood cells was analysed by automatic blood count. (c) Quantitative distribution of CT-AuNPs and PEG@AuNPs in the blood cells, including RBCs, WBCs and PLTs). Gold concentration is measured using ICP-MS after incubating blood with CT-AuNPs or PEG@AuNPs for 16 h. Data are given in mean ± SD, n = 6.
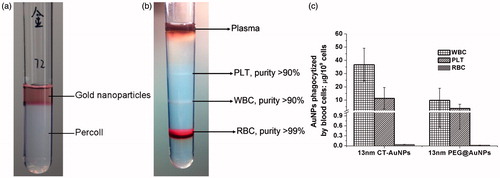
The Au content in RBCs, WBCs, PLTs and plasma was measured by ICP-MS (the amount of Au refers to the amount of gold in each cells). We found that individual leukocyte uptake most AuNPs nanoparticles (both CT-AuNPs and PEG@AuNPs), followed by platelet and erythrocyte (). Similarly, in CT-AuNPs pretreated blood, the decreasing order of the amount of Au elements in blood cells was WBCs, PLTs and RBCs. These finding indicated that no matter of what kind of ligands used for AuNPs, most of AuNPs was located in the WBCs. The reason may be that the WBCs, also called leukocytes or leucocytes, are the cells of the immune system that are involved in protecting the body against foreign invaders through endocytosis pathway. In addition, we observed that the amount of CT-AuNPs in WBCs was four folds than that of PEG@AuNPs. According to the previous studies, when CT-AuNPs incubated with plasma, proteins rapidly adsorb to the surface of AuNPs, leading to the formation of the protein corona [Citation21], which critically affects the phagocytosis process of CT-AuNPs. And the low dosage of PEG@AuNPs engulfed by WBCs, it can be attributed to the biocompatibility of PEG [Citation22], which prevent protein corona formation and might have ability to escape blood immune system. WBCs and RBCs have quite different destruction and clearance pathways, the interaction between AuNPs and WBCs/RBCs would affect their in vivo distribution, thereby inducing different biological toxicity. Thus, the interaction between AuNPs and blood components should be seriously considered prior to their in vivo applications.
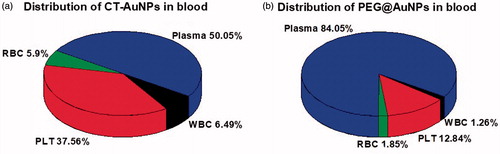
On the other hand, considering the quantities of erythrocytes, leukocytes and PLTs are quite different in blood (RBC: 3.5–5.5 × 10¹²/L, WBC: 4–10 × 109/L, PLT: 100–300 × 109/L), we calculated the total amount of AuNPs uptake by those cells according to automatic haematology analyzer and ICP-MS data (). As mentioned above, AuNPs engulfed by leucocyte was highest (per cell) in three types of blood cell, however, it might be misunderstood based on the gross amount of AuNPs uptake by leucocytes, as the number of leucocytes in blood is much fewer than PLTs and erythrocytes. It is suggested that we should pay more attention on the influence of AuNPs against the effect of PLTs and erythrocytes, especially PLTs, because the gross amount of AuNPs engulfed by total PLTs was highest among the three types of blood cells (), it was quite different from what we used to know.
Figure 2. (a) Quantitative distribution of CT-AuNPs in the blood components; (b) Quantitative distribution of PEG@AuNPs in the blood components.
The effects of PEG@AuNPs/CT-AuNPs on red blood cells
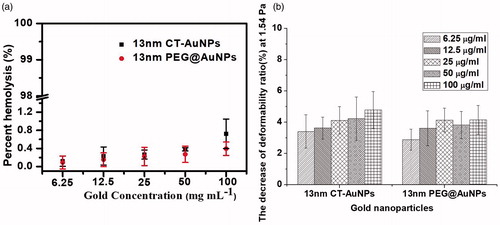
We found that PEG@AuNPs even at the concentration of 100 μg ml−1 did not significantly affect RBCs functions including haemolytic activity and deformability (). Our previous study, which showed that both the deformability and oxygen-delivering ability of RBCs did not change when treated by 13 nm PEG@AuNPs within 1 day [Citation12]. Meanwhile, we also demonstrated that the PEG@AuNPs with high concentration significantly decreased the oxygen delivering ability and deformability over a long period of time, indicating that the function of PEG@AuNPs on the RBCs was concentration-dependent. These results demonstrated that the long-term circulation of PEG@AuNPs in the blood may induce side effect. However, PEG@AuNPs treatment did not have significantly effect on the RBC function. Moreover, similar results were observed in the RBCs pretreated by CT-AuNPs.
Figure 3. (a) Haemolysis was not significantly changed in RBCs treated by CT-AuNPs or PEG@AuNPs. (b) The deformability ratio of RBC was not significantly changed in cell treated by different concentration of CT-AuNPs or PEG@AuNPs.
The effects of PEG@AuNPs/CT-AuNPs on white blood cells
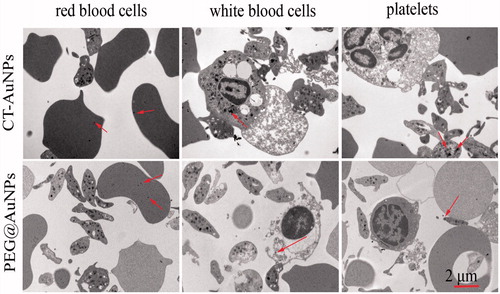
After CT-AuNPs and PEG@AuNPs incubation with blood for 16 h, we found the internalization of AuNPs by blood cells, and WBCs showed more significant uptake of CT-AuNPs and PEG@AuNPs compared to the RBCs in vitro via TEM studies (). The formations of particle aggregation as shown in were similarly observed for CTAB-coated gold spheres and may be attributed to interactions of the particles with serum components [Citation23].
Figure 4. The TEM images of blood components: RBC, WBC, PLT, pretreated with CT-AuNPs and PEG@AuNPs (arrows indicate CT-AuNPs or PEG@AuNPs).
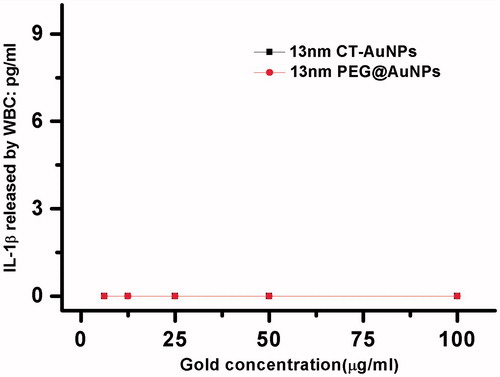
In addition, the inflammatory reaction is one of the first steps involved in the WBCs induced by nanoparticles. Recent reports revealed that nanomaterials trigger inflammation through the activation of the inflammasome protein complex which regulates the maturation and release of cytokines of the IL-1 family [Citation24,Citation25]. Among the IL-1 family, interleukin-1β (IL-1β) is a potent proinflammatory cytokine that is crucial for host-defence responses to infection and injury [Citation26]. The specific secretion of primary human phagocytes induced by nanoparticle surface chemistry suggests that it can be considered as an inflammatory marker in nanoparticle research. For those reasons, we detected the concentration of IL-1β in blood after treated with CT-AuNPs/PEG@AuNPs. As shown in , no significant differences in the expression levels of mature IL-1β among WBCs treated with various concentration of CT-AuNPs/PEG@AuNPs.
Figure 5. CT-AuNPs or PEG@AuNPs treatment did not significantly affect the amount of IL-1β release from WBCs.
The interaction between PEG@AuNPs/CT-AuNPs and platelets
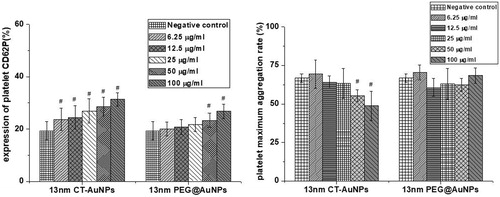
We also investigated the effects of PEG@AuNPs and CT-AuNPs on the PLTs aggregation and activation. To evaluate the influence of PEG@AuNPs and CT-AuNPs on PLTs activation, we used flow cytometry to study the surface expression of CD62P (p-selectin) on PLTs after treated with PEG@AuNPs or CT-AuNPs. Platelet activation is associated with the up regulation of surface receptors that play an important role in adhesion, aggregation, and platelet–leukocyte aggregation. Among the receptors, CD62P (also known as the P-selectin) is considered to be the significant markers for platelet activation [Citation27,Citation28]. Therein, CD62P, as an important receptor involved in platelet function, constitutively resides in platelet alpha granules and translocated to the PLTs surface during aggregation.
As shown in , we found that both PEG@AuNPs and CT-AuNPs treatments activated CD62P expression on PLTs in a dose-dependent manner. However, CT-AuNPs activated PLTs CD62P expression with much lower concentration compared to PEG@AuNPs. We also observed that treatment of PLTs with 50, 100 μg ml−1 CT-AuNPs showed a significant decrease in PLTs maximum aggregation rate compared to negative control (0 μg ml−1), while PLTs maximum aggregation rate did not decreased when treated with high concentration PEG@AuNPs (). These findings indicated that PEG@AuNPs have better biocompatibility.
Figure 6. (a) CT-AuNPs or PEG@AuNPs treatment significantly increased CD62P expression on PLTs in a concentration-dependent manner. PLTs were treated for 16 h with different concentration of CT-AuNPs and PEG@AuNPs, followed by flow cytometry analysis; statistics of the CD62P expression, #p < .05, (b) CTAuNPs at 50 or 100 μg/ml treatment significantly reduced PLTs maximum aggregation rate compared to negative control; statistics of the PLTs maximum aggregation rate, #p < .05.
Conclusion
In summary, by using the technology of ICP-MS and discontinuous percoll density-gradient centrifugation, this paper makes a quantitative analysis for the amount of PEG@AuNPs/CT-AuNPs engulfed by WBCs, RBCs and PLTs, and the impact on blood cells function. We found that PEG@AuNPs have no had apparent effects on the function of RBCs, WBCs, PLTs in the present study, while CT-AuNPs activated CD62P expression on PLTs in a dose dependent manner and PLTs maximum aggregation rate decreased when treated with high concentration. However, the amount of AuNPs uptake by blood cells was closely associated with the nature of ligands used for AuNPs. Aside from the leukocytes (immune system), the gross amount of nanoparticles uptake by erythrocytes and PLTs cannot be neglected, especially PLTs. We found the gross amount of AuNPs (both PEG@AuNPs and CT-AuNPs) uptake by PLTs was highest in those three type of blood cells according to automatic haematology analyzer and ICP-MS data, even more than leukocytes, which is widely divergent with ours general knowledge. Those data suggest that it is necessary to study the effects of nanomaterials on PLTs and RBCs function. And the gross amount of nanomaterials engulfed by PLTs and RBCs cannot be neglected in the haemocompatibility of nanomaterials study. Our data also provide the evidence that the effect of nanomaterials on the function of blood components should be careful evaluated prior to their in vivo applications.
Supplemental_data.docx
Download MS Word (517.7 KB)Disclosure statement
No potential conflict of interest was reported by the authors.
Additional information
Funding
References
- Abadeer NS, Murphy CJ. Recent progress in cancer thermal therapy using gold nanoparticles. J Phys Chem C. 2016;120:4691–4716.
- Kafshdooz L, Kafshdooz T, Razban Z, et al. The application of gold nanoparticles as a promising therapeutic approach in breast and ovarian cancer. Artif Cells Nanomed Biotechnol. 2015;44:1222–1227.
- Weaver JL, Tobin GA, Ingle T, et al. Evaluating the potential of gold, silver, and silica nanoparticles to saturate mononuclear phagocytic system tissues under repeat dosing conditions. Part Fibre Toxicol. 2017;14:25.
- Daraee H, Eatemadi A, Abbasi E, et al. Application of gold nanoparticles in biomedical and drug delivery. Artif Cells Nanomed Biotechnol. 2016;44:410–422.
- Senut MC, Zhang YH, Liu FC, et al. Size-dependent toxicity of gold nanoparticles on human embryonic stem cells and their neural derivatives. Small. 2016;12:631–646.
- Shrivastava R, Kushwaha P, Bhutia YC, et al. Oxidative stress following exposure to silver and gold nanoparticles in mice. Toxicol Ind Health. 2016;32:1391–1404.
- Harris JM, Martin NE, Modi M. Pegylation: a novel process for modifying pharmacokinetics. Clin Pharmacokinetics. 2001;40:539–551.
- Kah JC, Wong KY, Neoh KG, et al. Critical parameters in the pegylation of gold nanoshells for biomedical applications: an in vitro macrophage study. J Drug Target. 2009;17:181–193.
- Davis ME, Zuckerman JE, Choi CH, et al. Evidence of RNAi in humans from systemically administered siRNA via targeted nanoparticles. Nature. 2010;464:1067–1070.
- Liu Z, Li W, Wang F, et al. Enhancement of lipopolysaccharide-induced nitric oxide and interleukin-6 production by PEGylated gold nanoparticles in RAW264.7 cells. Nanoscale. 2012;4:7135–7142.
- Cho WS, Cho M, Jeong J, et al. Size-dependent tissue kinetics of PEG-coated gold nanoparticles. Toxic Appl Pharm. 2010;245:116–123.
- He Z, Liu J, Du L. The unexpected effect of PEGylated gold nanoparticles on the primary function of erythrocytes. Nanoscale. 2014;6:9017–9024.
- Dykman L, Khlebtsov N. Gold nanoparticles in biomedical applications: recent advances and perspectives. Chem Soc Rev. 2014;41:2256–2282.
- Du L, Suo S, Wang G, et al. Mechanism and cellular kinetic studies of the enhancement of antioxidant activity by using surface-functionalized gold nanoparticles. Chem Eur J. 2013;19:1281–1287.
- Ma L, Sun P, Lin F, et al. In vitro evaluation of residual procoagulants in human intravenous immunoglobulins from 11 Chinese blood fractionation companies. Thromb Res. 2013;132:381–385.
- Roberts RL, Gallin JI. Rapid method for isolation of normal human peripheral blood eosinophils on discontinuous Percoll gradients and comparison with neutrophils. Blood. 1985;65:433–440.
- Ungerer M, Rosport K, Bultmann A, et al. Novel antiplatelet drug revacept (Dimeric Glycoprotein VI-Fc) specifically and efficiently inhibited collagen-induced platelet aggregation without affecting general hemostasis in humans. Circulation. 2011;123:1891–1899.
- Pennings GJ, Siegwald J, Yong AS, et al. Resident performed two-point compression ultrasound is inadequate for diagnosis of deep vein thrombosis in the critically III. J Thromb Thrombolysis. 2014;37:326–330.
- Chung T, Connor D, Joseph J, et al. Platelet activation in acute pulmonary embolism. J Thromb Haemost. 2007;5:918–924.
- Stang K, Fennrich S, Krajewski S, et al. Highly sensitive pyrogen detection on medical devices by the monocyte activation test. J Mater Sci: Mater Med. 2014;25:1065–1075.
- Piella J, Bastús NG, Puntes V. Size-dependent protein-nanoparticle interactions in citrate-stabilized gold nanoparticles: the emergence of the protein corona. Bioconjugate Chem. 2017;28:88–97.
- Alcantar NA, Aydil ES, Israelachvili JN. Polyethylene glycol-coated biocompatible surfaces. J Biomed Mater Res. 2000;51:343–351.
- Dobrovolskaia MA, McNeil SE. Immunological properties of engineered nanomaterials. Nature Nanotech. 2007;2:469–478.
- Wang Z, Li J, Cho J, et al. Prevention of vascular inflammation by nanoparticle targeting of adherent neutrophils. Nature Nanotech. 2014;9:204–210.
- Chen S, Chen S, Zeng Y, et al. Size-dependent superparamagnetic iron oxide nanoparticles dictate interleukin-1β release from mouse bone marrow-derived macrophages. J Appl Toxicol. 2018;38:1–9.
- Dinarello CA. Biologic basis for interleukin-1 in disease. Blood. 1996;87:2095–2147.
- Radomski A, Jurasz P, Alonso-Escolano D, et al. Nanoparticle-induced platelet aggregation and vascular thrombosis. Br J Pharmacol. 2005;146:882–893.
- Coller BS. Blockade of platelet GP IIb/IIIa receptors as an antithrombotic strategy. Circulation. 1995;92:2373–2380.