
Abstract
The long-term safety and immunological effects of bovine poly-[haemoglobin-catalase-superoxide dismutase-carbonic anhydrase] in rats are studied by four-weekly 5% blood volume top-loading infusions followed by 30% blood volume exchange transfusion. There is no significant difference in growth, biochemistry and blood pressure between the control group receiving lactated ringer solution and those receiving the bovine poly-[haemoglobin-catalase-superoxide dismutase-carbonic anhydrase]. There is no significant change in mean arterial pressures (MAP) before and after each weekly top-loading infusion. After both the four weekly top-loading and the 30% exchange transfusions, the following safety and immune response evaluations are carried out. These include general studies on Ouchterlony double diffusion, total IgG and IgM, and complement activation. This is followed by quantitative measurements of specific antibodies against each of the following bovine components: Hb, CAT, SOD and CA in bovine poly-[haemoglobin-catalase-superoxide dismutase-carbonic anhydrase]. After the four weekly top-loading, each rat received a challenge of 30% blood volume exchange transfusion. The MAP, histamine and tryptase levels are tested before and after the 30% exchange transfusion. There are no anaphylactic reactions as shown by the MAP or histamine and tryptase. The results showed no safety problem nor adverse immune responses. All the rats survived when followed for one week after the 30% exchange transfusion.
Introduction
Serious research on blood substitutes only started after the HIV contaminated donor blood crisis in 1989. Nowadays, the worldwide demand and lack of supply of donor blood, as well as natural or man-made disasters or epidemics in some regions, resulted in an urgent need to develop blood substitutes [Citation1–7]. The first generation of blood substitute is haemoglobin-based oxygen carrier (HBOC). One of these is in the form of polyhaemoglobin (polyHb) prepared by crosslinking Hb with diacid [Citation8] or glutaraldehyde [Citation9]. PolyHb has since been developed independently by many groups. For example, glutaraldehyde cross-linked bovine polyHb developed by Biopure has undergone extensive clinical trials [Citation10] and already approved for routine clinical use in South Africa [Citation6]. Another group from Northfield has developed glutaraldehyde crosslinked human polyHb and has carried out extensive clinical trials on ambulance hemorrhagic shock patients in the USA [Citation11]. Their result shows that human polyHb can delay the need for blood transfusion by 12 h, while the saline control group requires blood transfusion within 1 h [Citation11]. However, there are 3% non-fatal cardiac side-effects in the polyHb group compared with 0.6% in the control saline group. The investigators suggest that it has the potential for use in fatal hemorrhagic shock when donor blood is not available [Citation11]. FDA did not approve this for clinical use, even though a number of investigators suggest that the risk/benefit ratios of polyHb have been shown in these emergency situations where donor blood is not available [Citation7,Citation10–12].
For further improvement, the second generation blood substitutes have been developed in the form of poly-[haemoglobin-catalase-superoxide dismutase-carbonic anhydrase] or poly-[Hb-CAT-SOD] with antioxidant functions [Citation13,Citation14]. This is important for ischemic condition including hemorrhagic shock to prevent ischaemia reperfusion injuries [Citation15] by removing oxygen radicals during transfusion [Citation16]. To enhance the antioxidant function, extra CAT and SOD enzymes are added to stroma-free haemoglobin (SFHb) for the development of poly-[Hb-SOD-CAT] which had been shown to prevent ischemia-reperfusion injury in a hemorrhagic shock-stroke rat model [Citation14]. Hsia’s group later extended this by using PEG-haemoglobin-antioxidant enzyme mimetics [Citation17,Citation18].
Researchers find that the mortality and the severity of myocardial ischemia in haemorrhagic shock are related to elevated intracellular pCO2 [Citation19]. Therefore, the third generation of blood substitute includes the addition of carbonic anhydrase (CA) to produce poly-[haemoglobin-catalase-superoxide dismutase-carbonic anhydrase] (poly-[Hb-CAT-SOD-CA]) [Citation20]. This fulfills all three major functions of red blood cells as O2 and CO2 carrier and oxygen radical remover. Poly-[Hb-CAT-SOD-CA] with enhanced enzyme activities has been tested in a rat model of 90-min hemorrhagic shock with loss of 2/3 of blood volume. The result shows that poly-[Hb-CAT-SOD-CA] with enhanced enzyme activities is more effective than whole blood in lowering the elevated intracellular pCO2, improve cardiac recovery and avoid histological changes in liver, kidney, heart and intestine [Citation21].
Stroma-free haemoglobin (SFHb), is prepared from the content of red blood cells with the removal of the lipid membrane. SFHb contains Hb and all the red blood cell enzymes, including CAT, SOD and CA. To enhance the red blood cell enzymes, commercial CAT, SOD and CA are added for the preparation of poly-[Hb-CAT-SOD-CA] [Citation20–23]. For avoiding the high cost of commercial enzymes, a cost-effective novel enzyme extraction method has been established to obtain these three enzymes from SFHb simultaneously [Citation24,Citation25]. This avoids the need for expensive commercial enzymes and allows the large-scale production of poly-[Hb-CAT-SOD-CA] in the future.
This paper studies the long-term safety and immune response to bovine sourced poly-[Hb-CAT-SOD-CA] (heterologous) in rats, using four-weekly top loading followed by a challenge with a larger volume ().
Figure 1. The rats are divided into 3 groups each receives 4 weekly infusion of one of the following samples: lactated ringer’s solution (LR) as control group, bovine polySFHb (Phe) and bovine poly-[Hb-CAT-SOD-CA] (PHE) with enhanced enzyme activity. This is followed on week 5 by a 30% exchange infusion.
![Figure 1. The rats are divided into 3 groups each receives 4 weekly infusion of one of the following samples: lactated ringer’s solution (LR) as control group, bovine polySFHb (Phe) and bovine poly-[Hb-CAT-SOD-CA] (PHE) with enhanced enzyme activity. This is followed on week 5 by a 30% exchange infusion.](/cms/asset/631b072a-5695-41e7-b892-3f5ef92fb8cf/ianb_a_1476375_f0001_c.jpg)
The rats are divided into three groups and received one of the following samples: lactated ringer’s solution (LR) as a control group, bovine polySFHb (Phe) and bovine poly-[Hb-CAT-SOD-CA] (PHE) with enhanced enzyme activity. Body weight, plasma biochemistry heart rate and mean blood pressure are tested during the four-weekly top-loading infusion period. Mean arterial pressures (MAP) are measured before and after each four-weekly top-loading. The immune study includes total IgG and IgM levels, Ouchterlony double diffusion, specific antibodies against bovine Hb, CAT, SOD and CA, and complement fragment 3a (C3a) activation test. After the four weekly top-loading, each rat is challenged with a larger 30% blood volume by exchange transfusion using one of control (LR), bovine Phe or bovine PHE. The MAP, total histamine and tryptase levels before and after transfusion are analyzed for possible anaphylactic reactions. There are no significant adverse response and no immunological reaction in rats against bovine sourced poly-[Hb-CAT-SOD-CA].
Methods and materials
Materials
Vivaspin 20 Centrifugal Filter with both 10 kDa cut-off polyethersulfone (PES) membrane (VS2002) and 300 kDa cut-off PES membrane (VS2052) are purchased from Sartorious Stedium Biotech (Gottingen, Germany). All other experimental and analytical chemical reagents are purchased from Sigma (St. Louis, MO, USA). Sprague-Dawley male rats are purchased from Charles River (Wilmington, USA). Mouse and Rat Tail Cuff Blood Pressure (MRBP) system is purchased from IITC Life Science Inc (Woodland Hills, CA, USA). Enzyme-linked immunosorbent assay (ELISA) kits are purchased from different companies as indicated bellowed.
Bovine stroma-free haemoglobin solution preparation
Stroma-free haemoglobin (SFHb) solution is the red blood cell content with the removal of a lipid membrane by an organic solvent. To separate red blood cells, the heparinized bovine whole blood is centrifuged at 4500 g at 4 °C for 30 min. Remove the plasma layer carefully by vacuum suction using Pasteur pipet. Used ice-cold lactated Ringer’s solution to ish the red blood cells thoroughly, then centrifuged (4500 g × 30 min) again to remove the plasma residue. Repeated the ishing steps for two more times. After removing the supernatant, we collected the red blood cells, then added 2 volumes of cold lysis buffer (15 mM sodium phosphate, pH 7.4) to the red blood cells. Mixed the lysis buffer and the cells and incubated the mixture at 4 °C for 30 min. Transferred the lyzed red blood cells to funnels and mixed with a half volume of cold toluene thoroughly. Placed the funnels in the fridge at 4 °C overnight. Discarded the upper organic layer, then centrifuged the hemolysate at 16,000 g for 2 h. Evacuated the extra toluene by vacuum on ice for 1 h. Dialyzed each volume of SFHb against 20 volumes of lactated Ringer’s solution (pH 7.4) at 4 °C overnight. Freeze the SFHb solution at −80 °C for storage.
Bovine enzyme extraction and mix with bovine stroma-free haemoglobin solution
SFHb contains haemoglobin and red blood cell enzymes including CAT, SOD and CA. The enzyme extracted had been established previously [Citation24,Citation25]. 300 ml bovine SFHb (Hb concentration: 9g/dL) is placed in a beaker on ice. 60 ml potassium phosphate buffer (3 M, pH = 7.4) is added to bovine SFHb. Stir the mixture with medium speed for 5 min on ice. Without stopping the stir, add drop-wise 120 ml ice-cold ethanol-chloroform solution with a speed of 1 drop/s. Continue stirring for 30 min with medium speed on the ice. Centrifuge solution 10 min at 5000 rpm at 4 °C. Collect supernatant layer (usually around 20 ml) which contains SOD, CA, and CAT in >80% recovery and Hb ≈ 0%. Transfer the supernatant to a new centrifugal tube, and centrifuge at 5000 rpm for 10 min at 4 °C to precipitate the suspending denatured Hb. Transfer 12 ml supernatant to each Vivaspin 20 centrifugal filter with10 kDa cut-off and centrifuge at 6000 rpm at 4 °C for 10 min. Add remaining supernatant to the same filters containing the enzyme solution and centrifuge at 6000 rpm for 15 min at 4 °C. Ish the extracted enzyme solution in the centrifugal unit with 5 ml PBS (pH 7.4) in each filter to remove the remaining ethanol, mix the solution, and then centrifuge at 6000 rpm at 4 °C for 15 min. Repeat the ishing steps two more times. To minimize the final volume of concentrated enzymes, ish the enzymes solution with 2 ml PBS (pH 7.4) in each filter and centrifuge at 6000 rpm at 4 °C for 15 min. The final volume of concentrated enzymes should be approximately 300 μl in each filter.
Polymerization and purification
We crosslinked the SFHb with or without enzymes by glutaraldehyde to produce polySFHb or poly-[Hb-CAT-SOD-CA]. Mix 60 ml bovine SFHb (Hb concentration: 7 g/dL) with or without the concentrated enzymes that are prepared as described above. Add 1.5 ml 4 M NaCl, 1.5 ml 3 M potassium phosphate buffer (pH 7.4), 229 μl 2 M lysine (200:1 lysine to haemoglobin molar ratio) and 0.84 g trehalose to SFHb or SFHb + enzymes mixture. Shake the mixture at 160 rpm at 4 °C for 5 min. The frozen glutaraldehyde (0.5 M) is thawed on ice water mixture by ultrasonic machine for 30 min. Mix glutaraldehyde evenly before use. Without stopping the shaker, add drop-wise 1.312 ml glutaraldehyde in 4 equal aliquots with intervals of 15 min. Keep shaking at 160 rpm overnight at 4 °C. Add 656 μl 2 M lysine (200:1 lysine to protein molar ratio) over 2 equal aliquots over 10 min and shake at 160 rpm at 4 °C for 1 h to quench. Centrifuge at 8000 rpm at 4 °C for 1 h to remove any precipitate.
The sample is purified using Vivaspin 20 centrifugal filter with 300 kDa cut-off by giving positive pressure with a centrifuge and lactated Ringer’s (LR, pH 7.4) solution to ish. After purification, the crosslinking product is dialyzed against lactated Ringer’s solution (/
=1:20) 4 °C overnight. The Hb concentration of the crosslinking sample is tested and adjusted to 7g/dL with LR solution. Freeze the samples at −80 °C until use.
Four Weekly small volumes (5% blood volume) top-loading infusions and measurement of body weight, biochemistry, antibodies, heart rate and mean arterial pressure
The Animal Ethics Committee of McGill University has approved this experimental protocol (protocol number: 2001–3816). Sprague–Dawley rats, weighing 175 ± 20 g, are randomly divided into three groups and each group contains six rats. The rats are intravenously injected every week for four weeks in total. All the samples are filtrated through 0.45 μm filters before the Top-loading infusion. We placed the rat into a restrainer in Mouse and Rat Tail Cuff Blood Pressure (MRBP) system (IITC Life Science Inc., Woodland Hills, CA, USA) and warmed it up (32 °C) for 15 min. We then measured the heart rate and MAP with the system. After the measurement, we injected the samples through tail vein. The following groups are injected once a week for 4 weeks in total:
Control LR: Lactated Ringer’s solution, 1 ml;
PHe: Bovine polySFHb (Hb: 7g/dL), 1 ml;
PHE: Bovine poly-[Hb-CAT-SOD-CA] (Hb: 7 g/dL), 1 ml.
Each rat is injected with 1 ml of sample per week, which simulates infusing 250 ml per week for human for 4 weeks. Let the rat rest for 5 min in the system, then measured the MAP again. On the 5th week, rat plasma samples are collected from the rats through tail artery under anesthesia. Detail analytical procedures are described in the following part of plasma collection.
Larger challenge of 30% blood volume exchange transfusion after the above 4 weekly small volumes (5% blood volume) top-load
At week 6, the rats grew up to 400 ± 25 g. We randomly selected four out of six rats after Top-loading infusion, then performed 30% blood volume exchange transfusion on the four rats with the same sample (LR, Phe, or PHE) that is used for the Top-loading infusion. The rat is anesthetized by consistent inhalation of isoflurane (12 ml/h, oxygen flow: 2 L/min) in a sealed chamber. When the rat is in the moderately deep plane of anesthesia, it is transferred to a ceramic plate with a heating pad for keeping the body temperature of the rat during the blood exchange. Electro-probes are used for monitoring the ECG by MP150 data acquisition and analysis system with Acknowledge software (BIOPAC Systems, Inc., Montreal, Canada). Isoflurane and oxygen are provided to a rat via inhalation mask throughout the whole procedure. Before the cannulation had been done, the isoflurane dose is 12 ml/h, oxygen flow: 2 L/min. A small incision about 1 cm is made on the skin at the left and the right femoral fossil region without cutting any tissue. Heparinized polyethylene catheters (PE10, Becton Dickinson and Company, Franklin Lakes, NJ, USA) are inserted into the left femoral artery and the right femoral artery and vein. The catheter in the left artery is connected to the MP150 system (BIOPAC Systems, Inc, Montreal, Canada) also for monitoring the MAP. The right femoral artery is cannulated for withdrawing the blood, while the right femoral vein is cannulated for infusion. After the catheters are placed in, isoflurane is adjusted to 6–9 ml/h, oxygen flow: 1–1.5 L/min). We allowed the MAP to be stabilized for 10 min after the adjustment of isoflurane/oxygen flow rate. After the stabilization, we withdraw 30% of the total blood volume (rat blood volume/rat body weight: 56 ml/kg) with a speed of 0.5 ml/min. Thus, we withdraw 7.5 ml of whole blood within 15 min. 1 ml of blood samples are collected for histamine and tryptase tests before infusion. We started to infuse the samples right after the bleeding within another 15 min. The samples for infusion are listed below. All the samples are filtrated through 0.45 μm filters before the infusion. After infusion, the MAP is monitored for 30 min to determine if there is an anaphylactic shock. Another 1 ml of blood samples are collected after the 30 min observation for histamine and tryptase analysis.
Control LR: Lactated Ringer’s solution, 22.5 ml (3 times volume of withdrawn sham blood);
Phe: Bovine polySFHb (Hb: 7 g/dL), 7.5 ml (same volume of sham blood);
PHE: Bovine poly-[Hb-CAT-SOD-CA] (Hb: 7 g/dL), 7.5 ml (same volume of sham blood).
At the end of the experiment, the catheters are removed, and arteries and vein are tied up with surgical polydioxanone suture (PDP304H, Ethicon) at the level of the femoral fossil to allow for anastomosis blood flow. 0.1 ml of lidocaine/bupivacaine is applied in the wound before closing the skin with surgical sutures (PDP304H, Ethicon). After the wounds are sutured, 0.4 ml of carprofen (10 mg/kg/day) is injected right away subcutaneously, and for the following two days thereafter. The rats are recovered from the 30% volume challenge and observed for one week.
Plasma collection
At week 5 and 7, after the rats are anesthetized by consistent inhalation of isoflurane (12 ml/hr, oxygen flow: 2 L/min). 2 ml blood is collected through a tail artery from each rat into lithium heparin tube. The whole blood samples are centrifuged at 1500 rpm, 4 °C for 30 min. Plasma is collected and stored at −80 °C until used.
Biochemistry test
The plasma biochemistry has been tested after four-week Top-loading infusion period and one-week recovery from blood exchange transfusion respectively to evaluate the safety of the samples to the rats with repeated injection. All the plasma samples are sent to the Animal Resources Centre at McGill University for the total panel test.
Quantification of total IgG and IgM levels in rats
To investigate the immune response to the samples, we tested the total IgG and IgM level in the rat plasma after four-week Top-loading infusion period and one week after 30% blood volume exchange transfusion respectively. The total IgG and total IgM are tested by the ELISA kits (Rat IgG total eBioscience 88–50490, Rat IgM eBioscience 88–50540). The testing methods are the same as instruction of the ELISA kits. Briefly, coat the ELISA plate with capture antibody (100 μl/well) in coating buffer, incubate overnight at 4 °C. Then block the plate with blocking buffer (250 μl/well) at room temperature for 2 h or at 4 °C overnight. After ishing the plates, adding 100 μl/well of standard samples with two-fold serial dilution or test plasma samples onto the plates, incubate for 2 h at room temperature. Add the detection antibody (100 μl/well) into the plates. Finally, add 100 μl/well of substrate solution (TMB) and stopping solution and read the plates at 450 nm and 570 nm. The values of 570 nm are subtracted from those of 450 nm for data analysis.
Ouchterlony double diffusion
In order to detect the antibodies that may be produced to against the Phe or PHE, we did the double diffusion test on the rat plasma samples. The method of Ouchterlony double diffusion has been described elsewhere [Citation26]. Agarose is dissolved in the PBS (pH7.2) to 1% by heating in a microwave. The agarose solution (10 ml) is poured to a depth of 5 mm into Petri dishes (diameter of 5 cm). The gels are allowed to cool down (for about 15 min) and form a gel at room temperature. Punch five holes (diameter of 7 mm) on each gel. Plasma samples from rats are loaded in the middle wells, while the other four wells are filled with 50 μl of the corresponding antigens (control LR, PHe and PHE) with serial concentrations: 0, 0.001 g/dL, 0.01 g/dL and 0.1 g/dL in the dilution of PBS (pH 7.4). The gel plates are then incubated at room temperature for 24 h.
Quantification of specific antibody against bovine haemoglobin, catalase, superoxide dismutase and carbonic anhydrase
To determine more specifically the antibodies against specific components in our poly-[Hb-CAT-SOD-CA], the ELISA tests for bovine Hb, CAT, SOD, and CA had been done on the rat plasma after four-week Top-loading infusion period and one-week after 30% blood volume exchange transfusion. Antigen coatings are prepared by loading the solutions of pure enzymes of SOD (Sigma-Aldrich, St. Louis, MO, USA), CAT (Sigma-Aldrich, St. Louis, MO, USA), CA (Sigma-Aldrich, St. Louis, MO, USA) and Hb (Sigma-Aldrich, St. Louis, MO, USA) on the plates for fluorescent ELISA. Antigen solutions (10 μg/ml) are prepared in carbonate-bicarbonate buffer (pH 9.6). 0.2 ml of the above solution is pipetted into each well of the microtiter plate, followed by incubation (covered) at room temperature for 2 h. After incubation, the coating solution is removed, and ished three times by PBST. 0.2 ml Aqua block buffer (Abcam, Cambridge, UK) is loaded into each well and incubate at room temperature for 2 h.
To make the standard curve, monoclonal primary antibodies against bovine SOD (Abcam, Cambridge, UK), CAT (Abcam, Cambridge, UK), CA (Abcam, Cambridge, UK), and Hb (Santa Cruz Biotech, Dallas, TX, USA) are prepared in the buffer for Immunosorbent Assay (PBST and Aqua block buffer v/v 1:4). The primary antibodies started with the dilutions of 1:10,000 (SOD), 1:10,000 (CAT), and 1:100,000 (CA) and 1:50 (Hb). To test the antibody concentration in the plasma samples, the plasma samples are diluted by 1:3000 into dilution buffer. After the blocking procedure, plates are ished three times with PBST and 0.2 ml of the diluted monoclonal antibody is added to each well and Incubated at 4 °C overnight.
On the next day, plates are ished with PBST five times, and the secondary antibodies (Alexa Fluor®z488, Abcam, Cambridge, UK) against the primary antibodies are prepared to be diluted 10,000 times with buffer for immunosorbent assay. 0.2 ml of this solution is added to each well, and incubated at room temperature for 2 h. After incubation, plates are also ished with PBST five times, and ensure there is no bubble remaining in each well. Absorbance is detected directly in a fluorescent microplate reader (Ex: 495 nm, Em: 519 nm).
Complement fragment 3a (C3a) activation
C3a levels in rat plasma samples are tested after four-week’s Top-loading infusion period and one-week after 30% blood volume exchange transfusion respectively. As an important anaphylatoxin in the immune response [Citation27], it is produced in the complement activation cascade, via the cleavage of complement fragment 3 (C3) by C3 convertase. There are three pathways to activate the complement: classical pathway, alternative pathway and mannose binding lectin (MBL) pathway. They all participate in the activation of C3 followed by the formation of C3a. Complement activation has been shown to play an important role in many adverse reactions to modified haemoglobin [Citation28]. With better sensitivity than C3, C3a is an indicator to monitor the complement activation [Citation29].
The C3a level is determined by the ELISA kit (Cloud-Clone Corp. SEA387Ra, Katy, USA), based on the procedure of complement activation test [Citation30] with slight changes. 0.1 ml of samples (control LR, PHe, or PHE) are mixed with 0.4 ml of corresponding plasma at 37 °C at 60 rpm for 1 h. The reaction is quenched by transferring 0.4 ml of the plasma-sample mixture into 2 ml EDTA tubes to obtain the test samples. The method of ELISA test is the same as instruction of the kit. Add 100 μl/well of standard samples with two-fold serial dilution and 20-fold diluted test samples on the ELISA plates provided. 100 μl of biotin-antibody is then added to each well, followed by adding HRP-avidin (100 μl/well). Finally, TMB substrate (90 μl/well) and stopping solution (50 μl/well) are applied. The concentrations of the samples are determined by their optical density under 450 nm wavelength. The values of 570 nm are subtracted from those of 450 nm for data analysis.
Additional analysis for potential anaphylaxis with the 30% blood volume challenge
Quantification of histamine levels in rat plasma
Histamine is released by mast cells that are activated by IgE. The important inflammatory mediator, histamine, acts on the vessel dilation, smooth muscle constriction and inflammation, which leads to anaphylactic shock or other allergy symptoms such as rash and asthma [Citation31]. Histamine levels are tested before and 30 min after the infusion of samples (control LR, PHe, PHE). The procedure is the same as the instruction of the ELISA kit (ab213975, Abcam, Cambridge, UK). Add 100 μl of assay buffer to the B0 (0 ng/ml standard) wells and 150 μl of the same assay buffer to the NSB wells on the ELISA plate provided. Pipette 100 μl/well of standard histamine with two-fold serial dilution and plasma samples. Add 50 μl/well of histamine tracer except for the blank, and 50 μl/well of histamine antibody to all wells except for the NSB and blank. Incubate the plate at room temperature for 1 h. Use ishing solution (∼400 μl/well) to ish the ELISA plate for three ishes in total. Add 200 μl/well of detection antibody into the wells except for the blank. Seal and incubate the plate for 30 min, followed by another three ishes. Applied 200 μl of TMB substrate and 50 μl of stopping solution to each well. Determined the optical density at 450 nm, subtracted by 570 nm value.
Quantification of tryptase levels in rat plasma
Tryptase is an enzyme released from mast cells when they are activated during the allergic responses. Hence, tryptase has been used as a diagnostic marker in anaphylaxis and mastocytosis [Citation32]. Tryptase levels are tested before and 30 min after the infusion of samples (control LR, PHe, PHE). The procedure is the same as the instruction of the ELISA kit (E02M0256, BlueGene). Add 100 μl of standards or plasma samples to the appropriate wells. Add 100 μl of PBS (pH 7.0–7.2) in the blank control wells. Add 50 μl of the conjugate solution to each well except the blank control wells and mixing the wells thoroughly. Cover and incubate the plate for 1 h at 37 °C. Ish the wells with ishing buffer for 5 times. Add 50 μl substrate A and 50 μl substrate B to each well including blank control well. Cover and incubate the plate for 10 min at 37 °C in the dark place. Add 50 μl stop solution to all the wells and determine the optical density at 450 nm using microplate reader.
Statistics
Data are presented in a way of mean ± standard deviation (SD). The difference among the control groups (lactated Ringer’s solution, LR) and bovine PHe and PHE groups are assessed by one-way ANOVA. To determine the relationship between the MAP and the week of injection, and the MAP changes during the 30 min observation period in the exchange transfusion, the correlation coefficients and its p values by two-sided are tested, with methods of Pearson, Kendall and Spearman. The confidence level is 95% in all tests.
Results
Effects on body weight
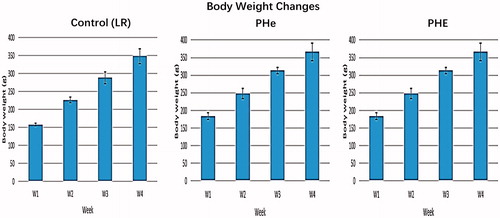
shows that the body weights of rats increase from 178 ± 20 g to 357 ± 30 g in four weeks. There are no significant differences from the control group of lactated Ringer.
Figure 2. Body weight changes of the rats during the four-week Top-loading infusion period. The body weight is measured in gram (g). Each figure shows a group of rats injected with corresponding sample (control LR, PHe, PHE). The body weight in rats injected with control (LR) are 158 ± 3.7 g, 227 ± 7 g, 288 ± 17 g, 348 ± 20 g. The body weight in rats injected with bovine PHe are 183 ± 9 g, 248 ± 15 g, 313 ± 9 g, 366 ± 25 g. The body weight in rats injected with bovine PHE are 198 ± 4 g, 257 ± 5 g, 318 ± 9 g, 367 ± 9 g. There are no significant differences from the control group.
Effects on biochemistry
Biochemistry in rat plasma samples are tested after four-weekly 5% top-load and also one-week after 30% blood exchange transfusion (). For better interpretation and visualization of the results, some important indicators are selected for analysis in and .
Figure 3. BUN urea, creatinine and CK levels. All data are in . No significant statistical differences from the control groups.
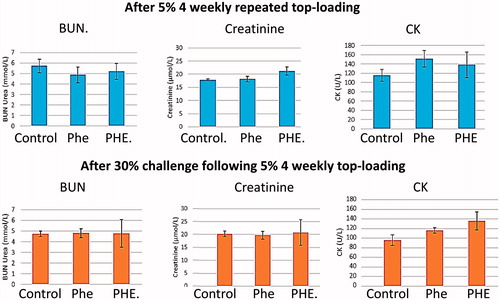
Figure 4. Albumin, total bilirubin, ALT and AST levels. All data are in . No significant statistical differences from the control groups.
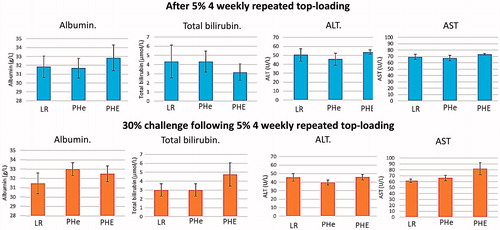
Table 1. Biochemistry test.
The indicators of kidney function, blood urea nitrogen (BUN) and creatinine, showed no significant difference between the control (LR) groups and the bovine sample groups. Albumin, albumin/globulin ratio, alanine transaminase (ALT), aspartate aminotransferase (AST) and bilirubin are the indicators of liver function. There are no significant difference among the control groups and bovine blood substitute groups. The level of creatine kinase (CK) also showed no significant difference between the control (LR) groups and the bovine sample groups in CK levels.
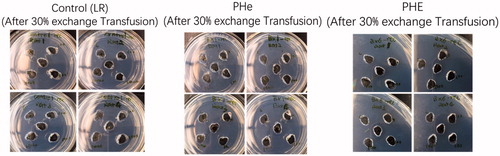
Ouchterlony double diffusion
Ouchterlony double diffusion test on the rat plasma samples are conducted to detect any antibodies produced against the bovine poly-[Hb-CAT-SOD-CA] after four-weekly top-loading infusions and one-week after exchange transfusion. Plasma samples are in the middle wells of the plates. Antigens with different concentrations are added to the peripheral wells. The concentrations of the antigens in the upper left, upper right, lower right and lower left wells are 0, 0.001 g/dL, 0.01 g/dL and 0.1 g/dL, respectively. These concentrations of antigens added to the wells gives a wide detectable range for the specific antibodies in plasma. If the plasma samples contain the antibodies that are against the injected antigens, an antibody-antigen precipitation would present between the two wells. Otherwise, no precipitation can appear.
is the positive control of bovine serum albumin (BSA) showing BSA and anti-BSA antibody precipitation. for negative control, lactated Ringer, shows no precipitation line. shows no precipitation line with no antibodies against the bovine PolySFHb (PHe) or bovine poly-[Hb-CAT-SOD-CA] (PHE). After 30% blood volume exchange transfusion with control (LR), PHe or PHE, there is also no antigen-antibody precipitation ().
Figure 5. Ouchterlony double diffusion test. Positive control of BSA showing BSA and anti-BSA antibody precipitation.
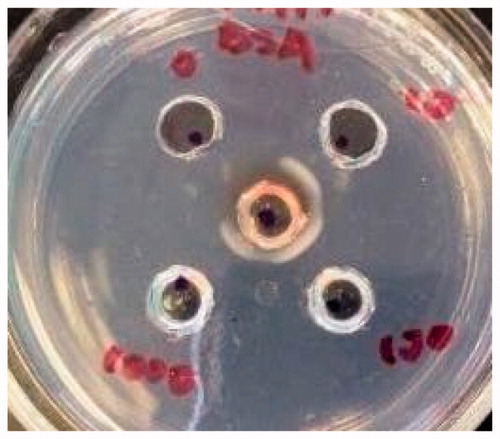
Figure 6. Ouchterlony double diffusion test on rats after 4 weekly 5% top-loading infusion with lactated ringer’s solution as control, Bovine PHe or PHE (6 rats/group) showing no antigen-antibody precipitations.
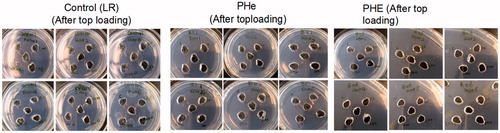
Figure 7. Ouchterlony double diffusion test on rats after 30% blood volume exchange transfusion with control (LR), PHe, or PHE (4 rats/group)) showing no antigen-antibody precipitations.
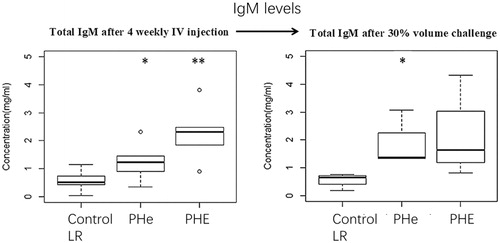
Effects on total IgG and IgM levels in rats
Total IgG and IgM levels are tested after four-weekly 5% top-loading and after 30% blood volume exchange to study the immune response to bovine poly-[Hb-CAT-SOD-CA] in rats ( and ). For total IgG tests (), there is no significant difference between the LR (control) group and the other two bovine samples groups. Total IgM levels () after top-loading infusion with LR control group, PHe or PHE are 0.56 ± 0.33 mg/ml, 1.24 ± 0.60 mg/ml and 2.28 ± 0.87 mg/ml; p values by one-way ANOVA is .002 (<.05). Total IgM levels after 30% blood volume exchange transfusion with LR control group, PHe or PHE are 0.57 ± 0.22 mg/ml, 1.79 ± 0.75 mg/ml and 2.11 ± 1.33 mg/ml; p values by one-way ANOVA is .14 (>.05). However, if we only compare the control group and PHe group by student’s T-test, the p values is .035 (<.05); compare the control group and PHE by student’s T-test, p value is .093 (>.05).
Figure 8. Total IgG levels after four-weekly 5% blood volume top-loading infusions followed by 30% blood volume exchange transfusion. After four-weekly injection-period, the total IgG levels in rat plasma against LR control group, PHe and PHE are 5.42 ± 2.36 mg/ml, 7.88 ± 3.13 mg/ml and 10.41 ± 7.80 mg/ml, respectively; p values by one-way ANOVA is .32 (>.05). After 30% blood volume exchange transfusion, the total IgG concentrations in LR control group, PHe and PHE group are 5.84 ± 1.86 mg/ml, 7.82 ± 3.27 mg/ml and 9.24 ± 5.80 mg/ml; p values by one-way ANOVA is .60 (>.05).
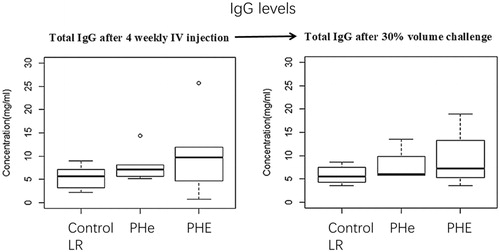
Figure 9. Total IgM levels after four-weekly 5% blood volume top-loading infusions followed by 30% blood volume exchange transfusion. Total IgM levels after top-loading infusion with LR control group, PHe or PHE are 0.56 ± 0.33 mg/ml, 1.24 ± 0.60 mg/ml and 2.28 ± 0.87 mg/ml; p values by one-way ANOVA is .002 (<.05). Total IgM levels after 30% blood volume exchange transfusion with LR control group, PHe or PHE are 0.57 ± 0.22 mg/ml, 1.79 ± 0.75 mg/ml and 2.11 ± 1.33 mg/ml; p values by one-way ANOVA is .14 (>.05). However, if we only compare the control group and PHe group by student’s T-test, the p value is .035 (<.05); compare the control group and PHE by student’s T-test, p value is .093 (>.05).
Effects on specific antibody against bovine haemoglobin, catalase, superoxide dismutase and carbonic anhydrase
IgG and IgM changes could be due to many other reasons. The above double diffusion studies show that there is no antibody produced to the poly-[Hb-CAT-SOD-CA] complex itself. For more specific analysis, we carry out further studies on the potential antibody produced specifically against each component within bovine sourced poly-[Hb-CAT-SOD-CA], the excess of haemoglobin in the poly-[Hb-CAT-SOD-CA] complex nanoencapsulate, the more antigenic enzymes and can prevent them from theimmunological response ().
Figure 10. The excess hemoglobin in the poly-[Hb-CAT-SOD-CA] complex nanoencapsulate the more antigenic enzymes.
![Figure 10. The excess hemoglobin in the poly-[Hb-CAT-SOD-CA] complex nanoencapsulate the more antigenic enzymes.](/cms/asset/7e0b9d7c-41d0-4145-8169-120410ea83f2/ianb_a_1476375_f0010_c.jpg)
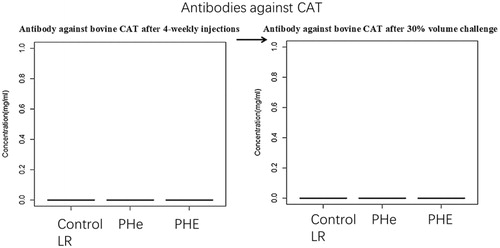
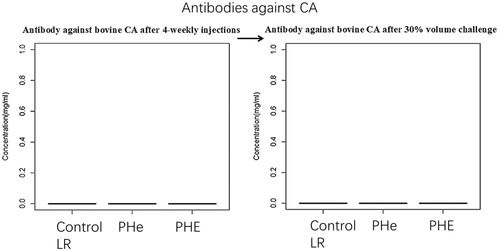
Thus, specific antibodies against bovine Hb, CAT, SOD and CA are determined after: (1) four weekly top-loading infusions of LR, PHe and PHE; and (2) four weekly top-loading infusions of LR, PHe and PHE followed by 30% blood volume exchange transfusion. As we can see from and , after 5% top-loading infusion and followed by 30% exchange transfusion, there are no antibodies against bovine CAT and CA. There is also no significant difference in antibody levels against bovine Hb and SOD among control group (LR) and sample groups (PHe and PHE) ( and ).
The values of anti-bovine Hb antibodies are 0.41 ± 0.09 mg/ml, 0.49 ± 0.13 mg/ml and 0.42 ± 0.08 mg/ml, respectively. The p values by one-way ANOVA is .83 (> .05). After 30% blood volume exchange, the antibodies against Hb in the group of control (LR), PHe and PHE are 0.44 ± 0.14 mg/ml, 0.40 ± 0.10 mg/ml and 0.52 ± 0.11 mg/ml, respectively; p values by one-way ANOVA is .47 (> .05). The antibodies against SOD after four-weekly top-loading in control (LR), PHe and PHE are 1.92 ± 2.09 ng/ml, 1.30 ± 2.11 ng/ml and 1.28 ± 2.57 ng/ml, respectively. p Values by one-way ANOVA is .48 (> .05). The antibodies against bovine SOD control (LR), PHe and PHE are 21.13 ± 7.57 ng/ml, 28.79 ± 15.07 ng/ml and 6.80 ± 7.79 ng/ml; p values by one-way ANOVA is .09 (> .05).
Figure 11. The antibodies levels against SOD after 4-weekly Top-loading infusions in group of control (LR), PHe and PHE are 1.92 ± 2.09 ng/ml, 1.30 ± 2.11 ng/ml and 1.28 ± 2.57 ng/ml respectively. p Values by one-way ANOVA is .48 (> .05). The antibodies against bovine SOD in group of control (LR), PHe and PHE are 21.13 ± 7.57 ng/ml, 28.79 ± 15.07 ng/ml and 6.80 ± 7.79 ng/ml; p values by one-way ANOVA is .09 (> .05).
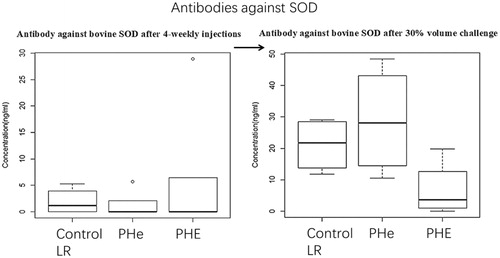
Figure 12. The concentration of antibodies against bovine Hb after four-weekly injection in group of control (LR), PHe and PHE are 0.41 ± 0.09 mg/ml, 0.49 ± 0.13 mg/ml and 0.42 ± 0.08 mg/ml, respectively. The p values by one-way ANOVA is .83 (> .05). After 30% blood volume exchange, the antibodies against Hb in group of control (LR), PHe and PHE are 0.44 ± 0.14 mg/ml, 0.40 ± 0.10 mg/ml and 0.52 ± 0.11 mg/ml, respectively; p values by one-way ANOVA is .47 (> .05).
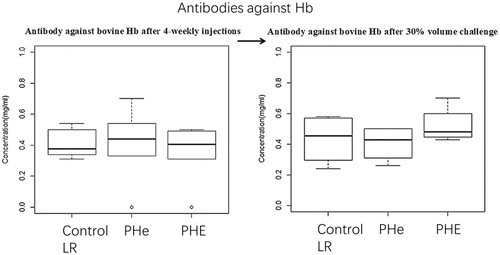
Figure 13. Antibody against bovine CAT after 4-weekly injections followed by 30% blood volume exchange transfusion. No antibody is detected.
Effects on C3a activation
For more detailed evaluation of the immune response in terms of complement activation in rats, C3a levels after: (1) four-week 5% intravenous injections and (2) four-week t5% op-loading infusions followed by 30% blood volume exchange (). In both cases, no significant difference can be seen in C3a levels between the LR control group and blood substitute groups.
Figure 14. Antibody against bovine CA after four-weekly injections followed by 30% blood volume exchange transfusion. No antibody is detected.
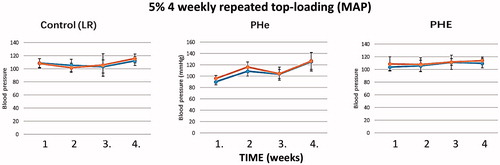
Effects on mean arterial pressure during each 4-weekly intravenous injection
MAP is measured before and after each four-weekly 5% top-loading each week. No significant difference in MAP between before and after injection can be seen (). The correlation test is performed by r program, and the p values of all the correlation coefficients are > .05, thus we cannot reject the hypothesis that the correlation coefficients are 0.
Figure 15. C3a activation test. After four-weekly injections, C3a levels in LR control group, PHe and PHE groups are 144.49 ± 4.39 ng/ml, 150.74 ± 6.38 ng/ml and 153.56 ± 9.90 ng/ml, respectively; p values by one-way ANOVA is .16 (>.05). After four-week top-loading infusions followed by 30% blood volume exchange, C3a levels in LR control group, PHe and PHE groups are 150.74 ± 1.60 ng/ml, 149.70 ± 2.77 ng/ml and 150.50 ± 3.18 ng/ml, respectively; p values by one-way ANOVA is .88 (>.05).
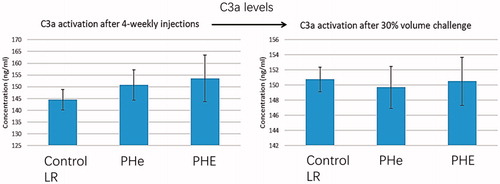
Figure 16. Mean arterial pressures are recorded just before and 5 min after each top-loading infusion. Each figure shows a group of rats injected with corresponding sample. Control (LR): the correlation coefficients between the blood pressure before or after injection are 0. 27 and 0.56, respectively. The p values of the coefficients are 0.73 and 0.44, respectively. PHe: the correlation coefficients between the blood pressure before or after injection are 0.89 and 0.77, respectively. The p values of the coefficients are 0.11 and 0.23, respectively. PHE: the correlation coefficients between the blood pressure before or after injection are 0.16 and 0.30, respectively. The p values of the coefficients are 0.24 and 0.25, respectively.
Effect of 4 weekly 5% toploading followed by 30% blood volume exchange transfusion on mean arterial pressure
The MAP changes are monitored and recorded as shown in .
Figure 17. Mean arterial pressure during the 30% blood volume exchange transfusion. Each figure showed a group of rats infused with one of lactated ringer’s solution (control), PHe, PHE. Control (LR): the correlation coefficients of the blood pressure before and after infusion is 0.13. The p values of the coefficient is .55. PHe: the correlation coefficient between the blood pressure before or after infusion is −0.03. The p values of the coefficient is .87. PHE: the correlation coefficients between the blood pressure before or after infusion are −0.16. The p values of the coefficient is .45. Thus, there are no significant changes.
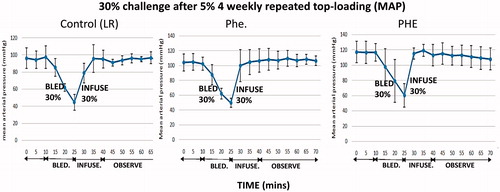
The first 10 min is the stabilization period. This is followed by 15 min of bleeding period with the removal of 30% of blood. After this, one of the samples (LR, PHe, PHE) is infused over 15 min. This is followed by 30 min of observation. There are no significant changes in MAP during the 30 min post-infusion period. Neither upward nor downward trend can be seen. The p values of all the correlation coefficients for the MAP in the 30 min observation period are > .05, thus we cannot reject the hypothesis that the correlation coefficients are 0. Therefore, no anaphylactic shock is observed after 30% blood volume exchange transfusion. In order for a more detailed test of anaphylactic changes, plasma histamine and tryptase are also followed ( and ).
Figure 18. In anaphylactic reaction both histamine and tryptase are released from the mast cells.
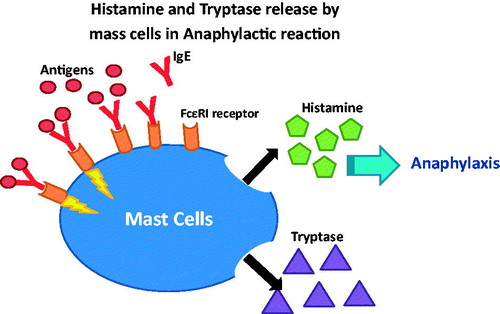
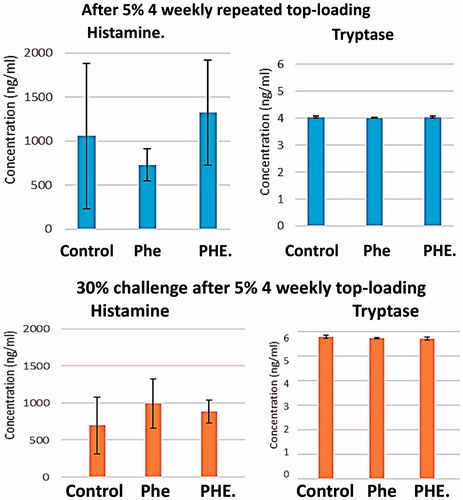
Figure 19. Histamine and tryptase levels tested before and 30 min after 30% blood volume exchange transfusion of LR (control), PHe or PHE. Plasma trptase analysis is more accurate than histamine as shown by the higher SD for histamine. The histamine levels: the p values by one-way ANOVA among the three groups is .62 (>.05). The tryptase levels: comparing the LR control groups and the PHe and PHE groups, the p values by one-way ANOVA is .51 (>.05) before infusion, and the p values of after infusion is .21 (>.05). Thus, there are no significant changes in the histamine or tryptase levels between the control group and the PHe and PHE groups.
Additional specific analysis on the potential anaphylactic effect as shown by histamine levels and tryptase levels before and after the larger challenge of 30% exchange transfusion
The release of histamine by mast cells is responsible for anaphylactic reaction (). However, histamine is unstable and measurement of plasma histamine is not accurate. Tryptase is also released by the mast cell in an anaphylactic reaction. It is more stable and as a result, the measurement of plasma tryptase is more accurate.
To investigate more quantitatively whether there are any anaphylactic reactions after the larger challenge of 30% blood volume, histamine and tryptase levels are tested before and 30 min after infusion of samples (LR, PHe or PHE). There are no significant differences in histamine and tryptase analysis when comparing the LR control group and the bovine PolySFHb (PHe) and poly-[Hb-CAT-SOD-CA] (PHE) groups ().
Histamine and tryptase levels are tested before and 30 min after 30% blood volume exchange transfusion of LR (control), PHe or PHE. The histamine levels in LR control group before and after infusion are 1058.62 ± 825.06 ng/ml and 695.47 ± 384.02 ng/ml. The histamine levels in PHe group before and after infusion are 730.37 ± 182.28 ng/ml and 992.30 ± 334.91 ng/ml. The histamine levels in PHE group before and after infusion are 1323.64 ± 598.83 ng/ml and 882.72 ± 156.77 ng/ml. The p values by one-way ANOVA among the three groups is .62 (>.05). The tryptase levels before infusion in LR, PHe and PHE groups are 4.04 ± 0.03 ng/ml, 4.01 ± 0.01 ng/ml and 4.04 ± 0.03 ng/ml; while after infusion, the values are 5.79 ± 0.06 ng/ml for the LR control group, 5.73 ± 0.02 ng/ml for PHe, and 5.71 ± 0.05 ng/ml for PHE. By comparing the LR control groups and the blood substitutes groups, the p values by one-way ANOVA is .51 (>.05) before the infusion, and the p values of after infusion is .21 (>.05). Thus, there are no significant changes in the histamine or tryptase levels between the control group and the PHe and PHE groups.
Discussion
In the present paper, we study the long-term safety and immunological effects of heterologous poly-[Hb-CAT-SOD-CA] (PHE) in rats after (1) four weekly 5% blood volume top-loading and (2) four weekly 5% blood volume top-loading followed by 30% blood volume exchange transfusion.
The rats in both the control group and bovine groups grew by 60 ± 10 g/week; and no significant difference between LR control group and PHe, PHE. There are no significant differences in the biochemistry between the control LR group and the bovine sample groups. The MAP before and after each of the four-weekly 5% top-loading showed no significant changes; and there is no significant difference between the control group and PHe, PHE groups. These results suggest that there are no adverse effects in rats after four weekly intravenous injections.
The effect on the immunological response is also studied. Ouchterlony double diffusion test is first performed as a screening test to see if there are any antibodies produced against the PHe, PHE complexes. There is no precipitate on the plates showing the absence of antibodies. This is followed by another screening test on the total IgG and IgM and there are no significant changes detected in IgG ELISA test. However, the IgM concentrations after top-loading infusions with bovine PolyHb-CAT-SOD-CA groups are higher than that in the control group (p < .05). Since total IgG and IgM test are nonspecific and could be the result of other causes, we carried out the more specific analysis by quantification of specific antibodies to the specific bovine components in PHe and PHE (Hb, CAT, SOD and CA). Specific antibodies against bovine CAT and CA are not detected; and no significant difference can be seen in the antibodies against bovine Hb or SOD between the control (LR) group and Phe, PHE. Moreover, no C3a activation is detected.
In order to rule out the possibility of an anaphylactic reaction, we carried out the following study. Four weekly 5% blood volume top-loading infusions of LR, PHe and PHE is followed by 30% blood volume exchange transfusion. The MAPs before and after each of the four weekly 5% toploading showed no significant changes. There are also no significant changes after the larger challenge of 30% blood exchange following the 4 weekly 5% top-loading. There are also no significant alterations in histamine and tryptase levels before and after the 5% top-loading and also the 30% challenge that followed this. When followed for one week, all the rats survive and in good health after the 30% volume exchange transfusion. Thus, no anaphylactic reactions or adverse immune response are observed.
In summary, no adverse long-term safety problems and mortality happened after the four weekly 5% volume top-load followed by the 30% volume challenge. This study shows the potential to use bovine PolyHb-CAT-SOD-CA with enhanced red blood cell enzymes for transfusion.
Acknowledgements
Professor Phil Gold suggested the use of tryptase analysis. This laboratory is not connected with any commercial organizations. The research support for the study reported here comes from the joint program of the Canadian Blood Service/Canadian Institutes of Health Research that requires the authors to state that: “The opinions expressed in this article are the opinions of the investigators of this paper and not necessarily those of the Canadian Government nor of the Canada Blood Service”.
Disclosure statement
The authors report no conflict of interest. The authors alone are responsible for the content and writing of the paper.
Additional information
Funding
References
- Chang TMS. 2007. Monograph on artificial cells: biotechnology, nanotechnology, blood substitutes, regenerative medicine, bioencapsulation. Singapore/London: World Science Publisher/Imperial College Press.
- Chang TMS. Nanobiotechnology for haemoglobin-based blood substitutes. Crit Care Clin. 2009;25:373–382.
- Chang TMS. From artificial red blood cells, oxygen carriers. Artif Cells Blood Immobil Substit Biotechnol. 2012;40:197–199.
- Chang TMS. Translational feasibility of soluble nanobiotherapeutics with enhanced red blood cell functions. Artif Cells Nanomed Biotechnol. 2017;45:671–676.
- Kim HW, Greenburg AG. Hemoglobin-based oxygen carriers as red cell substitutes and oxygen therapeutics. New York: Springer; 2014.
- Mer M, Hodgson E, Wallis L, et al. Hemoglobin glutamer-250 (bovine) in South Africa: consensus usage guidelines from clinician experts who have treated patients. Transfusion 2016;56:2631–2636.
- Weiskopf RB, , Beliaev AM, Shander A, et al. Addressing the unmet need of life-threatening anemia with hemoglobin-based oxygen carriers. Transfusion. 2017;57:207–214.
- Chang TMS. Semipermeable microcapsules. Science. 1964;146:524–525.
- Chang TMS. Stabilisation of enzymes by microencapsulation with a concentrated protein solution or by cross-linking with glutaraldehyde. Biochem Biophys Res Commun. 1971;44:1531–1533.
- Jahr JS, Mackenzie C, Pearce LB, et al. HBOC-201 as an alternative to blood transfusion: efficacy and safety evaluation in a multicenter phase III trial in elective orthopedic surgery. J Trauma. 2008;64:1484–1497.
- Moore EE, Moore FA, Fabian TC, et al. Human polymerized hemoglobin for the treatment of hemorrhagic shock when blood is unavailable: the USA multicenter trial. J Am Coll Surg. 2009;208:1–13.
- Weiskopf RB, Silverman TA. Balancing potential risks and benefits of hemoglobin-based oxygen carriers. Transfusion. 2013;53:2327–2333.
- D'Agnillo F, Chang TM Polyhemoglobin-superoxide dismutase-catalase as a blood substitute with antioxidant properties. Nat Biotechnol. 1998;16:667–671.
- Powanda DD, Chang TM. Cross-linked polyhemoglobin-superoxide dismutase-catalase supplies oxygen without causing blood-brain barrier disruption or brain edema in a rat model of transient global brain ischemia-reperfusion. Art Cells Blood Subs and Immob Biotech. 2001;30:23–37.
- Alayash AI. Redox biology of blood. Antioxid Redox Signal. 2004;6:941–943.
- Alayash AI, D'Agnillo F, Buehler PW. First-generation blood substitutes: what have we learned? Biochemical and physiological perspectives. Expert Opin Biol Ther. 2007;7:665–675.
- Buehler PW, Haney CR, Gulati A, et al. Polynitroxyl hemoglobin: a pharmacokinetic study of covalently bound nitroxides to hemoglobin platforms. Free Radic Biol Med. 2004;37:124–135.
- Ma L, Hsia CJ. Polynitroxylated hemoglobin as a multifunctional therapeutic for critical care and transfusion medicine. In: Chang TMS. Selected topics in nanomedicine. Singapore: World Science Publisher and Imperial College Press; 2013.
- Sims C, Seigne P, Menconi M, et al. Skeletal muscle acidosis correlates with the severity of blood volume loss during shock and resuscitation. J Trauma. 2001;51:1137–1145.
- Bian Y, Rong Z, Chang TMS. Polyhemoglobin-superoxide dismutase-catalase-carbonic anhydrase: a novel biotechnology-based blood substitute that transports both oxygen and carbon dioxide and also acts as an antioxidant. Artifi Cells Blood Substit Biotechnol. 2011;39:127–136.
- Bian Y, Chang TMS. A novel nanobiotherapeutic poly-[hemoglobin-superoxide dismutase-catalase-carbonic anhydrase] with no cardiac toxicity for the resuscitation of a rat model with 90 minutes of sustained severe hemorrhagic shock with loss of 2/3 blood volume. Artifi Cells Nanomed Biotechnol. 2015;43:1–9.
- Bian Y, Gao W, Chang TMS. Lowering of elevated tissue PCO2 in a hemorrhagic shock rat model after reinfusion of a novel nanobiotechnological polyhemoglobin-superoxide dismutase-catalase-carbonic anhydrase that is an oxygen and a carbon dioxide carrier with enhanced antioxidant pro. Artifi Cells Nanomed Biotechnol. 2013;41:60–68.
- Bian Y, Guo C, Chang TMS. Temperature stability of poly-[hemoglobin-superoxide dismutase-catalase-carbonic anhydrase] in the form of a solution or in the lyophilized form during storage at −80 °C, 4 °C, 25 °C and 37 °C or pasteurization at 70 °C. Artif Cells Nanomed Biotechnol. 2016;44:41–47.
- Guo C, Gynn M, Chang TMS. Extraction of superoxide dismutase, catalase, and carbonic anhydrase from stroma-free red blood cell hemolysate for the preparation of the nanobiotechnological complex of polyhemoglobin–superoxide dismutase–catalase–carbonic anhydrase. Artif Cells Nanomed Biotechnol. 2015;43:157–162.
- Chang TMS. Red blood cell replacement or nanobiotherapeutics with enhanced red blood cell functions? Artif Cells Nanomed Biotechnol. 2015;43:145–147.
- Bailley GS. Ouchterlony double immunodiffusion. In: Walker JM. The protein protocols handbook. Totowa: Humana Press Inc.; 1996. p. 749–752.
- Bajic G, Yatime L, Klos A, et al. Human C3a and C3a desArg anaphylatoxins have conserved structures, in contrast to C5a and C5a desArg. Protein Sci. 2013;22:204–212.
- Ning J, Chang TMS. Effects of homologous and heterologous stroma-free hemoglobin and polyhemoglobin on blood cell counts, complement activation and coagulation factors in rats. Biomat Artif Cells Artif Organs. 1987;15:380.
- Ning J, Chang TMS. Effects of homologous and heterologous stroma-free hemoglobin and polyhemoglobin on complement activation, leucocytes and platelets. Biomat Artif Cells Artif Organs. 1990;18:219–233.
- Chang TMS. Blood Substitutes: principles, methods, products, and clinical trials. Basel: Karger Landes; 1997.
- Amin K. The role of mast cells in allergic inflammation. Respir Med. 2012;106:9–14.
- Sperr WR, Jordan JH, Fiegl M, et al. Serum tryptase levels in patients with mastocytosis: correlation with mast cell burden and implication for defining the category of disease. Int Arch Allergy Immunol. 2002;128:136–141.
- Ao-ieong ESY, Alexander W, Jani V, et al. Cardiac function during resuscitation from hemorrhagic shock with polymerized bovine hemoglobin-based oxygen therapeutic. Artif Cells Nanomed Biotechnol. 2017;45:686–693.
- Arthurs G, Sudhakar M. Carbon dioxide transport. Continuing Education in Anaesthesia. Crit Care Pain. 2005;5:207–210.
- Geers C, Gros G. Carbon dioxide transport and carbonic anhydrase in blood and muscle. Physiol Rev. 2000;80:681–715.
- Jiang W, Bian Y, Wang Z, Chang TMS. Hepatoprotective effects of poly-[hemoglobin-superoxide dismutase-catalase-carbonic anhydrase] on alcohol-damaged primary rat hepatocyte culture in vitro. Artif Cells Nanomed Biotechnol. 2016;45:46–50.
- Liu H, Yan C, Yan K, et al. Study of the effects of polymerized porcine hemoglobin (pPolyHb) in an acute anemia rat model. Artif Cells Nanomed Biotechnol. 2017;4:694–700.
- Martucci AF, Martucci AC, Cabrale P, et al. Acute kidney function and morphology following topload administration of recombinant hemoglobin solution. Artif Cells Nanomed Biotechnol. 2017;45:24–30.
- Terraneo L, Bianciardi P, Malavalli A, et al. Hemoglobin extravasation in the brain of rats exchange-transfused with hemoglobin-based oxygen carriers. Artif Cells Nanomed Biotechnol. 2017;45:710–716.
- Wang L, Liu F, Yan K, et al. Effects of resuscitation with polymerized porcine hemoglobin (pPolyHb) on hemodynamic stability and oxygen delivery in a rat modelof hemorrhagic shock. Artif Cells Nanomed Biotechnol. 2017;45:51–57.
- Zhao J, Yan C, Xu L, et al. The effect of pPolyHb on hemodynamic stability and mesenteric microcirculation in a rat model of hemorrhagic shock. Artif Cells Nanomed Biotechnol. 2017;45:677–685.
- Zhu H, Du Q, Chen C, et al. The immunological properties of stroma-free polyhemolysate containing catalase and superoxide dismutase activities prepared by polymerized bovine stroma-free hemolysate. Artif Cells Blood Substit Immobil Biotechnol. 2010;38:57–63.