
 ?Mathematical formulae have been encoded as MathML and are displayed in this HTML version using MathJax in order to improve their display. Uncheck the box to turn MathJax off. This feature requires Javascript. Click on a formula to zoom.
Abstract
A core–shell protein cluster comprising hemoglobin and human serum albumins, hemoglobin–albumin cluster (Hb–HSA3), was designed and synthesized for use as an artificial O2 carrier and red blood cell (RBC) substitute. For initial preclinical safety evaluation of the Hb–HSA3 solution, we observed blood compatibility in vitro, physiological responses after exchange transfusion into rats and blood circulation lifetime in dogs. Dilution of human whole blood with Hb–HSA3 showed an appropriate decrease in blood cell number, proportional to the mixing volume ratio. Time courses in the circulation parameters and blood gas parameters after 20% exchange transfusion with Hb–HSA3 in anesthetized rats were almost identical to those observed in a sham group (without infusion) and an HSA group (with HSA administration) for 6 h. Serum biochemical tests of the withdrawn blood indicated safety of the protein cluster. Furthermore, fluorescent Hb–HSA3 was infused into beagle dogs to assess blood retention. Fluorescence measurements of the blood samples enabled us to ascertain the cluster half-life within the intravascular space. Histopathologic inspections of the vital organs imply no abnormality in tissues. All these results indicate sufficient initial preclinical safety of Hb–HSA3 as an alternative material for use in RBC transfusion.
Introduction
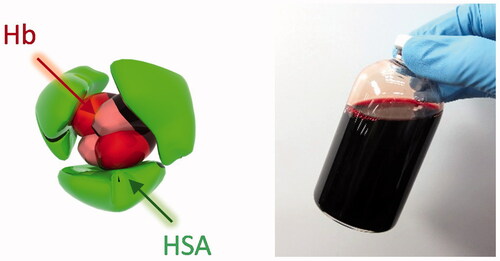
Blood shortages have become a severe healthcare problem worldwide. Shortages will worsen particularly in economically developed countries because of declining blood donation, aging society and complex therapies [Citation1,Citation2]. Consequently, red blood cell (RBC) substitutes for practical use are required as a medical measure to supplement blood transfusion treatment. Since the 1980s, hemoglobin (Hb)-based O2 carriers (HBOCs) of several kinds have been prepared and clinically tested [Citation3–12]. Despite great efforts, none has been approved yet for commercial use as an RBC alternate. The transfusions of these products often induce the vasoconstriction and a subsequent increase in systemic and pulmonary artery pressure [Citation13–15]. Possible mechanisms involve penetration of the Hb derivatives into interstitial space of the subendothelial layers of vessel walls with subsequent nitric oxide (NO) scavenging [Citation16–19]. The extravasated Hbs bind to NO and shift the vasomotor tone to vasoconstriction. Given that background, there is much current interest in synthesizing perfect HBOCs having ideal safety and efficacy. We earlier reported a unique core–shell structured protein cluster comprising Hb at the center and human serum albumin (HSA) at the exterior: hemoglobin–albumin cluster (Hb–HSA3, ) [Citation20–24]. Atomic force microscopy observation in aqueous medium and 3 D reconstruction based on cryogenic transmission microscopy images revealed a distinctly triangular morphology [Citation24]. We confirmed that Hb–HSA3 is a biocompatible O2 carrier that did not elicit acute hypertensive action in rats [Citation23]. It was explained using electrostatic repulsion between the negative surface net charges of Hb–HSA3 and basement membrane around the endothelial cells, which avoids the escape of the cluster from the intravascular space. The Hb–HSA3 showed 1.7-fold longer half-life in rat bloodstream compared to HSA [Citation23]. To evaluate the initial preclinical safety of Hb–HSA3, we observed blood compatibility in vitro and physiological responses after 20% exchange transfusion into anesthetized rats. The circulation parameters and blood gas parameters have been monitored for 6 h. Serum biochemical tests of the withdrawn blood have been conducted. Moreover, the plasma half-life of Hb–HSA3 after infusion into beagle dogs was ascertained using the fluorescence–labeled cluster.
Figure 1. Hb–HSA3 cluster. Illustration of molecular structure of Hb–HSA3 in which an Hb is wrapped covalently with HSAs, and homogeneous solution of Hb–HSA3 (20 g/dL) in PBS (pH 7.4).
Materials and methods
Materials and apparatus
After HSA was purchased from the Japan Blood Products Organization (Tokyo, Japan), it was purified using gel filtration chromatography (GPC) to remove the stabilizing agents. For exchange transfusion, a phosphate buffered saline (PBS, pH 7.4) solution of HSA was used. The Hb–HSA3 cluster comprising a bovine Hb core and an average of three HSAs at the exterior was synthesized according to our procedures reported earlier [Citation21]. The Hb unit concentration of the Hb–HSA3 formulation is 5 g/dL in PBS (pH 7.4). At 37 °C, the P50 and Hill coefficient of Hb–HSA3 are 9 Torr and 1.4, respectively. A fluorescence labeling agent, Cyanine5.5 (Cy5.5) NHS ester, was purchased from Lumiprobe Corp (Maryland, USA). All other chemical reagents were purchased from commercial sources as special grades and were used without further purification. Deionized water (18.2 MΩcm) was prepared using water purification systems (Elix UV and Milli Q Reference; Millipore Corp.). The UV-visible absorption spectra were recorded using a UV–visible spectrophotometer (8543; Agilent Technologies Inc.) attached with a Peltier temperature controller (89090A; Agilent Technologies Inc.). Fluorescence emission spectra were measured using a spectrofluorometer (FP-6500; Jasco Corp.). The molecular size was determined by dynamic light scattering (DLS) measurement using a particle size analyzer (ELSZ-2000; Otsuka Electronics Co., Ltd.).
Fluorescence probe (Cy5.5) labeled Hb–HSA3 [Hb–HSA3(Cy5.5)] was synthesized as follows. The DMSO solution Cy5.5 NHS ester (12 mM, 80.4 μL) was added dropwise into the 0.1 M NaHCO3 solution (pH 8.4) of Hb–HSA3 ([Hb unit] = 150 μM, 724 μL) ([Cy5.5 NHS ester]/[HSA] = 8 (mol/mol)). Then the mixture was stirred under a dark condition for 24 h at 25 °C. The resultant was subjected to gel filtration chromatography (Sephadex G-25 superfine; GE Healthcare UK Ltd.) to remove the unreacted Cy5.5 NHS ester with PBS as a running buffer. The obtained eluent was concentrated to 156 μL ([Hb unit] = 5 g/dL) using a centrifugal filter unit (Amicon Ultra, MWCO, 30,000; Merck KGaA.). After flowing the CO gas to the solution, the UV–vis absorption spectrum was measured to ascertain the Cy5.5/Hb–HSA3 ratio (mol/mol). From the absorbance of Hb–HSA3(Cy5.5) at 420 nm (based on CO-Hb core) and at 684 nm (based on Cy5.5), the [Hb unit] and [Cy5.5] were assayed using their molar extinction coefficients [CO–Hb: εmax (420 nm) = 7.64 × 10⁵ M−1 cm−1, Cy5.5: εmax (684 nm) = 2.09 × 10⁵ M−1 cm−1]. The Cy5.5/Hb–HSA3 ratio was found to be 3.2.
Blood compatibility in vitro
Human whole blood was withdrawn from the authors and was stored in a blood collection tube (Venoject II, EDTA-2Na; Terumo Corp.). Then, after the Hb–HSA3 solution was added to the blood ([Hb–HSA3] = 0, 10, 20 and 40 vol%, total volume 1.0 mL each) in a plastic microtube, the individual sample was mixed by inverting. The blood cell number of each sample was found using an automated hematology analyzer (pocH-100iV Diff; Sysmex Corp.). The results are represented as percent ratios against the blood cell number of samples without dilution (0 vol% Hb–HSA3). As control groups, the blood suspensions mixed with HSA (15 g/dL) ([HSA] = 10, 20 and 40 vol%) were also measured. Data are shown as mean ± standard error (SEM) (n = 3).
Human whole blood was withdrawn from the authors into a vacuum blood collection tube (Neotube, 3.2% sodium citrate; Nipro Corp.). After the Hb–HSA3 solution was added to the blood ([Hb–HSA3] = 0, 10, 20 and 40 vol%, total volume 1.2 mL each) in a plastic microtube, the individual sample was mixed by inverting. These samples were centrifuged (2800 × g) for 15 min at 4 °C. The supernatant (0.6 mL) was transferred to a separation tube (S-1; BML Inc.) and was immediately frozen at −80 °C. The determination of prothrombin time (PT) was conducted by BML Inc. (Tokyo, Japan). As control groups, blood suspensions diluted with HSA (15 g/dL) or PBS (10, 20 and 40 vol%) were also measured. Data are shown as mean ± SEM (n = 3).
The human subject in this research has responded to an informed consent which has been approved by the Human Research Committee of Chuo University. The protocol details were also approved by this committee.
Compatibility of Hb–HSA3 solution with canine blood was also examined by the similar procedures (see Supporting Information).
Exchange transfusion into rats
Circulation parameters and blood gas parameters
Investigations were conducted with nine male Wistar rats (277 ± 10 g), which were placed on a heating pad under an inhalation anesthesia with sevoflurane (3.0–4.0% concentration). We used only male rats, because some studies have shown that there are differences in enzyme expression between rat genders, which may influence the serum biochemical tests [Citation25,Citation26]. After an incision was made in the digastric muscle, the heparinized catheter (SP-31; Natsume Seisakusho Co. Ltd.) was introduced into the right common carotid artery for blood withdrawal and continuous mean arterial pressure (MAP) monitoring (A-line). Different catheters (SP-31) were inserted ∼2 cm into the left jugular vein for sample injection (V-line).
After stabilization of the animal condition, the 20% exchange transfusion (total blood volume of rat estimated as 56 mL/kg weight) was conducted by 1 mL blood withdrawal via the A-line and 1 mL Hb–HSA3 infusion via the V-line (each 1 mL/min) with three repeating cycles (Hb–HSA3 group, n = 3). Blood samples were taken from the A-line (0.3 mL) and V-line (0.2 mL) at the following five time-points: before exchange transfusion, 0 (immediately after), 1, 3 and 6 h after exchange transfusion. Simultaneously to the points described above, MAP and heart rate (HR) were recorded using an invasive blood pressure measurement system (BPM100-PC; Star Medical Inc.). The blood sample was dropped rapidly on a test cartridge (i-STAT test cartridge CG4+; Abbot Point of Care Inc.) and was assessed by a portable blood gas analyzer (i-STAT; Abbot Point of Care Inc.) to measure O2 partial pressure (PaO2), CO2 partial pressure (PaCO2), pH and HCO3− for the arterial blood, and O2 partial pressure (PvO2) for the venous blood. Furthermore, the hematocrit (Hct) value was measured using a heparinized Hct capillary (VC-H075H; Terumo Corp.).
After 6 h, 4 mL of the arterial blood was withdrawn from the A-line using non-treated syringe before scarification by hemorrhage. The blood samples were transferred into a vacuum blood collection tube (Venoject II; Termo Corp.) and were centrifuged (4,000 × g) for 15 min at 4 °C. The plasma phase was transferred to a separation tube (S-1; BML Inc.) and was frozen (−80 °C) for serum biochemical tests, which are explained later. As a reference group, the HSA solution (15 g/dL) was administered similarly to rats (HSA group, n = 3). Furthermore, other rats without infusion (operation only) were set as a sham group (n = 3).
All animal handling and care were done in accordance with the NIH guidelines. The protocol details were approved by the Animal Care and Use Committee of Tokai University.
Serum biochemical tests
A total of 25 analytes were measured by BML Inc. (Tokyo, Japan): total protein (TP), albumin (Alb), aspartate aminotransferase (AST), alanine aminotransferase (ALT), lactate dehydrogenase (LDH), γ-glutamyltransferase (γ-GTP), total bilirubin (T-Bil), direct bilirubin (D-Bil), creatinine (CRE), urea nitrogen (UN), uric acid (UA), amylase (AMY), creatinine kinase (CK), total cholesterol (T-Cho), free cholesterol (F-Cho), β-lipoprotein (β-LP), high-density lipoprotein-cholesterol (HDL-Cho), neutral fat (triglyceride, TG), total lipid (TL), phospholipids (PL), free fatty acid (FFA), K+ (K), Ca2+ (Ca), inorganic phosphate (IP) and Mg2+ (Mg).
Blood circulation persistence in dogs
Circulation lifetime
First, the chemical stability of Hb–HSA3(Cy5.5) was evaluated in vitro. The Hb–HSA3(Cy5.5) solution (1 μM) in human plasma, which was derived from whole blood of the author, or in PBS was incubated at 37 °C. The fluorescence spectrum was measured for 48 h.
Animal experiments were conducted with five male beagle dogs (∼2 kg, n = 5). The gender difference of dogs might be small compared to rats, but we used male dogs just in case. The test sample [non-labeled Hb–HSA3/Hb–HSA3(Cy5.5) = 9/1 (vol/vol), 1.8 mL], which corresponds to 1% of the total blood volume of the dog (90 mL/kg weight), was injected intravenously via the jugular vein without anesthesia. Then blood samples were taken from the jugular vein (2.0 mL) using non-treated syringe at the following nine time-points: 0 (immediately after), 1, 2, 5, 24, 30, 48, 54 and 72 h after the infusion. Hct value was measured using heparinized Hct capillary.
After Hct measurements, the remaining blood was transferred into a blood collection tube (NP-SP0715; Nipro Corp.) and centrifuged (2,800 × g) for 15 min at 4 °C to remove the blood cell components. The supernatant (0.5 mL) was moved into the plastic microtube and was stored at 4 °C in darkness. Then the fluorescence spectrum of each sample was measured (λex, 684 nm; λem, 707 nm). The relative plasma concentration of Hb–HSA3(Cy5.5) (C) was found using the following equation.
(1)
(1)
In this equation, F represents the fluorescence intensity of the supernatant at each time-point; F0 signifies fluorescence intensity of the supernatant immediately after the infusion. The disappearance rate constant (ke) and blood circulation half-life (τ50) were ascertained using Moment analysis. At 14 days from the first infusion, the Hb–HSA3 solution of the equal amount was injected again intravenously to the same beagle via the jugular vein. Identical analyses were conducted in the second administration. The beagles were killed by exsanguination at 14 days from the second infusion. The vital organs (liver, kidney, spleen, lungs, heart and bone marrow) were isolated from three of five dogs for the histopathologic observations.
All animal handling and care were done in accordance with the Guidelines for Proper Conduct of Animal Experiments (Science Council of Japan). The protocol details were approved by the Animal Care and Use Committee of Kyoritsu Seiyaku Corp.
Histopathologic observations
Paraffin section specimens were prepared from 10% formalin-fixed major organs described above and were stained with hematoxylin–eosin (HE) on a glass surface for histopathologic observations. Belin blue staining was conducted by BML Inc. (Tokyo, Japan).
Anti-HSA antibody in blood plasma
Experiments were conducted with three male beagle dogs (∼2 kg). The Hb–HSA3 solution (18 mL), which corresponds to 10% of the total blood volume of the dog, was injected intravenously via the femoral vein under a sedation with medetomidine hydrochloride. Then blood samples were taken from the jugular vein (2.0 mL) using non-treated syringe at the following eight time-points: before infusion, 0 (immediately after), 1, 7, 14, 21, 28 and 35 days after the infusion. The blood sample was transferred into a blood collection tube and centrifuged (2,800 × g) for 15 min at 4 °C to remove the blood cell components. The supernatant was moved into the separation tube and was frozen at –80 °C. Anti-HSA antibody assay was performed by general ELISA method using an alkaline phosphatase-labeled rabbit anti-dog IgG antibody. Alkaline phosphatase activity was determined colorimetrically by adding p-nitrophenyl phosphate disodium salt (Merk KGaA) as a substrate. The absorbance of resulting product was measured at 405 nm (product) and 490 nm (background). As a control, the HSA solution (15 g/dL) was administrated similarly to beagle dog. Moreover, another beagle without infusion (operation only) was set as a sham. At 35 days from the infusion, the beagles were killed by exsanguination.
Data analysis
Data of serum biochemical tests in 20% exchange transfusion study, as well as PT, Hct, body temperature, MAP, RESP, PaO2, PvO2, PaCO2, pH and HCO3− are represented as mean ± SEM. Blood cell numbers, HR and blood persistence are shown as percent ratios of the basal values with mean ± SEM. Significant differences between groups were inferred using two-tailed unpaired Student t-tests. Probability values of p < .05 were inferred as statistically significant.
Circulation lifetime analyses were conducted after the administration of Hb–HSA3(Cy5.5) using a non-compartment model. The ke and τ50 values were calculated using the moment analysis program. Data are represented as the mean ± SEM
Results
Compatibility with human blood in vitro
Human whole blood was mixed with the Hb–HSA3 solution. The blood cell components (RBC, WBC and PLT) in the homogeneous suspension were quantified. The quantities of RBC, WBC and PLT decreased in direct relation to the Hb–HSA3 volume ratio: ca. 90, 80 and 60% of the baseline value, respectively, in 10, 20 and 40 vol% Hb–HSA3 samples (). These results were exactly the same as those observed in the HSA groups ().
Figure 2. Compatibility with human blood. (A) Blood cell (RBC, WBC, PLT) numbers in human blood/Hb–HSA3 mixture suspension ([Hb–HSA3] = 10, 20 and 40 vol%). Basal values (BVs) were 457 ± 12 × 104 cells/μL in the RBC group, 43 ± 4 × 10² cells/μL in the WBC group and 24 ± 1 × 10⁴ cells/μL in the PLT group. Each datum represents mean ± SEM (n = 3). (B) Blood cell (RBC, WBC, PLT) numbers in human blood/HSA mixture suspension ([HSA] = 10, 20 and 40 vol%). Basal values (BVs) were 458 ± 11 × 104 cells/μL in the RBC group, 43 ± 4 × 10² cells/μL in the WBC group and 24 ± 1 × 10⁴ cells/μL in the PLT group. Each datum represents mean ± SEM (n = 3). (C) PT values of human blood samples after mixing with Hb–HSA3, HSA and PBS solution (10, 20 and 40 vol%). Each datum represents mean ± SEM (n = 3).
![Figure 2. Compatibility with human blood. (A) Blood cell (RBC, WBC, PLT) numbers in human blood/Hb–HSA3 mixture suspension ([Hb–HSA3] = 10, 20 and 40 vol%). Basal values (BVs) were 457 ± 12 × 104 cells/μL in the RBC group, 43 ± 4 × 10² cells/μL in the WBC group and 24 ± 1 × 10⁴ cells/μL in the PLT group. Each datum represents mean ± SEM (n = 3). (B) Blood cell (RBC, WBC, PLT) numbers in human blood/HSA mixture suspension ([HSA] = 10, 20 and 40 vol%). Basal values (BVs) were 458 ± 11 × 104 cells/μL in the RBC group, 43 ± 4 × 10² cells/μL in the WBC group and 24 ± 1 × 10⁴ cells/μL in the PLT group. Each datum represents mean ± SEM (n = 3). (C) PT values of human blood samples after mixing with Hb–HSA3, HSA and PBS solution (10, 20 and 40 vol%). Each datum represents mean ± SEM (n = 3).](/cms/asset/0ecd00ed-426e-410b-ab77-9177280f9009/ianb_a_1505740_f0002_c.jpg)
The influence of Hb–HSA3 on the blood coagulation was also evaluated by determination of PT, which is an assay estimating the extrinsic and common pathways of coagulation cascade [Citation27,Citation28]. After centrifugation of the blood/Hb–HSA3 mixture sample, the plasma phase was colored in pale red by the presence of Hb–HSA3. The dilution of blood generally caused a decrease in the amount of thrombin. Thereby, the blood coagulation time was prolonged. The PT values increased slightly depending on the cluster volume ratio (10, 20 and 40 vol%) (). The results were identical to those observed in the PBS group and HSA group. We previously reported the good compatibility of Hb–HSA3 with rat blood [Citation23]. The compatibility with canine blood is also described later (vide infra).
Physiological responses after exchange transfusion into rats
Circulation parameters and blood gas parameters
All animals after 20% exchange transfusion with the Hb–HSA3 solution were alive during the experimental period. No remarkable change was found in their appearance. The Hct value decreased rapidly by the blood replacement (from 36.9 to 28.7%) (). The values were constant for 6 h. A similar change was observed in the HSA group. The Hct of the sham group remained constant by the end of measurements.
Figure 3. Changes of circulation parameters. Time courses of circulation parameters of anesthetized rats after 20% exchange transfusion with Hb–HSA3 and HSA solution: (A) Hct, (B) MAP, (C) HR (basal values (BVs) are 218 ± 2 beats/min in Hb–HSA3 group, 315 ± 44 beats/min in HSA group and 332 ± 45 beats/min in sham group) and (D) RESP. Each datum represents mean ± SEM (n = 3). *p < .05 vs. sham group, **p < .01 vs. sham group.
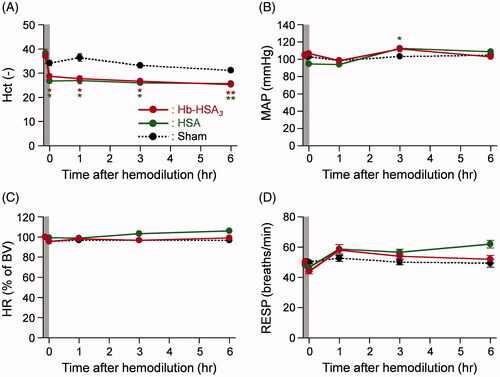
The body temperatures of the sham, HSA and Hb–HSA3 group animals were maintained as stable, 36.7–37.1 °C, for 6 h (Figure S1(A)). The time courses of MAP in the Hb–HSA3 group showed only a small deviation: 98–112 mmHg (). It is noteworthy that no hypertensive action was observed after hemodilution with Hb–HSA3. In the sham group and HSA group, the changes in MAP were almost identical as those of the Hb–HSA3 group. The HR and respiration rates (RESP) of animals in each group remained unchanged during the monitoring period ().
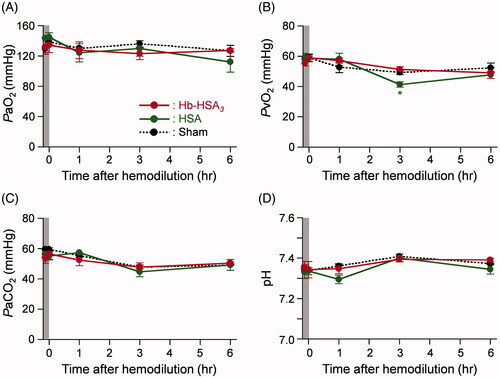
The PaO2 values of the sham, HSA and Hb–HSA3 groups were constant in the range of 112–145 mmHg by the end of measurements (). The PvO2 of each group also demonstrated small changes within 41–59 mmHg (). Moreover, no significant difference in the PaCO2, pH and HCO3− was found in the sham, HSA or Hb–HSA3 groups during the observation term (S1(B)).
Figure 4. Changes of blood gas parameters. Time courses of blood gas parameters of anesthetized rats after 20% exchange transfusion with Hb–HSA3 and HSA solution: (A) PaO2, (B) PvO2, (C) PaCO2 and (d) pH. Each datum represents mean ± SEM (n = 3). *p < .05 vs. sham group.
Serum biochemical tests
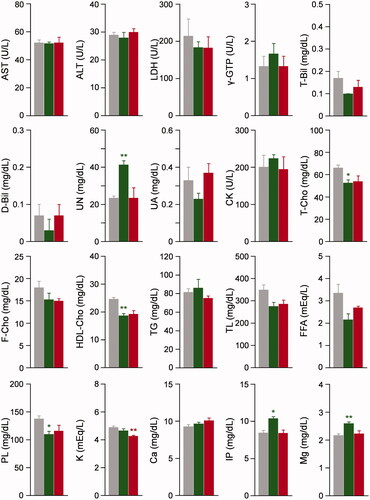
To evaluate liver function, kidney function and electrolyte balance after the 20% exchange transfusion with Hb–HSA3, we conducted the serum biochemical tests for rat plasma (). In the Hb–HSA3 group, the 15–20% decreases in LDH, T-Bil, T-Cho, F-Cho, HDL-Cho, TL, FFA and PL were observed in comparison to the corresponding values in the sham group. The HSA group also demonstrated the same reductions in these analytes. By contrast, no remarkable difference was found between the Hb–HSA3 group and sham group in AST, ALT, γ-GTP, D-Bil, UN, UA, CK, TG, K, Ca, IP and Mg. The Alb in the Hb–HSA3 group was significantly higher than that of the sham group. On the one hand, overestimations were found in TP, CRE, AMY and β-LP, as they are analyzed by colorimetry procedures including Biuret reaction, enzymatic assay or turbidimetry in the range of Hb absorption. Therefore, the data of these analytes are not shown.
Figure 5. Serum biochemical tests. Serum biochemical tests of anesthetized rats after 6 h from 20% exchange transfusion with Hb–HSA3 and HSA solution. Each datum represents mean ± SEM (n = 3): gray bar, sham group without infusion; green bar, HSA group; red bar, Hb–HSA3 group. *p < .05 vs. sham group, **p < .01 vs. sham group.
Blood circulation persistence in dogs
Compatibility with canine blood in vitro
Initially, we confirmed compatibility of Hb–HSA3 solution with canine blood. The blood cell components after mixing with the Hb–HSA3 solution were counted. The quantities of RBC, WBC and PLT decreased in relation to the Hb–HSA3 volume ratio: ca. 90, 80 and 60% of the baseline value, respectively, in 10, 20 and 40 vol% Hb–HSA3 samples (Figure S2(A)). These results were exactly the same as those observed in the HSA groups (Figure S2(B)). The influence of Hb–HSA3 on the blood coagulation was also evaluated by determination of PT. The PT values increased slightly depending on the cluster volume ratio (10, 20 and 40 vol%) (Figure S2(C)), because of blood dilution, which decrease the amount of thrombin. The results were identical to those observed in the HSA group.
Circulation lifetime
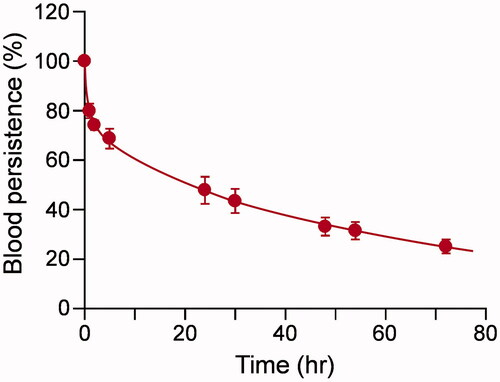
To ascertain the blood circulation lifetime of Hb–HSA3 in dogs, a fluorescent cluster was synthesized using Cy5.5 NHS ester. The number of Cy5.5 molecule covalently bound on one Hb–HSA3 was found to be 3.2. The fluorescence intensity of Hb–HSA3(Cy5.5) in human plasma was sufficiently stable over 48 h at 37 °C in vitro, whereas gradual breeching was observed in PBS solution (Figure S3). The Cy5.5 labeling did not alter the charge and size of the cluster (isoelectric point (pI) = 5.1, diameter = 15 nm) [Citation21,Citation24]. We inferred that Hb–HSA3(Cy5.5) were useful as a fluorescence probe to investigate the pharmacokinetics, distribution and metabolism of Hb–HSA3. The test sample [Hb–HSA3/Hb–HSA3(Cy5.5) = 9/1 (vol/vol)] was injected intravenously to dogs via a jugular vein. Generally, for pharmacokinetic experiments of artificial O2 carrier, a dose more than 10% of the total blood volume could be desirable. However, pure dynamics of Hb–HSA3 cannot be assessed under such conditions, because metabolism and excretion system of Hb–HSA3 may be saturated. Therefore, we injected 1% of the total blood volume, which does not cause saturation of metabolism and excretion system. The time course of the relative plasma concentration of Hb–HSA3(Cy5.5) showed slow kinetics in a biphasic manner (). The ke and τ50 values of Hb–HSA3 were determined as 1.49 × 10⁻² h−1 and 46.9 ± 1.9 h. The negative surface net charge and large molecular size of Hb–HSA3 prevent not only extravasation through the vascular endothelium, but also filtration by the renal glomerulus.
Figure 6. Circulation lifetime. Relative plasma concentration of Hb–HSA3(Cy5.5) in dogs after intravenous administration. Each datum represents mean ± SEM (n = 5).
Based on the fluorescence measurements, Hb–HSA3 disappeared in blood stream within 14 days from the second infusion. Microscopic observations of the HE stained specimens of the vital organs demonstrated no histopathologic disorder in their tissues (Figure S4(A − D)). If the excess heme of Hb–HSA3 were not decomposed by heme oxygenase, then some abnormality might be detected in the liver. Excess iron ions released from Hb are captured by ferritin and hemosiderin. To examine the presence of hemosiderin, Belin blue staining was also performed. We could not observe any blue stained hemosiderin deposition and significant abnormality in the vital organs (Figure S4(E,F)). Since these experiments were performed to measure the blood circulation lifetime of Hb–HSA3, the control group was not set. No-abnormality in histopathology means no difference compared to pathological findings of organs in normal dogs.
Anti-HSA antibody in blood plasma
To observe the immunological response, the Hb–HSA3 solution was injected into beagle dog at a dose rate 10% of the total blood volume. The amount of antibody against HSA in canine plasma increased on day 14 after the infusion, and retained constant during the monitoring period (Figure S5). Administration of HSA caused generation of anti-HSA antibody more significantly; it was 2.3–2.9-fold higher than that of Hb–HSA3.
Discussion
After mixing of human whole blood and the Hb–HSA3 solution, the numbers of RBC, WBC and PLT declined in proportion to the Hb–HSA3 volume ratio (10–40 vol%). Thromboplastin and Ca2+ initiate the inversion of prothrombin to thrombin, leading to blood coagulation [Citation27,Citation28]. The decrease of prothrombin by dilution causes an extension of the blood coagulation time. The PT increased slightly by dilution with Hb–HSA3. All the changes were almost identical to those observed in the PBS group and HSA group. We inferred that Hb–HSA3 has good compatibility with human blood cells and that it does not obstruct normal coagulation function.
After the 20% exchange transfusion with HSA or Hb–HSA3 into rats, the Hct declined 78% of their basal values. The results clearly supported the achievement of 20% replacing of the total blood volume. The time courses of all circulation parameters and blood gas parameters moved within a narrow range for 6 h. They were almost identical to those observed in the sham group and HSA group. It is remarkable that injection of Hb–HSA3 elicited no acute increase in MAP or decrease in HR. The cluster possesses low permeability through the vascular endothelium because of its negatively charged surface and large molecular size. Therefore, vasoconstriction by NO quenching and consecutive hypertension were not detected. We concluded that the administration of Hb–HSA3 into anesthetized rats does not engender adverse reactions under our experimental setup.
Hemodilution by the 20% replacement of the blood volume with HSA or Hb–HSA3 is expected to reduce the concentrations of analytes in serum biochemical tests. Actually, LDH, T-Bil, T-Cho, F-Cho, HDL-Chol, TL, FFA and PL in the Hb–HSA3 group showed ∼80% of the corresponding values in the sham group. They are simply caused by dilution of the blood. Equal reductions were observed in the HSA group. These analyte concentrations would probably recover slowly over 6 h. The typical liver function markers (AST, ALT, γ-GTP), kidney function markers (UN, UA, CK) and electrolytes concentrations in the Hb–HSA3 group exhibited almost identical values relative to those of the sham group. We inferred that 20% exchange transfusion with Hb–HSA3 caused no disorders in the liver, kidney and electrolyte balance. The Alb was assayed using the bromocresol green method [Citation29], which exploits the absorbance around 630 nm where the Hb absorption does not interfere. The high Alb value in the Hb–HSA3 group implied that 74% of Hb–HSA3 remained in the rat intravascular space at 6 h after the exchange transfusion. This result was well consistent with our previously reported data on top loading experiments [Citation23]. Unfortunately, coexistence of Hb–HSA3 in the plasma caused interference in the assays of TP, CRE, AMY and β-LP. We should prepare calibration curves of these analytes for each automated biochemical analyzer.
Generally, isotopic labeling of the molecule and radioactivity measurement of the blood sample are common procedures to assay the blood circulation time of a drug [Citation23,Citation30]. Nevertheless, such techniques are complicated, costly and cannot be accommodated in a normal laboratory environment. In this work, we achieved the determination of the plasma half-life of Hb–HSA3 by cyanine dye labeling and fluorescence measurement. The absorption region of Cy5.5 is higher than that of Hb. For that reason, the fluorescence of Hb–HSA3(Cy5.5) can be measured without disturbance by the core Hb. The ke and τ50 values of Hb–HSA3 in beagle dog were ascertained, respectively, as 1.49 × 10⁻² h−1 and 46.9 ± 1.9 h. This superior blood retention property is explained by suppression of movement to the extravascular space and renal filtration. The Hb–HSA3 molecule is likely to behave as a large plasma protein in circulating blood. Lee et al. reported the τ50 of 125I-labeled (polyethylene glycol)-conjugated Hb (PEG-Hb) in beagle dogs as 47.2 h [Citation30]. The results were quite similar to the value shown by Hb–HSA3. Nevertheless, the weight of dogs (10 kg) that were studied and the amount of administration (10 mL/kg) were much higher than those of our experiments. Considering such differences, we surmised that Hb–HSA3 might have better blood retention features than PEG-Hb.
After 14 days from the first infusion, the sample of the equivalent amount was administered again to the same dog. The time courses of the plasma concentration of the cluster varied greatly; the τ50 value decreased to 38.2 ± 6.8 h. Antibodies against HSA might be generated in the canine blood. An immune reaction could occur after the second infusion [Citation31]. If Hb–HSA3 was recognized as an exogenous compound, then mild cellular infiltration in the macrophage and the mild vacuolation of the Kupffer cell/macrophage in the liver might be observed. However, no abnormality was detected either in the liver or in any other major organs. Berlin blue staining method, which reveals the presence of hemosiderin in the organs, also did not indicate any abnormality in the vital organs.
To clarify the formation of anti-HSA antibody in dog, we conducted 10% top loading experiments. The dog developed anti-HSA antibody on day 14 after the infusion. The antibody level had been maintained for another 3 weeks. Nevertheless, the amount of antibody was less (34–43%) than that observed after administration of the same amount of HSA (15 g/dL).
Overall, our observations imply that the administration of Hb–HSA3 did not engender adverse effects or middle-term toxic reactions, although more research must be done to elucidate the metabolism, elimination and cardiac toxicity.
Conclusion
Dilution of human whole blood with 10–40 vol% Hb–HSA3 showed appropriate decreases in RBC, WBC and PLT numbers. The coagulation function of the blood is maintained in the presence of Hb–HSA3. No physicochemical interaction exists between Hb–HSA3 and the human blood cell components. Actually, 20% blood replacement with the Hb–HSA3 solution yields no acute toxicity or negative side effect in the rats. The physiological responses of the blood circulation and gas equilibria in the Hb–HSA3 group were almost identical to those of the sham group and HSA group. Moreover, MAP and HR remained constant for 6 h, implying that Hb–HSA3 does not engender vasoconstrictive effects during the experiment. The serum biochemical tests of the withdrawn blood also demonstrated the safety of Hb–HSA3. The fluorescent Hb–HSA3(Cy5.5) enabled us to measure the blood circulation time in dogs using a fluorescence spectrometer. The τ50 of Hb–HSA3 was almost identical to that of PEG-Hb. The non-vasopressor response and superior blood retention property of Hb–HSA3 are attributable to the negative surface net charge and larger molecular size of the cluster. Histopathologic inspections proved that Hb–HSA3 produces no disorder in any major organs. All results obtained from this study manifest the initial preclinical safety of the Hb–HSA3 solution, which enables us to conduct further advanced preclinical testing of this protein cluster as a new class of RBC substitutes.
Supplemental Material
Download PDF (1.2 MB)Acknowledgements
The authors acknowledge Dr. Sachi Sakai and Ms. Hiroko Hagiwara (Kyoritsu Seiyaku Corp.) for skillful experimentation related to blood circulation measurements in dogs and histologic observation of vital organs (HE stained specimens).
Disclosure statement
No potential conflict of interest was reported by the authors.
Additional information
Funding
References
- Ellingson KD, Sapiano MRP, Haass KA, et al. Continued declining in blood collection and transfusion in the United States – 2015. Transfusion. 2017;57:1588–1598.
- Blood Services. 2017, Japanese Red Cross Society. 2017 August. Available from: http://www.jrc.or.jp/english/pdf/Blood_Services_2017_web.pdf
- Chatterjee R, Welty EV, Walder RY, et al. Isolation and characterization of a new hemoglobin derivative cross-linked between the α chains (lysine 99α1→lysine 99α2). J Biol Chem. 1986;261:9929–9937.
- Squires JE. Artificial blood. Science. 2002;295:1002–1005.
- Vandegriff KD, Malavalli A, Wooldridge J, et al. MP4, a new nonvasoactive PEG-Hb conjugate. Transfusion. 2003;43:509–516.
- Kim HW, Greenburg AG. Artificial oxygen carriers as red blood cell substitutes: a selected review and current status. Artif Organs. 2004;28:813–827.
- Buehler PW, Boykins RA, Jia Y, et al. Structural and functional characterization of glutaraldehyde-polymerized bovine hemoglobin and its isolated fractions. Anal Chem. 2005;77:3466–3478.
- Kluger R, Lui FE. HBOCs from chemical modification of Hb. In: Kim HW, Greenburg AG, editors. Hemoglobin-based oxygen carriers as red cell substitutes and oxygen therapeutics. Berlin-Heidelberg: Springer-Verlag, 2013. p 159–183.
- Bian Y, Chang TMS. A novel nanobiotherapeutic poly-[hemoglobin-superoxide dismutase-catalase-carbonic anhydrase] with no cardiac toxicity for the resuscitation of a rat model with 90 minutes of sustained severe hemorrhagic shock with loss of 2/3 blood volume. Art Cells Nanomed Biotechnol. 2015;43:1–9.
- Meng F, Tsai AG, Intaglietta M, et al. PEGylation of αα-Hb using succinimidyl propionic acid PEG 5K: conjugation chemistry and PEG shell structure dictate respectively the oxygen affinity and resuscitation fluid like properties of PEG αα-Hbs. Art Cells Nanomed Biotechnol. 2015;43:270–281.
- Chen G, Duan Y, Liu J, et al. Antioxidant effects of vitamin C on hemoglobin-based oxygen carriers derived from human cord blood. Art Cells Nanomed Biotechnol. 2016;44:56–61.
- Liu H, Yan C, Yan K, et al. Study of the effects of polymerized porcine hemoglobin (pPolyHb) in an acute anemia rat model. Art Cells Nanomed Biotechnol. 2017;45:694–700.
- Winslow RM. Cell-free oxygen carriers: scientific foundations, clinical development, and new directions. Biochim Biophys Acta. 2008;1784:1382–1386.
- Natanson C, Kern SJ, Lurie P, et al. Cell-free hemoglobin-based blood substitutes and risk of myocardial infarction and death. J Am Med Assoc. 2008;299:2304–2312.
- Chen JY, Scerbo M, Kramer G. A review of blood substitutes: examining the history, clinical trial results, and ethics of hemoglobin-based oxygen carriers. Clinics. 2009;64:803–813.
- Doherty DH, Doyle MP, Curry SR, et al. Rate of reaction with nitric oxide determines the hypertensive effect of cell-free hemoglobin. Nat Biotechnol. 1998;16:672–676.
- Rohlfs RJ, Bruner E, Chiu A, et al. Arterial blood pressure responses to cell-free hemoglobin solutions and the reaction with nitric oxide. J Biol Chem. 1998;273:12128–12134.
- Yu B, Bloch KD, Zapol WM. Hemoglobin-based red blood cell substitutes and nitric oxide. Trends Cardiovasc Med. 2009;19:103–107.
- Kluger R. Red cell substitutes from hemoglobin -Do we start all over again?. Curr Opin Chem Biol. 2010;14:538–543.
- Tomita D, Kimura T, Hosaka H, et al. Covalent core–shell architecture of hemoglobin and human serum albumin as an artificial O2 carrier. Biomacromolecules. 2013;14:1816–1825.
- Hosaka H, Haruki R, Yamada K, et al. Hemoglobin–albumin cluster incorporating a Pt nanoparticle: artificial O2 carrier with antioxidant activities. PLoS One. 2014;9:e110541.
- Kimura T, Shinohara R, Böttcher C, et al. Core–shell clusters of human haemoglobin A and human serum albumin: artificial O2-carriers having various O2-affinities. J Mater Chem B. 2015;3:6157–6164.
- Haruki R, Kimura T, Iwasaki H, et al. Safety evaluation of Hemoglobin-albumin cluster “HemoAct” as a red blood cell substitute. Sci Rep. 2015;5:12778
- Shinohara R, Yamada T, Schade B, et al. Structural insights into a hemoglobin-albumin cluster in aqueous medium. J Phys Chem Lett. 2017;8:819–824.
- Liu H, Choi JW, Yun JW. Gender differences in rat plasma proteome in response to high-fat diet. Proteomics. 2012;12:269–283.
- He Q, Su G, Liu K, et al. Sex-specific reference intervals of hematologic and biochemical analytes in Sprague-Dawley rats using the nonparametric rank percentile method. PLoS One. 2017;12:e0189837
- Kirkwood TBL. Calibration of reference thromboplastins and standardization of the prothrombin time ratio. Thromb Haemost. 1983;49:283–344.
- Rao LV, Okorodudu AO, Petersen JR, et al. Stability of prothrombin time and activated partial thromboplastin time tests under different storage conditions. Clin Chim Acta. 2000;300:13–21.
- McGinlay JM, Payne RB. Serum albumin by dye-binding: bromocresol green or bromocresol purple? The case for conservatism. Ann Clin Biochem. 1988;25:417–421.
- Lee J, Lee J, Yoon S, et al. Pharmacokinetics of 125I-radiolabelled PEG-hemoglobin SB1. Artif Cells Blood Substit Immobil Biotechnol. 2006;34:277–292.
- Cohn LA, Kerl ME, Lenox CE, et al. Response of healthy dogs to infusions of human serum albumin. Am J Vet Res. 2007;68:657–663.