
 ?Mathematical formulae have been encoded as MathML and are displayed in this HTML version using MathJax in order to improve their display. Uncheck the box to turn MathJax off. This feature requires Javascript. Click on a formula to zoom.
Abstract
The objective of this study was to hydrophobically modify fenugreek gum (FG) and to further evaluate the potential application of the obtained derivative in liver-targeted drug delivery system. Stearic acid (C18) was conjugated with FG (FG-C18) by a simple esterification reaction. The obtained FG-C18 was then characterized on its chemical structure by Fourier transform infrared spectroscopy and 1H-nuclear magnetic resonance. The self-assembled nanomicelles (NMs) of FG-C18 in water were prepared by an ultrasonication method. The average diameter and zeta potential of FG-C18 NMs were 196.70 ± 6.12 nm and −31.79 ± 1.58 mV, respectively. FG-C18 NMs appeared as spherical particles under transmission electron microscopy and possessed a critical micellar concentration of 0.042 mg/ml by pyrene fluorescence probe method. A low toxicity of FG-C18 was revealed on both HepG2 and MCF-7 cells at 0.1–100 mg/ml. Haemolysis of FG-C18 was less than 5%. Cellular uptake of coumarin-6 into HepG2 cells was enhanced by treating with C6-loaded FG-C18 NMs compared to free coumarin-6. These results suggest that FG-C18 have a potential application for a liver targeted drug delivery.
Introduction
Natural polysaccharides have attracted attention in the pharmaceutical field due to their reliable properties mainly including wide sources, renewability, nontoxicity, biodegradability, biocompatibility and low-cost. These polymeric carbohydrates were composed of long chains of monosaccharide units joined together by glycosidic bonds. Generally, they are usually abundant in functional groups such as hydroxyl, amino and carboxylic acid groups, which can be partially substituted by grafting hydrophobic segments to obtain amphiphilic molecules [Citation1,Citation2]. The resulting amphiphilic polysaccharides can self-assemble to form core/shell-type micelles in aqueous solution at low critical micelle concentration (CMC). Water-insoluble drugs can be incorporated into the hydrophobic microcontainer, and a minimum energy state can be acquired by enclosing hydrophobic microdomains into the hydrophilic shell [Citation3].
Asialoglycoprotein receptors (ASGP-R), highly expressed in the surface of mammalian hepatocytes and human hepatoma cell line like HepG2 cells [Citation4], can be specifically recognized by β-D-galactose (Gal), N-acetylgalactosamine and lactose ligands [Citation5]. Recently, many studies have indicated that polysaccharides or polymers containing lactoferrin moieties, galactose or galactosamine residues showed high affinity toward ASGP-R [Citation6,Citation7]. This receptor-mediated endocytosis provided a promising approach in the active targeting effect with many advantages like high drug concentrations within the cells and minimum concentration at nontarget sites [Citation4].
Fenugreek gum (FG), extracted from the seeds of Fenugreek (Trigonella foenum-graecum L.), was composed of a backbone of (1→4)-linked β-D-mannopyranosyl units with chains of (1→6)-α-D-galactopyranosyl groups [Citation8]. It was reported that FG exhibited emulsification, gelation, and stability properties [Citation9]. However, no reports on fenugreek gum as a nanocarrier for drug delivery was reviewed. A major reason might be assigned to the poor encapsulation and initial burst release of the drug caused by high solubility and swelling property of FG in water [Citation10]. In this study, FG was hydrophobically modified by stearic acid (C18) to form an amphiphilic derivative (FG-C18) and characterized by Fourier transformed infrared spectroscopy (FTIR) and 1H-nuclear magnetic resonance (1H-NMR). The related FG-C18 nanomicelles (FG-C18 NMs) were prepared and characterized on their size, zeta potential, morphology, preliminary stability and CMC. Blood biocompatibility of FG was tested by a haemolysis assay. In vitro cytotoxicity and cellular uptake ability were evaluated on HepG2 and MCF-7 cells.
Materials and methods
Materials
FG was purchased from Henan Zhengyuan Food Co., Ltd (Kaifeng, China). Stearic acid was supplied by Sinopharm Chemical Reagent Co., Ltd (Shanghai, China). N,N'-Dicyclohexylvcarbodiimide (DCC) was acquired from Bioduly (Nanjing, China). Dimethylaminopyridine (DMAP) was obtained from Kelong Chemical Regent Co., Ltd. (Chengdu, China). Dialysis tubing (molecular weight cut-off 3.4 kDa) was supplied by Greenbird Biological Technology Co., Ltd. (Shanghai, China). Dulbecco’s modified Eagle’s medium (DMEM) and fetal calf serum (FCS) were obtained from Thermo Fisher Scientific, Inc. (Waltham, MA, USA). The methyl thiazolyl tetrazolium (MTT) kit was purchased from Jiangsu KeyGEN Bio TECH Co., Ltd (Nanjing, China). Pyrene was supplied by Sigma-Aldrich Co., Ltd. (Louis, MO, USA) and recrystallized before use. Tween 80 was purchased from Amresco Inc. (Solon, Ohio, USA). Cremophor EL was supplied by BASF Co., Ltd. (Ludwigshafen, Germany). Ultrapurified water (Milli-Q, Millipore, USA) was used throughout the experiment. All other reagents were of analytical grade and used as received.
Synthesis of FG-C18
FG was enzymatically hydrolyzed with 10 U/mg cellulase by incubation at 50 °C for 150 min, followed by purification with ethanol to obtain degraded FG [Citation11]. FG-C18 derivative was synthesized according to a previously reported method [Citation12]. Briefly, 0.100 g degraded FG was dissolved in 20 ml DMSO. Then, 5 ml FG solution and 0.155 g DCC, 0.147 g DMAP, 0.147 g stearic acid were mixed and activated for 2 h in an ice bath. The mixture was kept stirring for 8 h at 80 °C followed by stirring for 24 h at room temperature. The resulting mixture was purified by dialysis (molecular weight cut-off 3.4 kD) against water for 3 days and the dialysate was displaced by fresh water every 6 h. The final product was obtained by freeze-drying for 48 h.
Characterization of FG-C18
Fourier transform infrared spectra
FTIR of FG, stearic acid and FG-C18 were recorded by FTIR spectrometer (TENSOR37, Bruker, Ettlingen, Germany) using KBr pellets method over a wavelength range of 4000–400 cm−1 at a scan speed of 1 cm−1/s.
1H-NMR spectra
1H-NMR spectra were analyzed on an AV400 NMR instrument (Bruker, Ettlingen, Germany). The sample (5 mg) was dissolved in DMSO-d6 (0.5 ml) by heating at 37 °C for 10 min. The measurements were carried out at 25 °C, a coupling constant of 150 Hz, a delay time of 1 s and an acquisition time of 80 s.
Preparation of FG-C18 nanomicelles
Self-assembled FG-C18 NMs loaded with or without coumarin-6 (C6) was prepared using an ultrasonication method. Briefly, 25 mg FG-C18 was completely dispersed in 10 ml water by magnetic stirring for 4 h at room temperature. C6 was dissolved in 500 µl ethanol and slowly added dropwise into the FG-C18 solution. The solution was sonicated by a probe-type ultrasonic oscillation (20–25 kHz, Ningbo Scientz Biotechnology Co. Ltd., Ningbo, China) at 200 W for 10 min in an ice-water bath. Nanomicelles were then obtained by centrifuging at 3500 rpm for 10 min and filtering the supernatant through a 0.45 µm membrane filter.
Characterization of FG-C18 NMs
The average particle size, polydispersity index (PDI) and zeta potential of FG-C18 NMs were determined using a Zeta Sizer (Nano-ZS90, Malvern Instruments, UK). A transmission electron microscope (TEM, H-600-4, HITACHI, Tokyo, Japan) was utilized to observe the morphology of FG-C18 NMs after staining by 2% phosphotungstic acid solution. Primary stability of particles at 4 °C or 37 °C was evaluated by monitoring the change of size and PDI at different time intervals.
Fluorescence spectroscopy measurement
CMC of FG-C18 was determined by a fluorescence spectrophotometer (970CRT, Shanghai, China) using pyrene as the fluorescent probe. Aqueous solution of FG-C18 at different concentrations was added to the pyrene solution and shaken overnight at 25 °C (the final concentration of pyrene was fixed at 6 × 10⁻⁷ mol/l). An emission wavelength was recorded in the range of 320–500 nm and the excitation wavelength was set at 332 nm. The width slit of emission and excitation were 2.5 and 5 nm, respectively.
Haemolysis assay
Fresh blood was collected from a New Zealand white rabbit. Erythrocyte was isolated by repeatedly washing 4 ml whole blood with 10 ml physiological saline and centrifuging at 2500 rpm for 10 min until colourless supernatant was obtained. One millilitre erythrocyte suspension was diluted by saline to 50 ml to prepare a 2.0% (v/v) suspension [Citation13]. FG-C18 NMs suspension of 2.5 ml was mixed with 2.5 ml erythrocyte and diluted to different concentrations of 0.2, 0.4, 0.6, 0.8, 1.0, 2.0 and 4 mg/ml by saline. Erythrocyte suspensions diluted by water and physiological saline were used as the positive and negative control samples, respectively. All samples were incubated for 1, 4, 10 and 24 h at 37 °C and observed for any agglutination of erythrocytes.
The erythrocytes were incubated at 37 °C with 5 mg/ml FG-C18 NMs, Tween 80 or Cremorphor EL, respectively. After incubation for 6 h, the supernatant was separated by centrifugation at 2000 rpm for 5 min. The haemolysis of all samples was quantified by measuring the absorbance of the haemoglobin at 545 nm. The percentage of haemolysis was calculated using EquationEquation (1)(1)
(1) [Citation14].
(1)
(1)
Where Asample was the absorbance of the experimental sample, A0% was the absorbance of supernatant treated with physiological saline and haemolysis yielded to 0%. A100% was the absorbance of supernatant treated with water at complete haemolysis yielding the 100%.
Cytotoxicity assay
HepG2 or MCF-7 cells were cultivated in culture flasks using DMEM supplemented with 10% FCS at 37 °C, 90% humidified atmosphere and 5% CO2. The medium was replaced every 2 days until the cells overspread the culture flasks. The cells were washed with phosphate-buffered saline (PBS) and harvested by trypsin. The trypsinized cells were resuspended in the culture medium for the following tests.
The cytotoxicity and cellular uptake of FG-C18 NMs were preliminarily evaluated using HepG2 cells as ASGP-R over-expressing cell line and MCF-7 cells as a negative control (low expression of ASGP-R) [Citation15]. In brief, HepG2 or MCF-7 cells were seeded in a 96-well plate at a density of 3 × 10³ cells/well in DMEM with 10% FCS and incubated at 37 °C for 24 h. Subsequently, the cells were treated with 100 µL FG-C18 suspension ranging from 0.1 to 100 μg/ml. The untreated cells were used as the control. After 24 h (48 h or 72 h), 20 µL MTT (5.0 mg/ml in PBS) was added to each well and incubated for 4 h. After removal of the DMEM, the cells were lysed by the addition of 150 µL DMSO followed by shaking for 10 min. The cell viability was tested by MTT assay at 490 nm using a model 550 microplate reader (Bio-Rad, Segrate, Italy). The percentage of cell viability was calculated using EquationEquation (2)(2)
(2) .
(2)
(2)
Where Atreat and Acontrol were the absorbance of the treated and the control cells, respectively. Experiments were carried out in 6 wells and tested three times.
Cellular uptake
The intracellular uptake performance of HepG2 and MCF-7 cells for C6 were evaluated and compared. A competitive inhibition experiment was presented by evaluating the effect of galactose on the intracellular uptake of HepG2 cells and the ability of FG-C18 NMs in targeting HepG2 cells comparable to MCF-7 cells were evaluated by fluorescence microscopy. C6 was loaded into the FG-C18 NMs as a typical hydrophobic fluorescence probe. Briefly, HepG2 or MCF-7 cells were seeded into a 96-well plate at a density of 2 × 10⁵ cells/well and incubated for 24 h. HepG2 cells were pretreated with galactose and medium for 24 h, respectively. The seeding medium was removed and replaced by serum-free medium containing free C6 or C6-loaded FG-C18 nanomicelles and cultured for another 1 h. The cells were then washed 3 times with cold PBS and fixed by addition of 70% ethanol. Finally, the fluorescent signals were analyzed under a fluorescence microscope (BX51TF, Olympus, Tokyo, Japan).
Data statistics
All results were expressed as the mean and standard deviation. The statistical analysis was performed by ANOVA analysis using SPSS statistics software (SPSS software version 16.0, IBM, Armonk, NY, USA). The p-values <.05 were considered as statistically significant.
Results and discussion
Synthesis and characterization of FG-C18
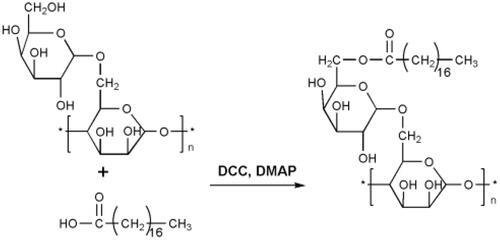
As shown in , FG-C18 was prepared by esterification between carboxylic groups of stearic acid and hydroxyl groups of FG utilizing DCC/DMAP as the activators [Citation12]. No toxic metal catalyst was required during this chemical reaction [Citation16]. A white powder of FG-C18 polymers was obtained after lyophilization. Then, the structure of FG-C18 was characterized by FTIR and 1H-NMR analysis, respectively.
Figure 1. Synthesis scheme of FG-C18.
Fourier transform infrared spectra
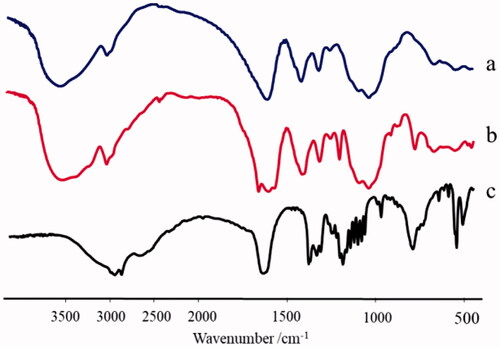
As shown in , FG and FG-C18 displayed typical strong peaks at 3509 cm−1 for OH stretching, 2898 cm−1 due to C–H stretching, and 1658 cm−1 corresponded to OH stretching [Citation17]. The peaks at 1426 cm−1 suggested C–H bending vibrations [Citation18]. The new absorption at 1759 cm−1 (acetyl group) and 1186 cm−1 in were ascribed to C=O and C–O stretching, implying the appearance of ester groups in FG-C18. Stearic acid () portrayed characteristic peaks of CH3 at 2998 cm−1, CH2 at 2947 cm−1, CH bending vibrations at 1457 cm−1, characteristic peaks between 1390 cm−1 and 1350 cm−1 for methyl and a weak C–H stretching of methylene at 2883 cm−1 [Citation19]. Therefore, FTIR spectra clearly indicated the formation of FG-C18.
Figure 2. FTIR of FG (a), FG-C18 (b) and Stearic acid (c).
1H-NMR spectrum
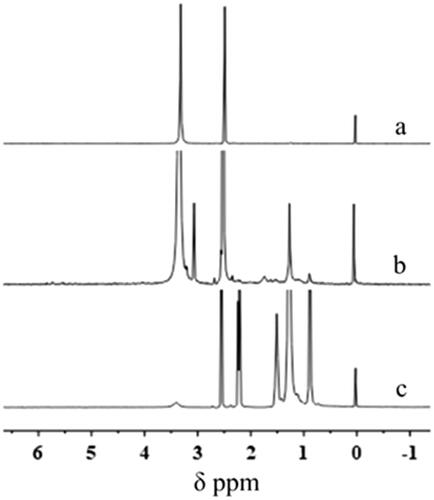
1H-NMR spectra of FG, FG-C18 and stearic acid were shown in . The single peak at 0.85 ppm and 1.3 ppm were attributed to methyl and methylene groups of stearic acid, respectively [Citation20]. The peaks at 1.23 ppm and 3.34 ppm belonged to unmodified FG. The peak intensity between 0.85 ppm and 1.3 ppm was also increased in FG-C18. The 1H-NMR of FG-C18 showed typical signals of both FG and stearic acid. These results demonstrated that stearic acid was successfully introduced into FG backbone.
Figure 3. 1H- NMR spectrum of FG (a), FG-C18 (b) and stearic acid (c).
Preparation and characterization of self-assembled FG-C18 NMs
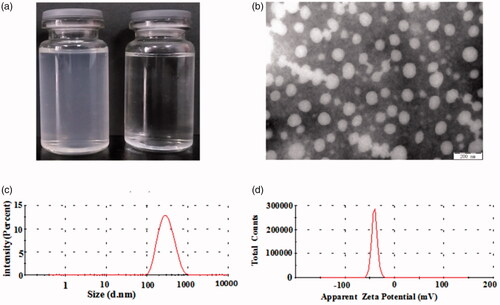
FG-C18 conjugates were dispersed in water followed by ultrasonication in an ice-water bath to form a translucent solution with slight bluish shine. But FG solution in water was transparent (), which indicated that the FG-C18 can self-assemble to be nanosize range particles in water. Results from dynamic light scattering (DLS) showed a mean particle size of FG-C18 NMs at 196.70 ± 6.12 nm () and a narrow size distribution with low PDI of 0.165 ± 0.024. These micelles were negatively charged with a zeta potential of −31.79 ± 1.58 mV (), which may further enhance the physical stability of particles due to electrostatic repulsion [Citation21]. The morphology of FG-C18 NMs was then examined by TEM. As shown in , these micelles were spherical particles with their sizes around 100 nm, which was smaller than that from DLS. Since DLS was carried out in aqueous solution [Citation22,Citation23], the major reason could be attributed to the dehydration and shrinkage of shell of micelles during air-drying under TEM.
Figure 4. Appearance of FG-C18 NMs suspension (left) and FG solution (right) (a); TEM images (bar = 200 nm) (b); Size distribution (c) and Zeta potential (d) of FG-C18 NMs.
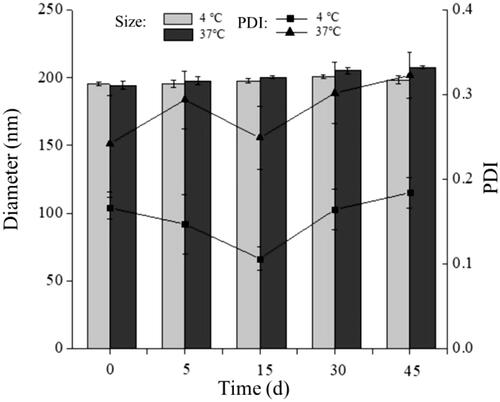
The storage stability of FG-C18 NMs was monitored on particle size and PDI value. As shown in , the average size of FG-C18 NMs was nearly unchanged in 45 days at 4 °C or 37 °C, and the PDI values slightly fluctuated but maintained below 0.3. These results indicated that FG-C18 NMs had good storage stability in aqueous media under 4 °C or 37 °C.
Figure 5. Storage stability of FG-C18 NMs under 4 °C and 37 °C at various time intervals.
Fluorescence spectroscopy measurement
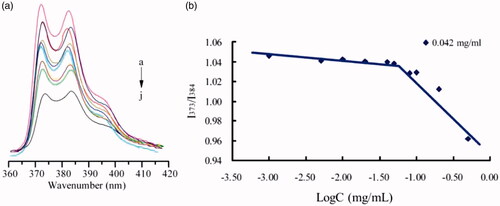
The CMC of FG-C18 was evaluated by pyrene fluorescence probe method according to the characteristic adsorption spectrum of pyrene in UV region. As shown in , the change in fluorescence intensity was indistinctive at low concentration of FG because of poor solubility and self-quenching property of pyrene. Once FG-C18 self-assembled into micelles at a certain concentration, the pyrene was solubilized into the interior phase of micelles, which resulted in a sudden increase of fluorescence intensity [Citation24]. The ratio of fluorescence intensity for emission spectrums (I373 to I384) was high in an aqueous medium, which was in accordance with the literature [Citation25]. Thus, the CMC of FG-C18 can be estimated by plotting the intensity ratio (I373/I384) of pyrene versus the logarithm of FG-C18 concentration (). A sharp cross-point was considered as CMC value by extrapolating the intensity ratio at low and high concentration regions to obtain two straight lines [Citation26], and the CMC was found to be 0.042 mg/ml. The low CMC can ensure enhanced stability of FG-C18 NMs in aqueous solution in vitro and in vivo after intravenous administration [Citation27].
Figure 6. Fluorescence spectra for pyrene (6 × 10⁻⁷ mol/l) in FG-C18 at different concentrations (a), arrows point to minimum concentration. Pyrene intensity ratio versus the logarithm of FG-C18 concentrations (b).
Haemolysis assay
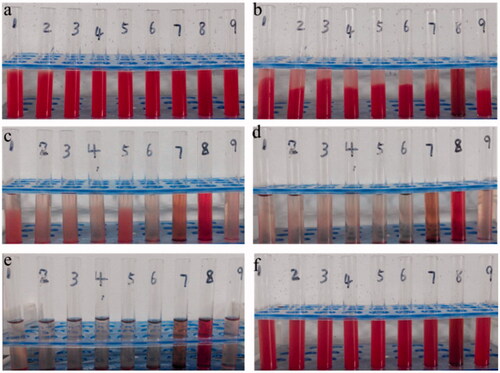
The blood biocompatibility of FG-C18 was evaluated by erythrocyte-induced haemolysis test. presented the appearance of tested samples at different time intervals. It was obvious that erythrocytes were slowly settled down to the bottom of the vials and a transparent supernatant was gradually formed with the extension of time for these vials containing FG-C18 or normal saline. In addition, the red blood cells could be easily re-dispersed by gently shaking and no apparent erythrocyte agglutination was observed, which suggested that no visible haemolysis happened to these samples. However, the positive control treated with water showed obvious haemolysis and dark colour due to the release of the haemoglobin.
Figure 7. Haemolysis caused by different FG-C18 concentrations of 0.2, 0.4, 0.6, 0.8, 1.0, 2.0 and 4.0 mg/ml (1–7) at 0, 1, 4, 10, and 24 h (a–e, f) the red blood cells were remixed at 24 h. The vials of 8 and 9 were treated by water and normal saline, respectively.
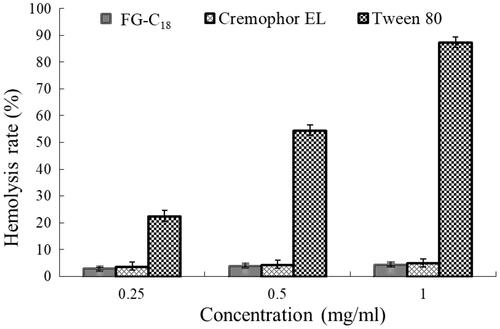
The release of haemoglobin was then quantified by UV-vis spectroscopy at 545 nm. Erythrocytes were incubated with FG-C18, Tween-80 and Cremorphor EL at different concentrations in the range of 0.25–1 mg/ml for 1 h, respectively. As shown in , the haemolysis percentage induced by FG-C18 or Cremorphor EL was less than 5% at all-time points indicating preferable biocompatibility [Citation28]. In contrast, severe haemolysis was caused by Tween-80 as the concentration increased. These results indicated a good haemocompatibility of FG-C18 for intravenous administration.
Figure 8. Haemolytic ratio of FG-C18, Cremophor EL and Tween 80 at concentrations of 0.25, 0.5 and 1 mg/ml.
Cytotoxicity of FG-C18
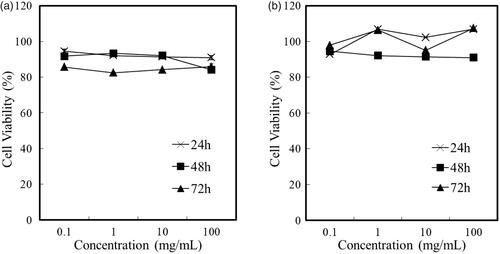
The antiproliferative effect of FG-C18 on MCF-7 cells and HepG2 cell lines was measured by utilizing MTT assay after incubating for 24 h, 48 h and 72 h. Cell viability values were presented in as the percentage of viable cells in treated versus untreated cells. The viability of both MCF-7 and HepG2 cells was decreased with the increase of FG-C18 concentration and time, yet the differences were insignificant. The high cell viability of more than 80% revealed that FG-C18 was non-toxic at a concentration range of 0.1–100 mg/ml. Therefore, FG-C18 could be considered as a safe and biocompatible nanocarrier for drug delivery.
Figure 9. Cell viability assessment in HepG2 (a) and MCF-7 cells (b) treated with different FG-C18 concentration at 24, 48 and 72 h.
Cell uptake
The HepG2 cells and MCF-7 cells were used in the cellular uptake experiment. The fluorescence microscopy images of both cells treated with free C6 or C6-FG-C18 NMs were shown in . HepG2 cells incubated with C6-FG-C18 NMs () showed remarkable fluorescence signals compared to those treated with free C6 (), demonstrated that a large amount of C6 from C6-FG-C18 NMs was endocytosed by HepG2 cells. However, a negligible fluorescence was observed either in MCF-7 cells incubated with C6-FG-C18 NMs () or C6 solution (). These results suggested that C6-FG-C18 NMs could specifically recognize the ASGP-R overexpressed HepG2 cells and enhance cellular uptake, but weak fluorescence signals in MCF-7 cells might be due to a lack of such receptors on the surface of MCF-7 cells.
Figure 10. Fluorescence images (200×) of HepG2 cells treated with C6-FG-C18 NMs (a1) and free C6 (b1); MCF-7 cells treated with C6-FG-C18 NMs (c1) and free C6 (d1); HepG2 cells pretreated with galactose following incubation with C6-FG-C18 NMs (e1). Left and right column were confocal laser scanning microscopy images and bright field images, respectively. The C6 content in micelle solutions was 0.0382 µg/ml.
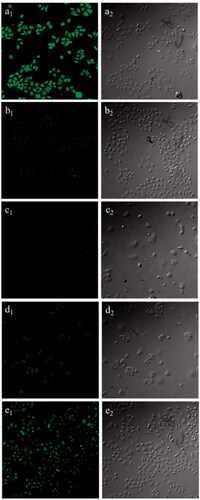
In order to further confirm that FG-C18 NMs can specifically bind to HepG2 cells through a receptor-mediated effect, a competitive inhibition experiment was designed by addition of free galactose. HepG2 cells were pretreated with galactose (0.2 M) for 24 h followed by incubating with FG-C18 NMs for 24 h. It could be observed that fluorescence was obviously reduced with the pretreatment of free galactose (), indicating that FG-C18 NMs had a high affinity to HepG2 cells through ASGP-R receptor-mediated endocytosis and free galactose could competitively inhibit the binding interaction.
Conclusion
In summary, we successfully overcame the limitation of hydrophilicity of fenugreek gum by conjugating stearic acid as a hydrophobic chain through a simple esterification reaction. The obtained FG-C18 could self-assemble into spherical nanomicelles with narrow size distribution. And FG-C18 showed low haemolysis with the haemolytic ratio less than 5%. In vitro cytotoxicity studies showed high cell viability either on HepG2 cells or on MCF-7 cells. Cellular uptake showed that C6-FG-C18 NMs with galactose residues could specifically recognize ASGP-R receptor on HepG2 cell surface compared to C6 solution. Taken together, FG-C18 NMs showed enormous potential applicability as nanocarriers for intravenous administration of poorly soluble drugs due to biocompatibility, low toxicity and liver-targeting potential.
Disclosure statement
No potential conflict of interest was reported by the authors.
Additional information
Funding
References
- Janarthanan P, Owh C, Xian JL, et al. Biodegradable polysaccharides for controlled drug delivery. ChemPlusChem 2016;81:504–514.
- Wang W, He SL, Hong TT, et al. Synthesis, self-assembly, and in vitro toxicity of fatty Bletilla striata polysaccharide. Artific Cells Nanomed Biotechnol. 2017;45:69–75.
- Liu YH, Sun J, Zhang P, et al. Amphiphilic polysaccharide-hydrophobicized graft polymeric micelles for drug delivery nanosystems. CMC. 2011;18:2638–2648.
- D'Souza AA, Devarajan PV. Asialoglycoprotein receptor mediated hepatocyte targeting-strategies and applications. J Controlled Rel. 2015;203:126–139.
- Yik JHN, Saxena A, Weigel PH. The minor subunit splice variants, H2b and H2c, of the human asialoglycoprotein receptor are present with the major subunit H1 in different hetero-oligomeric receptor complexes. J Biol Chem. 2002;277:23076–23083.
- Zou Y, Song Y, Yang WJ, et al. Galactose-installed photo-crosslinked pH-sensitive degradable micelles for active targeting chemotherapy of hepatocellular carcinoma in mice. J Controlled Rel. 2014;193:154–161.
- Prado BM, Kim S, Ozen BF, et al. Differentiation of carbohydrate gums and mixtures using Fourier transform infrared spectroscopy and chemometrics. J Agric Food Chem. 2005;53:2823.
- Chang YH, Cui SW, Roberts KT, et al. Evaluation of extrusion-modified fenugreek gum. Food Hydrocoll. 2011;25:1296–1301.
- Wei YX, Lin YX, Xie R, et al. The flow behavior, thixotropy and dynamical viscoelasticity of fenugreek gum. J Food Eng. 2015;166:21–28.
- Rana V, Rai P, Tiwary AK, et al. Modified gums: approaches and applications in drug delivery. Carbohydrate Polym. 2011;83:1031–1047.
- He SL, Feng J, Hong TT, et al. Study on degradation process of fenugreek gum. J Pharma Res. 2015;06:311-315.
- Ahmed B, Gerd H, Jörg KA, et al. Hydrophobically modified hydroxyethyl starch: synthesis, characterization, and aqueous self-assembly into nano-sized polymeric micelles and vesicles. Biomacromolecules 2007;8:359.
- Lian H, Sun J, Yu YP, et al. Supramolecular micellar nanoaggregates based on a novel chitosan/vitamin E succinate copolymer for paclitaxel selective delivery. Int J Nanomed. 2011;6:3323.
- Sen VD, Sokolova EM, Neshev NI, et al. Low molecular chitosan–(poly) nitroxides: synthesis and evaluation as antioxidants on free radical-induced erythrocyte haemolysis. Reactive & Funct Polym. 2016;111:53–59.
- Zhang Y, Zhang X, Zhang J, et al. Microfluidic chip for isolation of viable circulating tumor cells of hepatocellular carcinoma for their culture and drug sensitivity assay. Cancer Biol Ther. 2016;17:1177–1187.
- Li C, Sun JC, Fu CL, et al. Synthesis and evaluation of odour-active methionyl esters of fatty acids via esterification and transesterification of butter oil. Food Chem. 2014;145:796–801.
- Nayak AK, Pal D, Santra K. Screening of polysaccharides from tamarind, fenugreek and jackfruit seeds as pharmaceutical excipients. Int J Biol Macromol. 2015;79:756–760.
- Bassi P, Kaur G. Fenugreek gum derivatives with improved bioadhesion and controlled drug release: in vitro and in vivo characterization. J Drug Delivery Sci Technol. 2015;29:42–54.
- Namazi H, Fathi F, Tehrani AD. Hydrophobically modified starch using long-chain fatty acids for preparation of nanosized starch particles. Scientia Iranica 2011;18:439–445.
- Chen Q, Sun Y, Wang JJ, et al. Preparation and characterization of glycyrrhetinic acid-modified stearic acid-grafted chitosan micelles. Artific Cells Nanomed Biotechnol. 2015;43:1–7.
- Elsabahy M, Wooley KL. Design of polymeric nanoparticles for biomedical delivery applications. Chem Soc Rev. 2012;41:2545–2561.
- Han SY, Han HS, Lee SC, et al. Mineralizedhyaluronic acid nanoparticles as a robust drug carrier. J Mater Chem. 2011;21:7996–8001.
- Li XR, Yang ZL, Yang KW, et al. Self-assembled polymeric micellar nanoparticles as nanocarriers for poorly soluble anticancer drug ethaselen. Nanoscale Res Lett. 2009;4:1502–1511.
- Mitsionis AI, Vaimakis TC. Estimation of AOT and SDS CMC in a methanol using conductometry, viscometry and pyrene fluorescence spectroscopy methods. Chem Phys Lett. 2012; 547:110–113.
- Banjare MK, Kurrey R, Yadav T, et al. A comparative study on the effect of imidazolium-based ionic liquid on self-aggregation of cationic, anionic and nonionic surfactants studied by surface tension, conductivity, fluorescence and FTIR spectroscopy. J Mol Liq. 2017;241:622–632.
- Yang JL, Gao CM, Lü SY, et al. Physicochemical characterization of amphiphilic nanoparticles based on the novel starch–deoxycholic acid conjugates and self-aggregates. Carbohydrate Polym. 2014;102:838–845.
- Meng X, Liu JS, Yu XR, et al. Pluronic F127 and D-α-tocopheryl polyethylene glycol succinate (TPGS) mixed micelles for targeting drug delivery across the blood brain barrier. Sci Rep. 2017;7:2964.
- Wang Q, Tan LL, Yang K. Cytocompatibility and haemolysis of AZ31B magnesium alloy with Si-containing coating. J Mater Sci Technol. 2015;31:845–851.