
 ?Mathematical formulae have been encoded as MathML and are displayed in this HTML version using MathJax in order to improve their display. Uncheck the box to turn MathJax off. This feature requires Javascript. Click on a formula to zoom.
Abstract
Complicated issue in infectious illnesses therapy is increasing of multidrug resistant (MDR) bacteria and biofilms in bacterial infections. In this way, emerging of nanotechnology as a new weapon specifically in the cases of metal nanoparticle (MNPs) synthesis and MNPs surface modification has obtained more attention. In this study, ultrasound-assisted green synthesis method was utilized for the preparation of Fe3O4 NPs with novel shape (dendrimer) through leaf aqueous extract of Artemisia haussknechtii Boiss. Ultraviolet–visible spectroscopy, energy dispersive X-ray spectroscopy (EDX), Fourier transform infrared spectroscopy (FT-IR), scanning electron microscopy (SEM), atomic force microscopic (AFM), X-ray diffraction (XRD) techniques were applied for MNPs physicochemical characterization. Also, disc diffusion assay, minimum inhibitory concentration (MIC), minimum bactericidal concentration (MBC), planktonic and biofilm morphology of three pathogenic bacteria involving Serratia marcescens ATCC 13880, Escherichia coli ATCC 25922, and methicillin-resistant Staphylococcus aureus (MRSA) were evaluated upon treatment of Fe3O4 NPs as antiplanktonic and antibiofilm analysis. Results showed efficient antiplanktonic and antibiofilm activities of biosynthesized Fe3O4 NPs with average diameter size of 83.4 nm. Reduction in biofilm formation of S. aureus ATCC under Fe3O4 NPs stress was significant (66%) in higher MNPs concentration (100 μg/mL). In addition, as first report, spreading ability of S. aureus as important factor in colony expansion on culture medium was reduced by increasing of Fe3O4 NPs. Present study demonstrates striking antiplanktonic, antibiofilm, antispreading mobility and antioxidant aspects of one-pot biosynthesized Fe3O4 NPs with novel shape.
Introduction
Every year, approximately 100,000 tons of antibiotics against infectious diseases are produced worldwide [Citation1]. Misusage of this amount of antibiotics has lead to multidrug resistance emerging among pathogenic strains, specifically in bacteria [Citation2]. In addition to high costs, MDR has resulted in high-mortality rates through the inefficiency of conventional antimicrobial agents [Citation3]. According to natural selection phenomenon, spreading of resistant pathogens such as bacteria, fungi, and viruses are caused extremely by using new mechanisms of MDR in these microorganisms [Citation4]. For the case of bacteria species, these mechanisms include mainly the application of multidrug efflux pumps and resistance plasmids [Citation5]. Another problem associated with resistance to antibiotic chemotherapy is the formation of chronic biofilm [Citation6]. As a definition, bacterial biofilms are a slimy layer of bacteria that adhere to biotic and abiotic surfaces [Citation7]. With regard to the medicinal aspect, biofilm formation can be contributed to chronic infections such as cystic fibrosis and periodontitis [Citation8]. In order to remove biofilm, using an efficient strategy to disrupt the multicellular structure of the biofilm is necessary [Citation9]. Recently, nanotechnology was used as a novel and powerful tool in medicinal offers [Citation10]. In this technology, NPs application, specifically metal NPs (Ag, Cu, TiO2, ZnO, MgO, and Fe3O4 NPs) illustrated antimicrobial and antibiofilm activities against MDR pathogens [Citation11,Citation12]. Among these effects, antibacterial activities of magnetic iron oxide (Fe3O4) NPs have been reported by many investigators [Citation13,Citation14].
Based on bottom-up and top-down approaches, there are many ways for preparation of Fe3O4 NPs including hydrothermal synthesis, thermal decomposition, ultrasound-assisted reduction, co-precipitation, electrochemical synthesis, and laser pyrolysis techniques as chemical and physical methods [Citation15]. These methods have an advantage by the uniformity of MNPs distribution and disadvantages by consumption of toxic and expensive materials in MNPs preparation [Citation16]. In recent years, green synthesis was introduced and applied by many scientists as a novel and effective process [Citation17,Citation18]. Several types of living organisms such as microorganisms (specifically magnetotactic bacteria), plants, and fungi were used for MNPs synthesis [Citation19]. Among these organisms, plants have the advantages of more biocompatibility and availability than microbes and fungi [Citation20]. These advantages are caused by this fact that plants have various secondary metabolites like flavonoids, flavonols, and terpenoids which they can contribute in the reduction and stabilizing of metal ions and MNPs structure, respectively [Citation21]. Major disadvantages of green synthesis method are agglomeration and ununiform size and shape of NPs. For reducing these unsuitable results, we used ultrasonic wave as ultrasound-assisted reduction method. Advantages of this strategy were reported for the biosynthesis of Pd/Fe3O4 nanocatalyst by green tea leaves [Citation22].
Physicochemical properties of MNPs such as surface plasmon resonance (SPR) and local field enhancement (LFE) can be changed by the alteration of diameter size and surface composition. For instance, LFE of MNPs with bipyramids shape is higher than other shapes by the sharp tips [Citation23]. In this way, there are spherical, semi-spherical, cubic, triangular, rod, wire, flower-like, and dendrimer shapes. It is worth to note that biological activities including antimicrobial, anticancer, cytotoxic, antifungal, biocompatibility, and bioavailability of MNPs are also affected by the size and morphology alterations [Citation24]. These properties of MNPs can be tunable by the selection of synthesis methods and reducing and stabilizing agents [Citation25]. In this regard, the present study illustrated novel shape (dendrimer) of green synthesized Fe3O4 NPs with enhanced antibacterial and antibiofilm abilities.
Different medicinal aspects of Artemisia L. genus were approved by many investigators [Citation26,Citation27]. Among this genus, Artemisia haussknechtii Boiss. is one of the local species in Iran [Citation28]. Therefore, based on the above information, in this study, we utilized A. haussknechtii aqueous extract to synthesize Fe3O4 NPs with a new shape of dendrimer. Assays of disc diffusion, MIC/MBC, and growth kinetics were used to measure antibacterial effects of green synthesized Fe3O4 NPs on three sensitive and MDR bacteria species of S. aureus ATCC 43300, E. coli ATCC 25922, and S. marcescens ATCC13880. In addition, antibacterial mechanisms of these MNPs were determined through analyzing changing in biofilm and bacterial morphology properties.
Materials and methods
Materials
Iron(III) chloride hexahydrate (FeCl3.6H2O ≥98%), Iron(II) chloride tetrahydrate (FeCl2.4H2O ≥ 98%), Folin-Ciocalteu reagent (FCR), gallic acid, rutin, (+)-catechin, vanillin, sodium carbonate (Na2CO3), sodium nitrite (NaNO2), aluminum chloride (AlCl3.6H2O), sodium hydroxide (NaOH), dimethyl sulfoxide (DMSO), hydrochloric acid (HCl), sulphuric acid (H2SO4), methanol, ethanol, sodium phosphate (Na3PO4), ammonium molybdate [(NH4)6Mo7O24·4H2O], sodium acetate (CH3COONa), 1X PBS (137 mM NaCl, 2.7 mM KCl, 4.3 mM Na2HPO4, 1.47 mM KH2PO4), glutaraldehyde, tannic acid (C76H52O46), 1,1-diphenyl-2-picryl-hydrazyl (DPPH), Mueller–Hinton broth (MHB), Mueller-Hinton agar (MHA), and crystal violet were purchased from Sigma-Aldrich (St. Louis, MO, USA).
Leaves extract preparation and biosynthesis of Fe3O4 NPs
Plant species of A. haussknechtii were sampled based on the previous study [Citation29]. Aqueous leaf extract of A. haussknechtii was prepared by 20 g of freshly amassed leaves. The leaves surface were cleaned with running tap water, followed by washing with distilled water and boiling in 250 ml volume of distilled water at 90°C temperature for half hour. Suspensions were filtered two times with Whatman No. 40 filter papers. The filtered sample was collected and stored at 4°C for next stage. This extract was utilized as reducing as well as stabilization/capping agents.
Duing the preparation Fe3O4 NPs, the conical flask containing 50 ml of ferric chloride hexahydrate (0.2 M) was added to 0.001, 0.01, and 0.1 M concentrations of FeCl2.4H2O (50 ml) under stirring on a magnetic stirrer for 2 h. Afterward, 10 mL of the aqueous extract of A. haussknechtii leaves was mixed with 90 ml of resulted solution and pH is adjusted to 8, by the addition of 0.1 M NaOH solution. The above reaction was under a stirring condition at room temperature followed by the application of ultrasonic irradiation for 2 h with a frequency of 40 kHz and the total acoustic power of 50 W [Citation30]. In comparison analysis, the effect of different temperatures (4, 25, 35, 45, 55, and 65 °C) on MNPs synthesis was measured in the range of 1–7 h. In order to purify MNPs, the resulting solution was centrifuged at 4000 rpm for 5 × 10 min and washed several times with 1:1 mixture of absolute methanol and distilled water. Powder MNPs were prepared by incubation of solution at 50°C for 48 h and then, they were stored in an airtight condition for further characterization by XRD, FTIR, and SEM analysis. The chemical reaction of Fe3O4 precipitation is given in the below EquationEquations 1(1)
(1) and Equation2
(2)
(2)
(1)
(1)
(2)
(2)
Physicochemical properties of MNPs
The prepared annealed samples were analyzed by XRD analysis, UV-Vis spectroscopy, FT-IR, field emission scanning electron micrograph (FE-SEM) to determine the structure, morphology, and elemental composition. XRD technique was applied by EQUNIOX 3000, diffractometer in the scanning range of 20–70°, 10–80° and 10–70°(2θ) using Cu Ka radiations of wavelength 1.5406 Å to determine the crystal phases and measurement of the mean crystal size of Fe3O4 NPs. Model XL30, Philips, Eindhoven, The Netherlands. FE-SEM was utilized to survey the MNPs morphology and the elemental analysis. AFM analysis was carried out at ambient conditions by AFM instrument (Nanosurf Mobile S, Fut uro Liest al) operating in non-contact (dynamic force) mode by silicon cantilevers of 125 µm length, nanotube tip, scanning rate of 5 μ/s, 5 nm resolution, resonance frequency 209–286 kHz, spring constant 20–80 nm−1. The intensity related to absorption peaks and peak absorbance for Fe3O4 NPs was indicated by UV-Vis spectrophotometer (Tomas, UV 331, Billerica, Massachusetts) from 300 to 800 nm wavelength. In addition, spectrophotometer (Bruker, Billerica, Massachusetts, Model: ALPHA) was utilized to obtain FT-IR spectra of each sample.
Total amounts of phenol, flavonoid, flavonol, and tannin
Folin–Ciocalteu assay was applied to assess the total amount of phenolic compounds as one of the important group of secondary metabolites [Citation31]. To prepare 3 ml volume of solution sample, distilled water was added to leaf extract and MNPs samples until we get an amount of 200 μL (1 mg/mL), blended completely by 0.5 ml of Folin–Ciocalteu reagent for 3 min followed by the addition of 2 ml of 20% (w/v) sodium carbonate (Na2CO3). The mixture was heated at 45°C for 15 min and then absorbance was indicated at OD765nm. The total phenolic amount was calculated via calibration curve. Measurements were carried out as triplicate repeat for each sample and demonstrated as mg of gallic acid equivalent (GAE) per g dry weight (/gDW).
Flavones, flavonols, flavanones, isoflavonoides, neoflavonoides, flavanols, flavan-3-ols, anthocyanins, and chalcones are important subgroups of flavonoides secondary metabolites in the plant kingdom [Citation32]. For indication of the total flavonoids amount of each sample, AlCl3 colorimetric assay was used with slight modification [Citation33]. Standard and treatment solutions (0.5 ml) were separately mixed by distilled water (2 ml) and 5% sodium nitrite (150 μL). Mixtures were combined with aluminum chloride 10% solution (150 μL) and 4% sodium hydroxide (2 ml) followed by standing for a period of 6 min. Then, distilled water was added to make a volume of 5 ml in a 5 ml volumetric flask. The mixture was allowed again to stand for 15 min and absorbance of the solutions was evaluated at OD510 nm against blank and the total flavonoid content was also expressed as rutin equivalents in mg per g of dried extract (mg/g DW).
In order to determine total flavonol content, 250 ml of 2% AlCl3 and 250 ml of 5% CH3COONa solution were added to 200 ml of each sample (1 mg/mL) [Citation34]. Samples were sealed and incubated for 2–3 h at 25 °C. The absorbance was indicated at OD440 nm and results were expressed as mean ± standard deviation by mg of (+)-catechin equivalents per g of dried extract (mg catechin/g DW).
Moreover, measurement of total tannin content was performed based on the method of Sun et al [Citation35]. About 1.5 ml of concentrated hydrochloric acid and 3 mL methanol solution of 4% vanillin were added to 50 μL of diluted samples. After 15 min incubation of mixture in room temperature, absorption was determined at OD500nm against methanol as a blank. Total tannin contents were presented as mg of (+)-catechin equivalent (CE)/g DW and all samples were also analyzed in triplicate repeat.
Total antioxidant capacity (TAC) and DPPH assays
Total antioxidant capacity (TAC) of the biosynthesized Fe3O4 NPs was measured in accordance with phosphomolybdenum assay [Citation36]. About 100 mg of dried leaf extract and the biosynthesized NPs were separately taken into a reaction vial and mixed with 0.05% dimethyl sulfoxide (DMSO). About 0.1 ml aliquot solution of the samples was mixed with 1 ml of the reagent solution (0.6 M H2SO4, 0.028 M Na3PO4 and 0.004 M [(NH4)6Mo7O24 4H2O]). Samples were incubated at 95°C for 90 min followed by cooling at 25°C. Then, absorbance of the resulted samples were indicated at OD695 nm against a reagent solution (without the annealed samples) as blank. Ascorbic acid was utilized as a positive control. The absorbance of the samples were reported as the total antioxidant activity which the higher antioxidant activity was illustrated by the higher absorbance.
DPPH scavenging activity of MNPs and leaf extract were determined by the 1,1-diphenyl-2-picryl-hydrazyl (DPPH) free radical scavenging assay in 96 well microtiter plate [Citation36]. Briefly, 100 μL of each concentration (100–500 μg/mL in methanol) of the green synthesized Fe3O4 NPs and aqueous leaf extract was mixed with 100 μL of DDPH (100 μM) solution and incubated in the dark condition and at room temperature for 1 h. After color change from violet to pale yellow, the absorbance of the mixtures was indicated at OD517 nm. Ascorbic acid was used for comparison assay. The capacity of the samples to scavenge DPPH radical was determined by:
MDR and sensitive bacteria
Reprehensive MDR and sensitive bacteria of gram negative (E. coli ATCC 25922 and S. marcescens ATCC13880) and gram-positive (S. aureus ATCC 43300) were used to determine the antimicrobial activity of Fe3O4 NPs. These strains were obtained from bacterial archive of microbiology laboratory, Razi University of Kermanshah. Following evaluation, bacterial strains were maintained on nutrient agar slants at 4 °C.
Disc diffusion assay
Antibacterial activity was determined by using disc diffusion assay [Citation37]. Overnight MHB cultures of pathogenic bacteria of E. coli ATCC 25922, S. marcescens ATCC13880, and S. aureus ATCC 43300 were prepared freshly for each assay. These cultures were mixed with sterile physiological saline and turbidity was indicated by adding physiological saline until obtaining 0.5 McFarland turbidity standard (1.5 × 10⁸ CFU/mL). Petri plates were prepared by 20 ml of sterile MHA and prepared bacterial inoculations were swabbed on the surface of the solidified media. After drying of media for 10 min, biosynthesized Fe3O4 NPs were impregnated on discs at different concentrations of Fe3O4 NPs (0.1, 0.01, and 0.001 M of FeCl2.4H2O) and were compared to plant leaf extract [Citation38].
Determination of MIC/MBC
The bacteriostatic and bactericidal activities of Fe3O4 NPs were measured by MIC/MBC assays [Citation39]. An appropriate volume of bacteria (2 μL) in MHB was added to suspensions of Fe3O4 NPs whose concentration varied using serial two-fold dilution from 100, 50, 25, 12.5, 6.25, and 3.12 μg/mL, respectively. These concentrations were taken from 0.1 M concentration of MNPs which had a higher antibacterial effect in agar diffusion assay. After incubation of medium for 24 h at 37 °C, the tubes monitored for turbidity as growth and non-turbidity as no growth. The MIC values were interpreted as the lowest concentration of the sample, which illustrated clear fluid with no development of turbidity. Ten μL of the samples from each tube with no growth of bacteria were subcultured onto an MHA. The minimum bactericidal concentration (MBC) was determined as the highest dilution of the Fe3O4 NPs that did not produce a single bacterial colony on the MHA after a 24 h of incubation period [Citation40].
Effect of Fe3O4 NPs on bacterial growth kinetic
Bacterial growth kinetics of E. coli ATCC 25922, S. marcescens ATCC13880, and S. aureus ATCC 43300 were evaluated under Fe2O3 NPs effect at different concentrations (1000, 500, 250, 100, 50, 25, 12.5, 6.25, and 0 μg/mL as control). These bacteria were grown in liquid LB medium until they reached the log phase [Citation41]. In order to obtain the first point of optical density (OD600nm), two different concentrations of 0.1 and 0.2 were determined by dilution of cell culture medium with fresh LB liquid medium. Different concentrations of Fe3O4 NPs were added into the cell culture medium. Then, the culture medium was incubated at 37 °C and 250 rpm. Bacterial growth kinetics was evaluated by measuring OD at 600 nm (bacterial concentration) at interval each hour.
Bacterial morphology analysis upon Fe3O4 NPs treatment
Morphology of bacteria upon Fe3O4 NPs treatment was visualized firstly by phase contrast microscopy (OLYMPUS-BX51, Shinjuko, Tokyo, Japan) using OLYMPUS-DP12 digital live camera and Q-capture pro7 software, Shinjuko, Tokyo, Japan, taking samples directly upon the cover-slide from stationary phase of growth kinetics. Then, effect Fe3O4 NPs on S. aureus morphology was observed precisely by FE-SEM. In this way, 1 ml of bacterial cultures from the stationary phase were taken and centrifuged at 5000 rpm for 5 min at 4°C. The pellet washed twice and suspended in 1X PBS (137 mM NaCl, 2.7 mM KCl, 4.3 mM Na2HPO4, 1.47 mM KH2PO4). One drop of the suspended culture was put on glass slides following the fixing of bacteria by incubating overnight in 2.5% glutaraldehyde. About 1% tannic acid (C76H52O46) was used for 5 min following dehydration by increasing concentration of ethanol (20, 40, 60, 80, and 100%). These samples were coated with gold or platinum for FE-SEM scanning analysis [Citation42].
Biofilm formation measurement
Ninety-six-well polystyrene plates was for evaluating biofilm formation. Initially, overnight cultures of bacteria were adjusted to an OD600 nm of 0.5 in LB medium and co-cultured by different concentrations (100, 50, 25, 12.5, 6.25, 3.12, and 0 μg/mL as control) of green synthesized Fe3O4 NPs as treatments and without MNPs as control for 24 h at 37 °C without shaking. Bacterial growth was determined by the assessment of absorbance at OD600 nm by UV-Vis spectroscopy. In order to remove planktonic bacteria and, plates were rinsed with water several times. Biofilms were stained with 350 μL of crystal violet (0.1%, v/v) for 30 min at 25 °C. Then, plates were emptied, washed with water, blotted onto tissue paper towels. Dried crystal violet was extracted with ethanol (95%, v/v), and total biofilm formation was then assayed at OD570 nm [Citation43]. All experiments were carried out as three replicate tests independently. In addition, results were presented as the averages plus standard deviations (SD) of three replicate cultures. The meaningful inhibition of biofilm was indicated by Tukey’s test (p ≤ .05).
Morphology analyses of biofilm by light microscopic and AFM
Light microscopic and AFM were utilized to observe changes of biofilm morphology of S. aureus ATCC 43300 under treatment by Fe3O4 NPs. In the case of observation by light microscopic; MRSA strains were cultured on small glass slides in 24-well microtitre plates with different concentrations of MNPs (100, 50, 25, 12.5, 6.25, 3.12, and 0 μg/mL as control) for 48 h. After this time, planktonic cells were eliminated and the biofilm was stained with crystal violet dye for 10 min followed by washing gently and then drying for 10 min. Afterward, the biofilm morphology was observed under light microscopy (40×) (OLYMPUS CX31 with camera model KECAM CMOS 10000 KPA) [Citation44]. After approval of morphology changes of biofilm under various amounts of biosynthesized NPs stress via light microscopic, AFM analysis was applied to assess obviously these changes. In this way, the topography of biofilm structure was evaluated at higher concentration of Fe3O4 NPs (μg/mL) compared with control sample. Preparation of biofilm by S. aureus was carried out on silicone slides for 24 h incubation at 37 °C followed by washing with PBS and air drying. Images were obtained at a resolution of 4.42 × 4.42 μm by non-contact AFM (Nanosurf Mobile S).
FTIR analysis of biofilm
Biological macromolecules including polysaccharides, proteins, and DNA are framework of biofilm structure which can be affected by MNPs stress [Citation45]. Biofilm surfaces on the glass slides were analyzed from the point of macromolecular composition in two conditions of high concentration (100 μg/mL) of Fe3O4 NPs stress and without MNPs treatment as control for a period of 24 h. For this analysis, FTIR spectrometer was used with the reflectance mode of wavenumber over the range of 400–4000 cm−1 (Bruker, Germany, model: ALPHA).
Spreading assay of S. aureus
This assay was carried out via the method of Kaito et al. with slight modification [Citation46]. In this case, 3 g of Muller Hinton agar was used and 0.8 g of nutrient broth in 100 ml distilled water followed by autoclaving of solution. Afterward, filter sterilized 10% (w/v) D-glucose in distilled water was added to the final solution. Different concentrations of MNPs (3.12, 6.25, 12.5, 25, 50, and 100 μg/mL as treatments) were co-incubated with 5 μL of S. aureus ATCC 43300 sample onto the center of plates for 48 h at 37 °C. Finally, the spreading of bacteria was indicated on the culture medium.
Statistical analysis
SPSS version 16 software (SPSS Inc., Chicago, IL, USA) was utilized to obtain one-way ANOVA (Tukey’s test) results of experiments. Furthermore, all tests were carried out in triplicates, means with standard deviation were measured and p ≤ .05 was determined statistically as the meaningful difference between samples and control. In order to determine the dose-response relation between the plant extracts and Fe3O4 NPs, regression analysis was applied. Furthermore, linear regression analysis was used to measure the correlation coefficient.
Results and discussions
Physicochemical properties of NPs
Ultraviolet-Visible (UV-Vis) spectroscopy
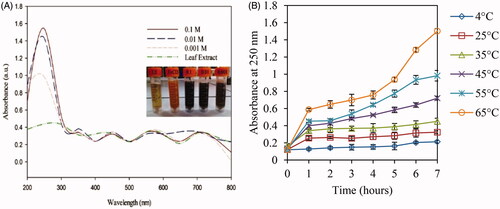
UV-visible absorbance spectroscopy is used to survey the NPs characterization such as concentration, size, aggregation, and bioconjugation [Citation47]. The UV-Vis spectroscopy of A. haussknechtii leaf extract and biosynthesized Fe3O4 NPs at different concentrations of FeCl2.4H2O are demonstrated in . The biosynthesized Fe3O4 NPs illustrated absorbance peaks in the range of 200–300 nm. However, aqueous leaf extract did not reveal any strong absorbance peak. Amount of absorbance for 0.1 M of FeCl2.4H2O was more than other concentrations [Citation48]. The pure metal salt solutions and aqueous leaf extract of A. haussknechtii did not demonstrate any color changes which indicated no proof of MNPs synthesis. Formation of Fe3O4 NPs in A. haussknechtii leaf aqueous extract medium was indicated by color change from pale green to blackish (). Phytochemicals such as flavonoids and polyphenols of A. haussknechtii leaf extract can be firmed by color change. This concentration (0.1 M) was selected to evaluate explicitly the effect of temperature parameter (4, 25, 35, 45, 55, and 65 °C) on the rate of MNPs growth in a period of 7 h (). Similar to the previous study about Ag and Au NPs synthesis, there was a direct relationship between temperature and absorbance values [Citation49].
Figure 1. UV-visible spectra of aqueous leaf extract and three concentrations (0.1, 0.01, and 0.001 M) of FeCl2.4H2O which were added to leaf extract (a) and increasing pattern of absorbance at 250 nm under selected salt concentration (0.1 M) of FeCl2.4H2O at various temperatures (b).
XRD analysis
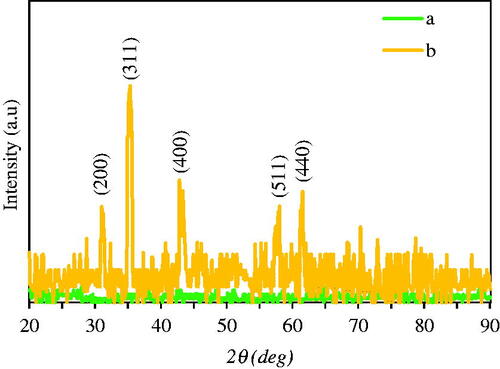
XRD analysis was applied for the determination of crystallinity and phase purity of Fe3O4 NPs. Comparison of the XRD patterns by aqueous extract of A. haussknechtii leaves and phytofabricated Fe3O4 NPs are demonstrated in . There was not any certain peak for plant leaf extract. Unanimous XRD patterns of leaf extract were reported by previous investigations [Citation48,Citation50]. illustrates diffraction peaks at 2θ = 31°, 35°, 42°, 58°, and 61° for Fe3O4 NPs, which are indicated to the crystal planes of (200), (311), (400), (511), and (440), respectively. These peaks were similar to JCPDS file no: 00–003-0863 and dissimilar to JCPDS file no: 01–089-3850, which demonstrated the cubic structure and non-maghemite (γ-Fe2O3) form of Fe3O4 NPs [Citation48].
Figure 2. XRD patterns of leaf extract A. haussknechtii (a) and green synthesized Fe3O4 NPs (b).
Debye-Scherrer equation was used for estimation of the crystallite size of Fe3O4 NPs [Citation51]. Debye–Scherrer equation is the relationship between crystallite size and X-ray diffraction peak broadening. This equation is shown as follows:
where d is the crystallite size of green synthesized Fe3O4 NPs for (hkl) phase, k is Scherrer constant (0.9), λ is the X-ray wavelength of radiation for Cu Kα (0.154 nm), βhkl is the full-width at half maximum at (hkl) peak in radian, and θhkl is the diffraction angle for (hkl) phase. Dependent upon atom density, each crystallographic facet contains energetically distinct sites. High atom density at (311) may be associated with high reactivity of these crystalline facets [Citation52]. By the equation, the estimated crystallite size of synthesized Fe3O4 NPs was 83.4 nm, which figured out to be high purity crystalline [Citation53].
FT-IR analysis
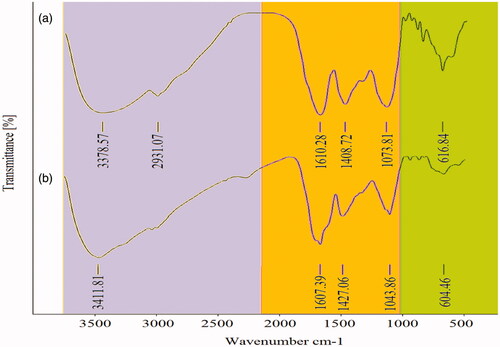
FT-IR analysis was used due to the indication of possible molecules for capping and reducing of MNPs [Citation54]. As seen in , the absorbance peaks at 604.46 cm−1 and 1043.86 cm−1 are attributed to C–Cl and C–F stretching strong bands for alkyl halide compounds [Citation55]. The peak at 1427.06 cm−1 corresponds to C=C stretching multiple bands of aromatic groups [Citation56]. The intensity of the absorption bands at 1607.39 cm−1 and 3411.81 cm−1 correspond respectively to C=O (carbonyl) and N–H (amine) stretching bands [Citation57]. Results of FT-IR analysis illustrated the attribution of different functional groups in the leaf extract including amine, carbonyl, polyphenols, and alkyl halide. Therefore, some polyphenols may be stabilizing of Fe3O4 NPs by attaching to the MNPs surfaces through interacting with free amine or carbonyl groups. Also, the absorption band at 1607.39 cm−1 confirms Fe–O stretches of Fe3O4 NPs [Citation58].
Figure 3. FT-IR spectrum peaks of leaf extract (a) and Fe3O4 NPs (b) biosynthesized by A. haussknechtii.
SEM images, EDAX, and AFM analysis
As shown in , the results of SEM images demonstrated the denderimer shape of Fe3O4 NPs with branched surfaces at nanometer magnifications. This structure may have resulted from chemical interactions such as hydrogen and electrostatic bonds between the organic capping agents of plant secondary metabolites and core of Fe3O4 NPs [Citation59]. Diameter sizes of NPs were in the range of 1–150 nm by the maximum size between 120 and 130 nm (). Compared to similar reports, green synthesized Fe3O4 NPs by Solanum trilobatum and Kappaphycus alvarezii extract had 18 and 14.7 nm size with spherical shape [Citation48,Citation60].
Figure 4. SEM photographs (a) and size distribution histogram (b) of biosynthesized Fe3O4 NPs with stages (1, 2, 3, and 4) of branched NPs formation. Amounts of each elements (c) and elemental distribution (d) in phytosynthesis of Fe3O4 NPs were illustrated by EDAX analysis.
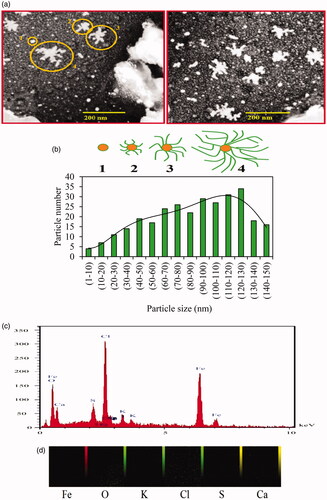
Elemental composition analysis of biosynthesized Fe3O4 NPs was performed by energy-disperse X-ray spectroscopy (EDAX) method (). EDAX graph indicated elemental signal for iron with an intensity of 111.8, which is specific for the absorption of metallic iron nanocrystallites resulted from surface plasmon resonance. Also, signals were observed for Cl, O, Ca, K, and S elements respectively with intensity of 138.4, 53.1, 12.6, 6.5, and 3.2 with also elemental distribution () which may be related to protein/enzymes presence in A. haussknechtii leaf extract [Citation61].
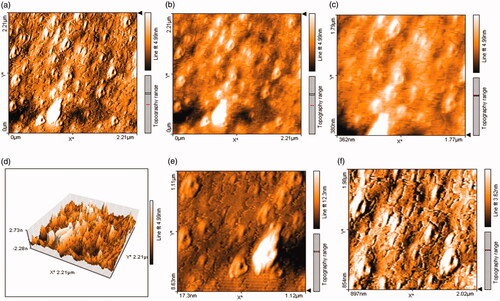
Surface topography, size, structure, agglomeration, and height of Fe3O4 NPs were surveyed by AFM analyses (. Various dimensions of images () were utilized to detect clearly NPs. As illustrated in , lower height of 2.73 nm and uniformity of size distribution were observed for Fe3O4 NPs. In this case, the previous study showed size distribution range 7–77 nm for green synthesized magnetic Fe3O4 NPs by fruit extract of Couroupita guianensis Aubl [Citation62]. Therefore, as a comparative approach, our results showed reduction and uniformity of Fe3O4 NPs size.
Figure 5. AFM micrographs (a, b, c, e, and f) and 3 D AFM images (d) of biosynthesized Fe3O4 NPs.
Antioxidant activities
Total contents of phenolic, flavonoid, flavonol, and tannin
Standard curve of gallic acid was used for quantitative evaluation of total phenols. As shown in , there is linearity curve of the calibration from 20 to 100 μg/mL concentration for gallic acid (R2 = 0.9987). illustrates the total phenolic content of the methanolic leaf extract and Fe3O4 NPs with 15.98 ± 1.30 and 3.22 ± 0.77 mg gallic acid equivalent (GAE)/g DW, respectively. In accordance with standard curve of rutin, measurement of total flavonoids was quantitatively performed and linearity of the calibration curve was obtained from 20 to 100 μg/mL amount for rutin (R2 = 0.9652; ). The leaf extract and Fe3O4, respectively showed total flavonoid content with 9.97 ± 1.71 and 1.65 ± 0.24 mg rutin equivalent (RE)/g DW (). There was a significant difference (p ≤ .05) between total phenol and flavonoid content of leaf extract and Fe3O4 NPs. Total flavonol content (TFC) around Fe3O4 NPs with a value of 0.76 ± 0.27 was less than leaf extract (p ≤ .05). Also, as shown in , total tannin amount was assessed as a standard curve of (+)-catechin and linearity of the calibration curve (R2 = 0.967) was gained from 0 to 120 μg/mL concentration for (+)-catechin. Fe3O4 NPs and leaf extract, respectively showed total tannin content with 0.29 ± 0.19 and 2.36 ± 0.47 mg (+)-catechin equivalent (CE)/g DW (). Also, as observed in this table, flavonoid/phenol ratio did not demonstrate a meaningful difference between Fe3O4 NPs and leaf extract.
Figure 6. Standard curve of absorbance against gallic acid concentration y = 0.0087x + 0.0071; R2=0.9987 (a), rutin concentration y = 0.0042x; R2 = 0.9652 (b), and (+)-catechin concentration y = 0.0055x + 0.004; R2= 0.967(c).
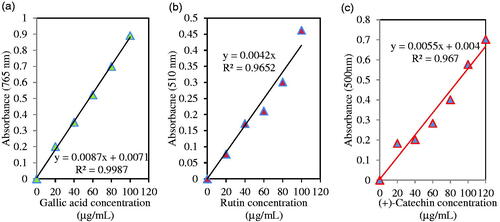
Table 1. Total contents of phenolics, flavonoid, flavonol, tannin, and ratio of flavonoid/phenol for phytofabricated Fe3O4 NPs and plant extract.
Total antioxidant capacity (TAC) and DPPH assays
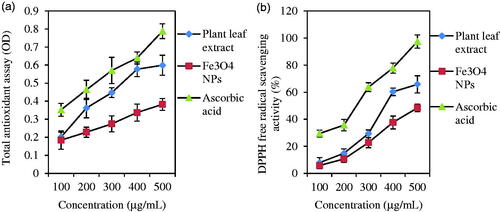
Total antioxidant capacity (TAC) of plant leaf extract, Fe3O4 NPs, and ascorbic acid (control) was compared together by phosphomolybdenum method. Antioxidant activity of Fe3O4 NPs was increased by the augmentation of samples concentration. As presented in , amounts of absorbance were 0.788 ± 0.033, 0.599 ± 0.041, and 0.382 ± 0.055, respectively for ascorbic acid, plant leaf extract, and Fe3O4 NPs at higher concentrations (500 μg/mL). Therefore, the total antioxidant ability of Fe3O4 NPs was lower than ascorbic acid and plant leaf extract. In the case of DPPH assay, there were similar results (). Fe3O4 NPs, plant leaf extract, and ascorbic acid showed respectively 48.36%±6.35, 65.7%±4.83, and 97.39%±2.73 values of free radical scavenging DPPH ability. Similarly, there was a value of 55.84%±1.31 for DPPH ability at a higher test concentration of 100 µg/mL [Citation63]. Compared to our previous study, these results illustrate less antioxidant activity of Fe3O4 NPs than Ag, Cu, and TiO2 NPs [Citation29].
Figure 7. TAC (a) and DPPH free radical scavenging activity (b) of leaf extract and Fe3O4 NPs. Ascorbic acid solution was applied as standard.
Antibacterial activities of Fe3O4NPs
Disk diffusion assay
The antibacterial capacity of Fe3O4 NPs was evaluated firstly against three bacteria E. coli ATCC 25922, S. aureus ATCC 43300, and S. marcescens ATCC13880 by disk diffusion assay. Inhibition zone diameter (IZD) was observed as confirmation of antibacterial ability after incubation of the plates (. This assay illustrated that higher concentration (0.1 M of FeCl2.4H2O) had maximum IZD value. E. coli bacterium demonstrated 12.16 ± 1.15 and 8 ± 1.5 mm for concentrations of 0.1 and 0.01 M of FeCl2.4H2O. Concentration of 0.001 had no clear inhibition zone. IZDs for S. aureus were 13.16 ± 0.76, 10.33 ± 1.04, and 12.66 ± 2.08 mm in the case of 0.1, 0.01, and 0.001 M concentration, respectively. S. marcescens showed respectively inhibition diameter of 13 ± 0.5 and 11.16 ± 0.76 mm for 0.1 and 0.01 concentrations (). In addition, there was no clear antibacterial activity in the case of leaf extract of A. haussknechtii.
Figure 8. Images showing zone inhibition values of different concentrations of FeCl2.4H2O (0.1, 0.01 and 0.001 M) against three bacteria strains: E. coil ATCC 25922 (a), S. aureus ATCC 43300 (b), and S. marcescens ATCC13880 (c).
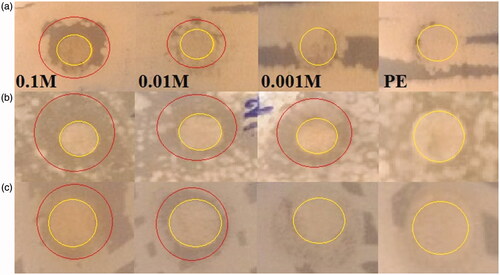
Table 2. IZD Results for Fe3O4 NPs effects on E. coil, S. aureus, and S. marcescens.
Determination of minimum inhibitory/bactericidal concentration (MIC/MBC)
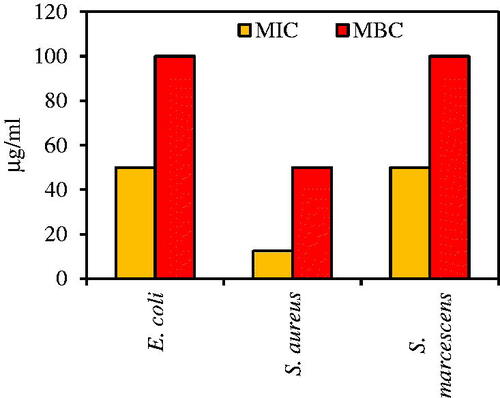
MIC and MBC assays were applied for evaluating minimum bacteriostatic and minimum bactericidal concentrations of green synthesized Fe3O4 NPs [Citation64]. In this regard, the effective amount of previous antibacterial test (0.1 M of FeCl2.4H2O) was used as a basic concentration to measure MIC assay. As shown in , the MIC values of Fe3O4 NPs against MDR and sensitive bacteria were in the range of 12.5–50 μg/mL. The highest value of this assay was for E. coli and S. marcescens with 50 μg/mL. In contrast, S. aureus had the lowest amount of 12.5 μg/mL. In case of MBC, values ranges 50–100 μg/mL. MBC result for E. coli and S. marcescens was 100 μg/mL. Staphylococcus. aureus showed lower concentration of MBC (50 μg/mL) than E. coli and S. marcescens. Therefore, it can be concluded based on these assays that E. coli and S. marcescens as gram-negative bacteria had more resistant than S. aureus as gram-positive bacteria [Citation65]. In gram-negative bacteria, multidrug efflux pumps as membrane-located transporters make a major contribution to this intrinsic resistance [Citation66]. Multidrug transporters in gram-negative bacteria protect bacterial cells from the function of antibiotic agents on both sides of the cytoplasmic and outer membranes with the broad specific substrate [Citation67].
Figure 9. Results of MIC/MBC assays for pathogenic bacteria under treatment of Fe3O4 NPs.
Effect of Fe3O4 NPs on bacterial growth kinetic
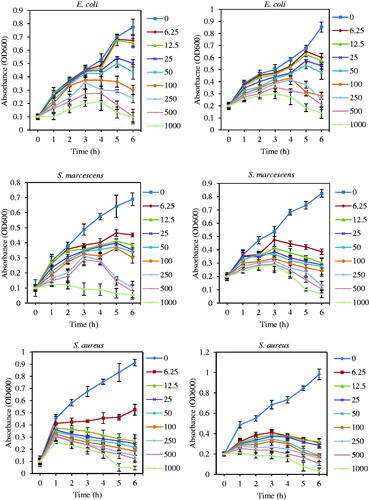
illustrates that the bacterial growth curve decreased continually by augmentation of Fe3O4 NPs concentration. The bacterial growth was delayed and inhibited, respectively at low and higher concentration of Fe3O4 NPs [Citation68]. Therefore, it may be a consequence from this graph that Fe3O4 NPs hada bacteriostatic property at low concentration. However, by increasing concentration, the bactericidal effect of MNPs is dominant [Citation69]. Agnihotri et al. reported that bacterial growth of E. coli MTCC443, B. subtilis MTCC 441, and S. aureus NCIM 5201 were decreased with increasing of Ag NPs amount [Citation70]. Higher reduction in growth kinetics of E. coli ATCC 25922 and S. marcescens ATCC13880 was observed at Fe3O4 NPs concentrations with ≥50 μg/mL. Comparatively, in the case of S. aureus ATCC 43300, lower amounts of MNPs (≥12.5) had a striking effect on bacterial growth reduction. Also, there was an obvious relationship between initial concentrations of bacteria (0.1 and 0.2 OD) with the antibacterial activity of MNPs. At higher initial OD (0.2), needed amounts of the Fe3O4 NPs to inhibit bacterial growth were more than lower initial OD (0.1) [Citation41].
Figure 10. Effect of Fe3O4 NPs on bacterial growth kinetic of E. coli ATCC 25922, S. marcescens ATCC13880, and S. aureus ATCC 43300 (with initial OD of 0.1 and 0.2) at different time. Error bars represent standard errors of the mean (based on tree independent replicates).
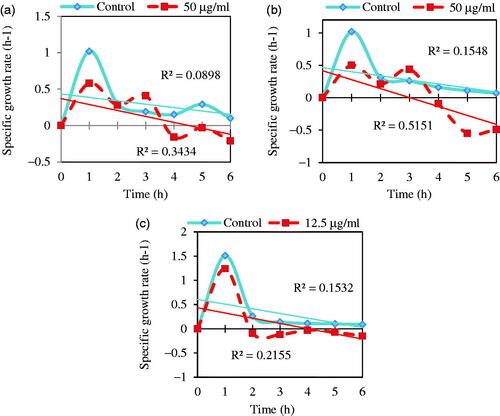
As demonstrated in , specific growth rate, μ, (OD600 nm/h) of three sensitive and MDR bacteria: (a) E. coli ATCC 25922, (b) S. marcescens ATCC13880, and (c) and S. aureus ATCC 43300S in the presence of MIC concentrations (50 μg/mL for E. coli and S. marcescens and 12.5 μg/mL for S. aureus) had negative rate after 3, 3, and 1 h, respectively. In contrast, there was no negative growth rate in control samples. Escherichia coli and S. marcescens had more resistance to Fe3O4 NPs than S. aureus. In this way, response difference of these bacteria can be caused bythe difference in cell wall stability and growth rate of gram-negative (–) and gram-positive (+) bacteria under Fe3O4 NPs stress [Citation71].
Figure 11. Specific growth rate, μ, (OD600nm/h) of three multidrug resistance bacteria: (a) E. coli ATCC 25922, (b) S. marcescens ATCC13880, and (c) S. aureus ATCC 43300 in the presence of MIC concentrations (50 μg/mL for E. coli and S. marcescens and 12.5 μg/mL for S. aureus) and absence of Fe3O4 NPs (control).
Bacterial morphology analysis upon Fe3O4 NPs treatment
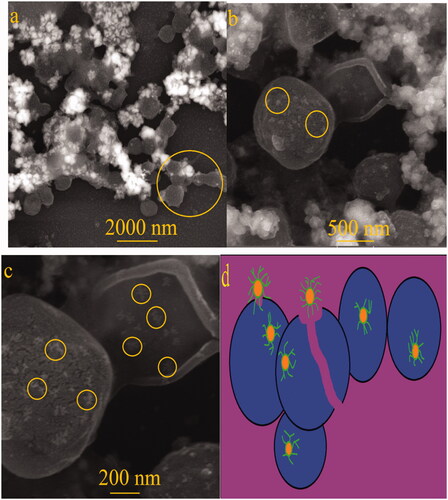
Morphology changes of the sensitive strain of S. aureus ATCC 43300 (MRSA) in the presence of 12.5 μg/mL concentration of Fe3O4 NPs was observed by SEM images (. As illustrated in c), cell wall clumping, interaction of MNPs with the cell surface, and damaging of bacterial wall are indicating of antibacterial mechanisms of Fe3O4 NPs. It is worth noting that the presence of MNPs inside of bacteria is obvious from this assay (). In order to clear illustration, shows a schematic image of several antibacterial mechanisms of Fe3O4 NPs against S. aureus.
Figure 12. SEM images of Fe3O4 NPs treated S. aureus cell surface. (a) cell wall clumping, (b) NPs on the cell surface, (c) bacterial rupture and (d) schematic design of antibacterial mechanisms of Fe3O4 NPs against S. aureus.
Biofilm formation assay
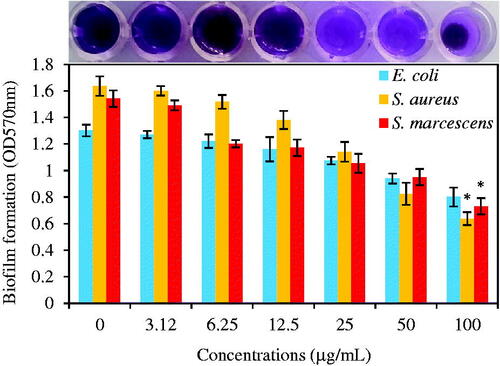
As shown in , biosynthesized Fe3O4 NPs had antibiofilm effects on E. coli, S. aureus, and S. marcescens bacteria at all concentrations (3.12, 6.25, 12.5, 25, 50, and 100 μg/mL) than control samples. Antibiofilm ability was increased with rising MNP concentrations for all bacteria. Higher resistance was observed for the case of E. coli than other bacteria. In contrast, MRSA bacteria demonstrated higher sensitivity with 0.638 ± 0.048 value at 100 μg/mL concentration (p ≤ .05). Furthermore, S. marcescens had a meaningful reduction in biofilm biomass than control samples in 100 μg/mL concentration (0.731 ± 0.061 (p ≤ .05)). At control, 1.302 ± 0.044, 1.636 ± 0.073, and 1.542 ± 0.062 values were observed, respectively for E. coli, S. aureus, and S. marcescens. Reduction percentages at 100 μg/mL concentration compared to control samples were 39, 61, and 53% in the case of E. coli, S. aureus, and S. marcescens, respectively. It can be concluded that antibiofilm activities of Fe3O4 NPs were in the sequence of S. aureus > S. marcescens > E. coli.
Figure 13. The graphic representation of biofilm formation of E. coli, S. aureus, and S. marcescens under treatment of different concentrations of green synthesized Fe3O4 NPs (0, 3.12, 6.25, 12.5, 25, 50, and 100 μg/mL) after 24 h incubation at 37 °C without shaking. Data are presented as average ± SD and (*) sign is p ≤ .05 value versus control samples.
AFM and morphology analyses of biofilm
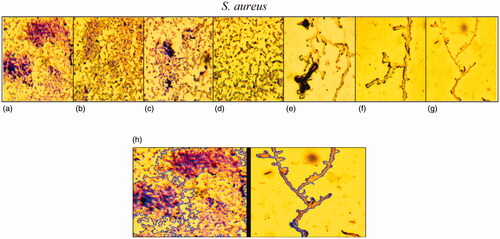
Biofilm morphology changes of S. aureus stain under Fe3O4 NPs stress was evaluated by a light microscope at a magnification of 40× (. As illustrated in these images, the reduction of biofilm structure was enhanced by the rising concentration of Fe3O4 NPs. Similar to biofilm formation assay, higher antibiofilm activity (66% reduction) was observed at 100 μg/mL of Fe3O4 NPs. Therefore, the results of these two methods showed obviously antibiofilm effects of Fe3O4 NPs at the higher concentrations. Changes in biofilm architecture were illustrated at 10 μL phosphatidylcholine-decorated Au NPs at 0.116 mg/mL concentration for 24 h incubation against Pseudomonas aeruginosa (PAO1) [Citation72]. Also, biofilm formation of E. coli and S. aureus was assessed at the presence of biosynthesized silver NPs in 5, 10, and 15 μg/mL concentrations for incubation of 48 h. In this regard, more reduction was viewed at 15 μg/mL amount of Ag NPs [Citation73].
Figure 14. Light microscopic images (at a magnification of 40×) of antibiofilm activity of Fe3O4 NPs in various concentrations 0 (a), 3.12 (b), 6.25 (c), 12.5 (d), 25 (e), 50 (f), 100 μg/mL (g) and comparison of biofilm area between control and NPs concentration by 100 μg/mL.
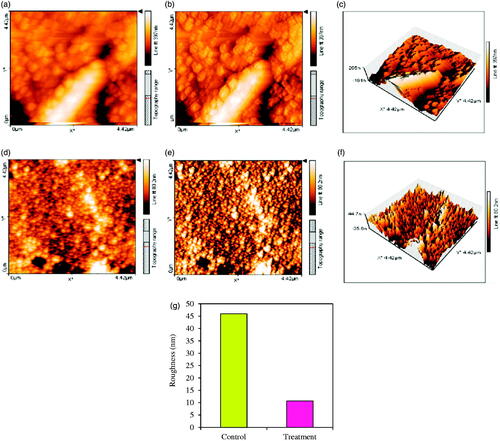
AFM images of biofilm formation by S. aureus under high concentrations of biological synthesized Fe3O4 NPs (as treatment) and free-NPs (as control) are presented in . As obvious from , biofilm roughness is lower in treatment (10.666 nm) compared to control ( by a value of 45.955 nm). In addition, there were pores in treatment biofilm resulted from biofilm damage by Fe3O4 NPs stress. The inhibition and disturbing of biofilm structure of S. aureus under Fe3O4 NPs treatments were approximately similar to the results of light microscopic and AFM analysis. Similarly, reduction in roughness values as 12–36% and 40–60% has been reported, respectively for S. aureus and E. coli in presence of biosynthesized Ag and Au NPs [Citation49].
Figure 15. Topography images in 2-D and (a, b, d, and e) in 3-D (c and f) illustrate higher roughness in control sample than treatment (d, e, and f) having disrupted structure of biofilm having pores. Photographs were taken at a resolution of 4.42 × 4.42 μm. Values of biofilm roughness for untreated S. aureus ATCC 43300 as control and treated by Fe3O4 NPs as treatment (g).
FT-IR analysis of biofilm
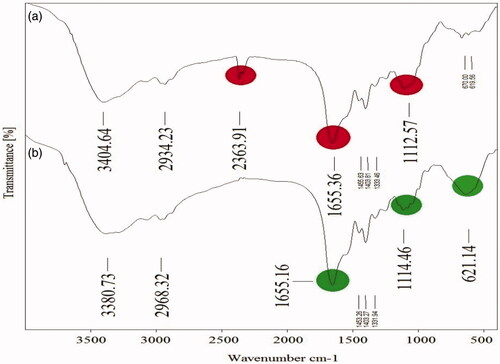
Polymers involving polysaccharides, protein, and nucleic acids are essential macromolecules in biofilm formation. FT-IR spectra of biofilm formation by S. aureus on a glass slide in two conditions of Fe3O4 NPs stress and NPs-free as control were compared due to analyzing chemical composition changes of biofilms after 24 h period (. Results showed peaks of 1114. 46 cm−1 and 1112.57 cm−1, respectively for control and treatment which can be the presence of sign of nucleic acids and polysaccharides macromolecules. Peaks at 1655.16 cm−1 and 1655.36 cm−1 illustrate the presence of proteins [Citation74]. In comparison, the treatment showed reduction and increasing of peak intensity at 621.14 cm−1 (C–Cl stretching bond) and 2363.91 cm−1 (C≡C bond), respectively.
Figure 16. FT-IR spectra of biofilm formation by S. aureus ATCC 43300 under Fe3O4 NPs stress (a) and without NPs as control (b).
Spreading assay of Staphylococcus aureus
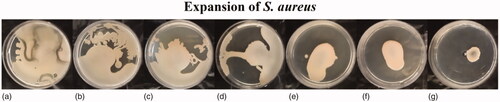
Colony expansion of S. aureus on soft agar was investigated previously in particular conditions as finger-like dendrites [Citation46]. As illustrated in , motility ability of S. aureus was determined by special assay of spreading upon Fe3O4 NPs stress in various concentrations (3.12, 6.25, 12.5, 25, 50, and 100 μg/mL). Compared to a clear pattern of bacterial colonies as finger-like dendrites in control sample and colonies under lower concentrations of Fe3O4 NPs (), there was a decreasing pattern of colonies expansion by increasing MNPs amounts. These results indicate the sensitivity of S. aureus colony under NPs stress, which is the antibacterial advantage of these MNPs. In fact, due tothe dependence of virulence, tissue colonization, and biofilm formation of S. aureus on colony spreading in initial stages of bacteria growth, infections related to this strain can be blocked by Fe3O4 NPs [Citation75].
Figure 17. Decreasing pattern of spreading in S. aureus ATCC 43300 colony at presence of 0 (a), 3.12 (b), 6.25 (c), 12.5 (d), 25 (e), 50 (f), and 100 μg/mL (g) of biosynthesized Fe3O4 NPs.
Surface topography, size, structure, agglomeration, and height of Fe3O4 NPs were surveyed by AFM analyses (. Various dimensions of images () were used to detect clearly NPs. As illustrated in , lower height of 2.73 nm and uniformity of size distribution were observed for Fe3O4 NPs. In this case, the previous study showed size distribution range 7–77 nm for green synthesized magnetic Fe3O4 NPs by fruit extract of Couroupita guianensis Aubl [Citation62].
In this regard, there are reports of the highest content of total phenolic (194.56 ± 3.15 mg GAE/g DW) and flavonoid (283.33 ± 7.18 mg RE/g DW) for fruit extract compared with green synthesized silver NPs (by Nothapodytes nimmoniana fruit extract) with 89.09 ± 4.97 mg GAE/g DW and 161.26 ± 2.02 mg RE/g DW values, respectively [Citation76]. Phenolic compounds act as antioxidants via their redox properties [Citation77]. The total phenolic concentration could be applied as rapid screening of antioxidant activities. Plant secondary metabolites such as flavonoids, including flavones, flavanols, and condensed tannins have the antioxidant abilities on the basis of the presence of free hydroxyl functional groups, which they can reduce metal ions to NPs [Citation78]. In this way, the metal ions including iron and copper ions bind to the various reducing/stabilizing flavonoids [Citation79].
Several studies have reported antibacterial effects of MNPs and metal oxide NPs on gram-positive and gram-negative bacteria [Citation80,Citation81]. The efficiency of these antibacterial agents may be related to the cell wall and membrane difference of bacteria. Gram-positive bacteria have a thick cell wall (about 20–80 nm) compared to gram-negative with a thin layer of peptidoglycan (about 7–8 nm) and two cell membranes (outer and plasma membrane) [Citation82]. It is worth mentioning that MNPs with a size range of 8–80 nm can penetrate the cell wall [Citation83]. Antibacterial activities of Fe3O4 NPs were demonstrated by several studies [Citation68,Citation84]. It was reported that these MNPs can cause damaging of E. coli membranes by diffusion of the tiny particles ranging from 10 to 80 nm [Citation85]. Zero-valent iron NPs interact with intracellular oxygen and cause disturbing the cell membrane bythe production of oxidative stress [Citation86]. Green synthesized Fe3O4 NPs by fruit extract of Couroupita guianensis Aubl. had more antibacterial activity on gram-negative bacteria K. penumoniae MTCC 530, E. coli MTCC 2939, and S. typhi MTCC 3917 than gram-positive bacterium S. aureus MTCC 96 [Citation62]. In this case, the generation of reactive oxygen species (ROS) as an antibacterial factor may result from MNPs unique properties. Also, CuO and Ag NPs have demonstrated that antibacterial activities can be raised by diameter size reduction of MNPs [Citation80,Citation87].
Based on cell wall characteristics including the thickness of peptidoglycan wall and number of the membrane, gram-positive and gram-negative bacteria are different. In this case, gram-negative bacteria with the cell wall including a thin layer of peptidoglycan, an outer bilayer membrane (lipopolysaccharides and proteins) and inner membrane are more complex than gram-positive bacteria by having only a thick layer of peptidoglycan cell wall and plasma membrane [Citation88]. In this regard, growth kinetic comparison of E. coli and B. subtilis (gram-positive) under different concentrations of iron oxide NPs showed higher growth inhibition for B. subtilis than E. coli [Citation68]. Also, the core-shell Fe3O4@C-PVPS:PEDOT NPs (iron oxide NPs coated by catechol-conjugated poly (vinylpyrrolidone) sulfobetaines and encapsulated with poly (3,4-ethylenedioxythiophene)) illustrated a high antibacterial impact on S. aureus and E. coli [Citation89].
Changes of bacterial morphology were proved by the impact of MgO NPs on S. enteritidis, E. coli O157:H7, and C. jejuni bacteria in the late-log phase of growth [Citation81]. These alterations in morphology were involved in changing shape from spiral to coccoid and producing deep craters in the bacterial membrane. Cell wall clumping, membrane blebs, and rupture were observed in E. coli MTCC 443 at the stationary phase of growth kinetics upon treatment by ZnO NPs with a diameter range of 25–45 nm [Citation90]. Toxicity of MNPs against bacteria can be related to several parameters involving the type of bacteria, physicochemical properties of MNPs such as the large surface area to volume (SA:V ratio), and chemical and biological functionalization of MNPs surface [Citation91]. In this study, secondary metabolites of A. haussknechtii leaf aqueous extract such as phenol and flavonoids can influence on this property [Citation92].
Antibiofilm properties of green synthesized MNPs were reported by other studies [Citation93,Citation94]. Synergism effect of chemical synthesized Fe3O4 NPs with antibiotics of streptomycin, vancomycin, and penicillin was estimated against biofilm formation of Enterococcus faecalis pathogen. Result of this study did not approve great antibiofilm activity of magnetic NPs with high concentration (1688–16988 μg/mL) [Citation95]. Pseudomonas aureuginosa and S. aureus exhibited biofilm reduction from 125 and 250 μg/mL to 1000 μg/mL amounts of Fe3O4 NPs, respectively [Citation96]. Incubation of E. coli ATCC 15224 and S. aureus ATCC 25923 for 72 h at 37 °C on glass and silicon surface with Fe3O4 NPs coating showed a meaningful reduction in these bacteria [Citation97]. Unique properties of MNPs including large surface to volume ratio augment reactivity of MNPs with surrounding materials. In this way, the generation of reactive oxygen species (O2•, OH•, and H2O2) resulted from MNPs which can disrupt the biofilm structure of bacteria [Citation98]. Also, the shape of MNPs can be an efficient factor in biofilms and bacteria damage [Citation72].
Conclusions
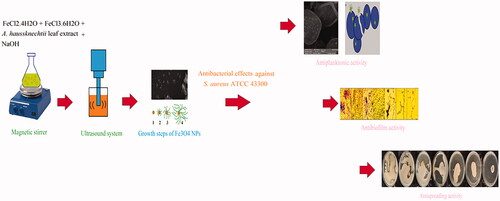
In summary, antioxidant, antiplanktonic, antibiofilm, and antimotility capacities of biosynthesized Fe3O4 NPs by leaf aqueous extract of medicinal plant A. haussknechtii on three MSR bacteria E. coli ATCC 25922, S. marcescens ATCC13880 and S. aureus ATCC 43300 were surveyed as ecofriendly and efficient approach (). There are several reports in the case of antibacterial activities of MNPs, but it has been paid less attention about antibiofilm and antimotility aspects of MNPs, specifically biosynthesized Fe3O4 NPs. This study introduced a novel shape of Fe3O4 NPs with the one-pot method of synthesis. In addition, roles of secondary metabolites involving flavonoids, flavonols, and phenols (with having phenolic–OH groups) as reducing and stabilizing agents of iron ions (Fe3+ and Fe2+) were demonstrated in this investigation. Changing of S. aureus ATCC 43300 strain morphology were indicated as an important facet of antibacterial activities of this type of MNPs. Finally, complementary investigations are needed about the effects of secondary metabolites on MNPs green synthesis and details related to antibacterial and antibiofilm properties of Fe3O4 NPs.
Figure 18. Schematic image for several selection of this study.
Acknowledgements
We are grateful to the Agricultural Research Center of Kurdistan for identification of plant sample as well as microbiology laboratory of Razi University to provide sensitive and MDR strains of E. coli ATCC 25922, S. marcescens ATCC 13880, and S. aureus ATCC 43300.
Disclosure statement
No potential conflict of interest was reported by the authors.
Correction Statement
This article has been republished with minor changes. These changes do not impact the academic content of the article.
References
- Nikaido H. Multidrug resistance in bacteria. Annu Rev Biochem. 2009;78:119–146.
- Remschmidt C, Schröder C, Behnke M, et al. Continuous increase of vancomycin resistance in enterococci causing nosocomial infections in Germany − 10 years of surveillance. Antimicrob Resist Infect Control. 2018;7:54.
- Tanwar J, Das S, Fatima Z, et al. Multidrug resistance: an emerging crisis. Interdiscip Perspect Infect Dis. 2014;2014:1.
- World Health Organization. Antimicrobial resistance: global report on surveillance. World Health Organization; 2014.
- Ghanem B, Haddadin RN. Multiple drug resistance and biocide resistance in Escherichia coli environmental isolates from hospital and household settings. Antimicrob Resist Infect Control. 2018;7:47.
- Høiby N, Bjarnsholt T, Givskov M, et al. Antibiotic resistance of bacterial biofilms. Int J Antimicrob Agents. 2010;35:322–332.
- de la Fuente-Núñez C, Korolik V, Bains M, et al. Inhibition of bacterial biofilm formation and swarming motility by a small synthetic cationic peptide. Antimicrob Agent Chemother. 2012;56:2696–2704.
- Darveau RP. Periodontitis: a polymicrobial disruption of host homeostasis. Nat Rev Microbiol. 2010;8:481–490.
- Bjarnsholt T, Ciofu O, Molin S, et al. Applying insights from biofilm biology to drug development [mdash] can a new approach be developed? Nat Rev Drug Discov. 2013;12:791–808.
- Sanvicens N, Marco MP. Multifunctional nanoparticles-properties and prospects for their use in human medicine. Trends Biotechnol. 2008;26:425–433.
- Gurunathan S, Han JW, Kwon D-N, et al. Enhanced antibacterial and anti-biofilm activities of silver nanoparticles against Gram-negative and Gram-positive bacteria. Nanoscale Res Lett. 2014;9:373.
- Suresh J, Pradheesh G, Alexramani V, et al. Green synthesis and characterization of hexagonal shaped MgO nanoparticles using insulin plant (Costus pictus D. Don) leave extract and its antimicrobial as well as anticancer activity. Adv Powder Technol. 2018;29:1685–1694.
- Necula BS, Van Leeuwen J, Fratila-Apachitei LE, et al. In vitro cytotoxicity evaluation of porous TiO 2–Ag antibacterial coatings for human fetal osteoblasts. Acta Biomater. 2012;8:4191–4197.
- Mahmoudi M, Serpooshan V. Silver-coated engineered magnetic nanoparticles are promising for the success in the fight against antibacterial resistance threat. ACS Nano. 2012;6:2656–2664.
- Mohapatra M, Anand S. Synthesis and applications of nano-structured iron oxides/hydroxides–a review. Int J Eng Sci Technol. 2010;2:127–146.
- Wu W, Wu Z, Yu T, et al. Recent progress on magnetic iron oxide nanoparticles: synthesis, surface functional strategies and biomedical applications. Sci Technol Adv Mater. 2015;16:023501.
- Singh P, Ahn S, Kang J-P, et al. Ecofriendly synthesis of silver and gold nanoparticles by Euphrasia officinalis leaf extract and its biomedical applications. Artif Cells Nanomed Biotechnol. 2017;46(6):1–8.
- Murugan N, Sundramoorthy AK. Green synthesis of fluorescent carbon dots from Borassus flabellifer flowers for label-free highly selective and sensitive detection of Fe3+ ions [10.1039/C8NJ01894D]. New Journal of Chemistry 2018;42(16):13297–13307.
- Rafique M, Sadaf I, Rafique MS, et al. A review on green synthesis of silver nanoparticles and their applications. Artif Cells Nanomed Biotechnol. 2017;45:1272–1291.
- Pantidos N, Horsfall LE. Biological synthesis of metallic nanoparticles by bacteria, fungi and plants. J Nanomed. Nanotechnol. 2014;5:1.
- Chahardoli A, Karimi N, Sadeghi F, et al. Green approach for synthesis of gold nanoparticles from Nigella arvensis leaf extract and evaluation of their antibacterial, antioxidant, cytotoxicity and catalytic activities. Artif Cells Nanomed Biotechnol. 2017;46(3):1–10.
- Veisi H, Ghorbani M, Hemmati S. Sonochemical in situ immobilization of Pd nanoparticles on green tea extract coated Fe3O4 nanoparticles: an efficient and magnetically recyclable nanocatalyst for synthesis of biphenyl compounds under ultrasound irradiations. Mater Sci Eng C Mater Biol Appl. 2019;98:584–593.
- Lee J-H, Gibson KJ, Chen G, et al. Bipyramid-templated synthesis of monodisperse anisotropic gold nanocrystals [Article]. Nat Commun. 2015;6:7571.
- Rónavári A, Kovács D, Igaz N, et al. Biological activity of green-synthesized silver nanoparticles depends on the applied natural extracts: a comprehensive study. IJN. 2017;12:871–883.
- Alavi M, Karimi N. Biosynthesis of Ag and Cu NPs by secondary metabolites of usnic acid and thymol with biological macromolecules aggregation and antibacterial activities against multi drug resistant (MDR) bacteria. Int J Biol Macromol. 2019;128:893–901.
- Jung UJ, Baek NI, Chung HG, et al. The anti-diabetic effects of ethanol extract from two variants of Artemisia princeps Pampanini in C57BL/KsJ-db/db mice. Food Chem Toxicol. 2007;45:2022–2029.
- Khlifi D, Sghaier RM, Amouri S, et al. Composition and anti-oxidant, anti-cancer and anti-inflammatory activities of Artemisia herba-alba, Ruta chalpensis L. and Peganum harmala L. Food Chem Toxicol. 2013;55:202–208.
- Nahrevanian H, Sheykhkanlooye Milan B, Kazemi M, et al. Antimalarial effects of Iranian flora Artemisia sieberi on Plasmodium berghei in vivo in mice and phytochemistry analysis of its herbal extracts. Malaria Res Treat. 2012;2012:1.
- Alavi M, Karimi N. Characterization, antibacterial, total antioxidant, scavenging, reducing power and ion chelating activities of green synthesized silver, copper and titanium dioxide nanoparticles using Artemisia haussknechtii leaf extract. Artif Cells Nanomed Biotechnol. 2017;46(8):1–16.
- Sathya K, Saravanathamizhan R, Baskar G. Ultrasound assisted phytosynthesis of iron oxide nanoparticle. Ultrason Sonochem. 2017;39:446–451.
- Gouveia S, Castilho PC. Antioxidant potential of Artemisia argentea L'Hér alcoholic extract and its relation with the phenolic composition. Food Res Int. 2011;44:1620–1631.
- Panche AN, Diwan AD, Chandra SR. Flavonoids: an overview. J Nutr Sci. 2016;5:e47.
- Do QD, Angkawijaya AE, Tran-Nguyen PL, et al. Effect of extraction solvent on total phenol content, total flavonoid content, and antioxidant activity of Limnophila aromatica. J Food Drug Anal. 2014;22:296–302.
- Taleb H, Maddocks SE, Morris RK, et al. The antibacterial activity of date syrup polyphenols against S. aureus and E. coli. Front Microbiol. 2016;7:198.
- Sun B, Ricardo-da-Silva JM, Spranger I. Critical factors of vanillin assay for catechins and proanthocyanidins. J Agric Food Chem. 1998;46:4267–4274.
- Baskaran X, Geo Vigila AV, Parimelazhagan T, et al. Biosynthesis, characterization, and evaluation of bioactivities of leaf extract-mediated biocompatible silver nanoparticles from an early tracheophyte, Pteris tripartita Sw. IJN. 2016;11:5789–5806.
- Balouiri M, Sadiki M, Ibnsouda SK. Methods for in vitro evaluating antimicrobial activity: a review. J Pharm Anal. 2016;6:71–79.
- Paredes D, Ortiz C, Torres R. Synthesis, characterization, and evaluation of antibacterial effect of Ag nanoparticles against Escherichia coli O157:H7 and methicillin-resistant Staphylococcus aureus (MRSA). Int J Nanom. 2014;9:1717–1729.
- European Committee for Antimicrobial Susceptibility Testing of the European Society of Clinical M, Infectious D. Determination of minimum inhibitory concentrations (MICs) of antibacterial agents by broth dilution. Clin Microbiol Infect. 2003;9:ix–xv.
- Elumalai K, Velmurugan S. Green synthesis, characterization and antimicrobial activities of zinc oxide nanoparticles from the leaf extract of Azadirachta indica (L.). Appl Surf Sci. 2015;345:329–336.
- Maiti S, Krishnan D, Barman G, et al. Antimicrobial activities of silver nanoparticles synthesized from Lycopersicon esculentum extract. J Anal Sci Technol. 2014;5:40.
- Alavi M, Karimi N. Antiplanktonic, antibiofilm, antiswarming motility and antiquorum sensing activities of green synthesized Ag–TiO2, TiO2–Ag, Ag–Cu and Cu–Ag nanocomposites against multi-drug-resistant bacteria. 2018;46:399–413.
- Djordjevic D, Wiedmann M, McLandsborough LA. Microtiter plate assay for assessment of Listeria monocytogenes biofilm formation. Appl Environ Microbiol. 2002;68:2950–2958.
- Nithyanand P, Beema Shafreen RM, Muthamil S, et al. Usnic acid inhibits biofilm formation and virulent morphological traits of Candida albicans. Microbiol Res. 2015;179:20–28.
- Silva JM, Reis RL, Mano JF. Biomimetic extracellular environment based on natural origin polyelectrolyte multilayers. Small. 2016;12:4308–4342.
- Pollitt EJG, Crusz SA, Diggle SP. Staphylococcus aureus forms spreading dendrites that have characteristics of active motility [Article]. Sci Rep. 2015;5:17698.
- Lin P-C, Lin S, Wang PC, et al. Techniques for physicochemical characterization of nanomaterials. Biotechnol Adv. 2014;32:711–726.
- Yew YP, Shameli K, Miyake M, et al. Green synthesis of magnetite (Fe3O4) nanoparticles using seaweed (Kappaphycus alvarezii) extract. Nanoscale Res Lett. 2016;11:276.
- Salunke GR, Ghosh S, Santosh Kumar RJ, et al. Rapid efficient synthesis and characterization of silver, gold, and bimetallic nanoparticles from the medicinal plant Plumbago zeylanica and their application in biofilm control. Int J Nanomed. 2014;9:2635–2653.
- Elsupikhe RF, Shameli K, Ahmad MB, et al. Green sonochemical synthesis of silver nanoparticles at varying concentrations of kappa-carrageenan. Nanoscale Res Lett. 2015;10:916.
- Unterweger H, Tietze R, Janko C, et al. Development and characterization of magnetic iron oxide nanoparticles with a cisplatin-bearing polymer coating for targeted drug delivery. Int J Nanomed. 2014;9:3659–3676.
- Upadhyay S, Parekh K, Pandey B. Influence of crystallite size on the magnetic properties of Fe3O4 nanoparticles. J Alloy Compd. 2016;678:478–485.
- Silva VAJ, Andrade PL, Silva MPC, et al. Synthesis and characterization of Fe3O4 nanoparticles coated with fucan polysaccharides. J Magn Magn Mater. 2013;343:138–143.
- Shameli K, Ahmad MB, Jazayeri SD, et al. Synthesis and characterization of polyethylene glycol mediated silver nanoparticles by the green method. Int J Mol Sci. 2012;13:6639–6650.
- Arafat Y, Ali S, Shahzadi S, et al. Preparation, characterization, and antimicrobial activities of bimetallic complexes of sarcosine with Zn(II) and Sn(IV). Bioinorg Chem Appl. 2013;2013;351262.
- Nikolic G, Zlatkovic S, Cakic M, et al. Fast fourier transform IR characterization of epoxy GY systems crosslinked with aliphatic and cycloaliphatic EH polyamine adducts. Sensors (Basel). 2010;10(1):684–696.
- Mudavath SL, Talat M, Rai M, et al. Characterization and evaluation of amine-modified graphene amphotericin B for the treatment of visceral leishmaniasis: in vivo and in vitro studies. Drug Des Devel Ther. 2014;8:1235–1247.
- Wang T, Jin X, Chen Z, et al. Green synthesis of Fe nanoparticles using eucalyptus leaf extracts for treatment of eutrophic wastewater. Sci Total Environ. 2014;466–467:210–213.
- Mahendran G, Ranjitha Kumari BD. Biological activities of silver nanoparticles from Nothapodytes nimmoniana (Graham) Mabb. fruit extracts. Food Sci Human Wellness. 2016;5:207–218.
- Vinothkannan M, Karthikeyan C, Gnana kumar G, et al. One-pot green synthesis of reduced graphene oxide (RGO)/Fe3O4 nanocomposites and its catalytic activity toward methylene blue dye degradation. Spectrochim Acta A Mol Biomol Spectrosc. 2015;136:256–264.
- Weng X, Huang L, Chen Z, et al. Synthesis of iron-based nanoparticles by green tea extract and their degradation of malachite. Ind Crops Prod. 2013;51:342–347.
- Satishkumar G, Logeshwaran V, Sarathbabu S, et al. Green synthesis of magnetic Fe3O4 nanoparticles using Couroupita guianensis Aubl. fruit extract for their antibacterial and cytotoxicity activities. Artif Cells Nanomed Biotechnol. 2017;46(3):1–10.
- Netala VR, Bethu MS, Pushpalatha B, et al. Biogenesis of silver nanoparticles using endophytic fungus Pestalotiopsis microspora and evaluation of their antioxidant and anticancer activities. IJN. 2016;11:5683.
- Masadeh MM, Karasneh GA, Al-Akhras MA, et al. Cerium oxide and iron oxide nanoparticles abolish the antibacterial activity of ciprofloxacin against gram positive and gram negative biofilm bacteria. Cytotechnology. 2015;67:427–435.
- Nikaido H. Antibiotic resistance caused by gram-negative multidrug efflux pumps. Clin Infect Dis. 1998;27:S32–S41.
- Tikhonova EB, Wang Q, Zgurskaya HI. Chimeric analysis of the multicomponent multidrug efflux transporters from gram-negative bacteria. J Bacteriol. 2002;184:6499–6507.
- Blair JMA, Webber MA, Baylay AJ, et al. Molecular mechanisms of antibiotic resistance [Review]. Nat Rev Microbiol. 2015;13:42–51.
- Arakha M, Pal S, Samantarrai D, et al. Antimicrobial activity of iron oxide nanoparticle upon modulation of nanoparticle-bacteria interface. Sci Rep. 2015;05:14813.
- Seil JT, Webster TJ. Antimicrobial applications of nanotechnology: methods and literature. Int J Nanomed. 2012;7:2767–2781.
- Agnihotri S, Mukherji S, Mukherji S. Size-controlled silver nanoparticles synthesized over the range 5–100 nm using the same protocol and their antibacterial efficacy. RSC Adv. 2014;4:3974–3983.
- Ma S, Zhan S, Jia Y, et al. Superior antibacterial activity of Fe3O4-TiO2 nanosheets under solar light. ACS Appl Mater Interfaces. 2015;7:21875–21883.
- Mu H, Tang J, Liu Q, et al. Potent antibacterial nanoparticles against biofilm and intracellular bacteria [Article]. Sci Rep. 2016;6:73–80.
- Goswami SR, Sahareen T, Singh M, et al. Role of biogenic silver nanoparticles in disruption of cell–cell adhesion in Staphylococcus aureus and Escherichia coli biofilm. J Ind Eng Chem. 2015;26:73–80.
- Harimawan A, Rajasekar A, Ting Y-P. Bacteria attachment to surfaces-AFM force spectroscopy and physicochemical analyses. J Colloid Interface Sci. 2011;364:213–218.
- Iwase T, Uehara Y, Shinji H, et al. Staphylococcus epidermidis Esp inhibits Staphylococcus aureus biofilm formation and nasal colonization. Nature. 2010;465:346.
- Mahendran G, Kumari B. Biological activities of silver nanoparticles from Nothapodytes nimmoniana (Graham) Mabb. fruit extracts. Food Sci Human Well. 2016;5:207–218.
- Brewer MS. Natural antioxidants: sources, compounds, mechanisms of action, and potential applications. Comp Rev Food Sci Food Saf. 2011;10:221–247.
- Działo M, Mierziak J, Korzun U, et al. The potential of plant phenolics in prevention and therapy of skin disorders. IJMS. 2016;17:160.
- Mira L, Tereza Fernandez M, Santos M, et al. Interactions of flavonoids with iron and copper ions: a mechanism for their antioxidant activity. Free Radic Res. 2002;36:1199–1208.
- Azam A, Ahmed AS, Oves M, et al. Antimicrobial activity of metal oxide nanoparticles against Gram-positive and Gram-negative bacteria: a comparative study. Int J Nanomed. 2012;7:6003–6009.
- He Y, Ingudam S, Reed S, et al. Study on the mechanism of antibacterial action of magnesium oxide nanoparticles against foodborne pathogens. J Nanobiotechnol. 2016;14:54.
- Silhavy TJ, Kahne D, Walker S. The bacterial cell envelope. Cold Spring Harb Perspect Biol. 2010;2:a000414.
- Fröhlich EE, Fröhlich E. Cytotoxicity of nanoparticles contained in food on intestinal cells and the gut microbiota. Int J Mol Sci. 2016;17:509.
- Zhou Y, Kong Y, Kundu S, et al. Antibacterial activities of gold and silver nanoparticles against Escherichia coli and bacillus Calmette-Guérin. J Nanobiotechnol 2012;10:19.
- Hajipour MJ, Fromm KM, Akbar Ashkarran A, et al. Antibacterial properties of nanoparticles. Trends Biotechnol. 2012;30:499–511.
- Saccà ML, Fajardo C, Martinez-Gomariz M, et al. Molecular stress responses to nano-sized zero-valent iron (nZVI) particles in the soil bacterium Pseudomonas stutzeri. PLoS One. 2014;9:e89677.
- Wang L, Hu C, Shao L. The antimicrobial activity of nanoparticles: present situation and prospects for the future. IJN. 2017;12:1227–1249.
- Cabeen MT, Jacobs-Wagner C. Bacterial cell shape. Nat Rev Microbiol. 2005;3:601.
- Jeong CJ, Sharker SM, In I, et al. Iron oxide@ PEDOT-based recyclable photothermal nanoparticles with poly (vinylpyrrolidone) sulfobetaines for rapid and effective antibacterial activity. ACS Appl Mater Interfaces. 2015;7:9469–9478.
- Arakha M, Saleem M, Mallick BC, 27, et al. The effects of interfacial potential on antimicrobial propensity of ZnO nanoparticle. Sci Rep. 2015;5:9578.
- Salem W, Leitner DR, Zingl FG, et al. Antibacterial activity of silver and zinc nanoparticles against Vibrio cholerae and enterotoxic Escherichia coli. Int J Med Microbiol. 2015;305:85–95.
- Madhumitha G, Elango G, Roopan SM. Biotechnological aspects of ZnO nanoparticles: overview on synthesis and its applications. Appl Microbiol Biotechnol. 2016;100:571–581.
- Singh P, Kim YJ, Wang C, et al. Biogenic silver and gold nanoparticles synthesized using red ginseng root extract, and their applications. Artif Cells Nanomed Biotechnol. 2016;44:811–816.
- Velusamy P, Su C-H, Kumar GV, et al. Biopolymers regulate silver nanoparticle under microwave irradiation for effective antibacterial and antibiofilm activities. PLoS One. 2016;11:e0157612.
- Chifiriuc MC, Grumezescu AM, Andronescu E, et al. Water dispersible magnetite nanoparticles influence the efficacy of antibiotics against planktonic and biofilm embedded Enterococcus faecalis cells. Anaerobe. 2013;22:14–19.
- Grumezescu AM, Cotar AI, Andronescu E, et al. In vitro activity of the new water-dispersible Fe3O4@usnic acid nanostructure against planktonic and sessile bacterial cells. J Nanopart Res. 2013;15:1766.
- Grumezescu V, Andronescu E, Holban AM, et al. MAPLE fabrication of thin films based on kanamycin functionalized magnetite nanoparticles with anti-pathogenic properties. Appl Surf Sci. 2015;336:188–195.
- Durán N, Durán M, de Jesus MB, et al. Silver nanoparticles: a new view on mechanistic aspects on antimicrobial activity. Nanomed Nanotechnol Biol Med. 2016;12:789–799.