
 ?Mathematical formulae have been encoded as MathML and are displayed in this HTML version using MathJax in order to improve their display. Uncheck the box to turn MathJax off. This feature requires Javascript. Click on a formula to zoom.
Abstract
This study was aimed at preparing and characterising kojic acid nanostructured lipid carriers (KA-NLCs) for delivery to skin. KA-NLCs were prepared using high-speed homogenization followed by ultra-probe sonication method. KA-NLCs were optimized by glyceryl mono-stearate (GMS) and cholesterol (Chol) as solid lipid excipients, oleic acid (OA) as liquid lipid excipient, span 60 (SP 60) and Tween 20 (Tw 20) as co-emulsifiers. For optimized formulation (KA-NLC3), values of particle size, encapsulation efficiency, drug loading, polydispersity index (PDI) and zeta potential (ZP) were found to be 172.9 ± 7.1 nm, 76.4 ± 0.1%, 17.6 ± 1.3%, 0.3 ± 0.1 and −39.1 ± 2.7 mV, respectively. KA-NLC3 was stable at 4 °C and 25 for 3 months. TEM image confirmed these results. ATR-FTIR, DSC and PXRD results indicated suitable entrapment of KA in NLCs without any chemical interaction. The release profile of KA-NLC3 followed a sustained pattern. KA-NLC3 has potent tyrosinase inhibitory activity in comparison with pure KA. Nanoparticles showed a higher antioxidant activity than pure KA. The results of the ex vivo and in vitro percutaneous absorption showed that KA-NLC3 improved percutaneous delivery of KA. Concentrations below 250 μg/mL were determined as suitable concentrations for KA-NLC3. It seems to be biocompatible formulation for the cosmetics aims.
Introduction
Skin melanin is a biological pigment, which is produced by melanocytes. Melanin is a main factor in determining skin colour which protects human skin from the hazardous effects of ultraviolet (UV) sun radiation. Over synthesis of melanin is called hyperpigmentation [Citation1]. Treatment of hyperpigmentation has always been challenging and discouraging for most people, especially women [Citation2]. Kojic acid (KA) is a natural bleaching agent and a well-known tyrosinase inhibitor with hydrophilic character which is used to treat hyperpigmentation. KA inactivates the tyrosinase enzyme and suppresses the tautomerization of dopachrome by chelating copper atoms. It is synthesized by several fungal species such as the Aspergillus and Penicillum [Citation3]. Despite the unique properties of KA and its derivatives, their use is very limited in the cosmetic industries. KA is a hydrophilic ingredient due to the presence of two hydroxyl functional groups in its chemical structure and because of its hydrophilic nature. It has inadequate absorption from the skin [Citation4].
New carrier systems consisting of “solid lipid nanoparticles” (SLN) and “oil-loaded SLN” or “nanostructured lipid carriers” (NLC) have attracted increasing attention for the use in topical cosmetic. NLCs have been formulated to remove SLNs limitations by Müller et al. at the end of the 1990s. New carrier systems consisting of NLCs contain liquid lipids (fatty acids) that reduce the complete crystallization process or re-crystallization [Citation3,Citation5].
In this study, to overcome the limitations of traditional KA products, KA-NLCs were prepared using high-speed homogenization followed by ultra-probe sonication method. The properties of KA-NLCs were also investigated by the important determining factors in drug encapsulation such as the critical role of surfactant composition, solid/liquid lipid ratios and drug/lipid ratios. Percutaneous absorption and skin penetration pattern of KA-NLCs through human, rat and artificial skins were evaluated to explore the potential use of KA-NLCs in topical formulations.
Materials and methods
Materials
KA, palmitic acid (PA) and oleic acid (OA) were obtained from Sigma-Aldrich and Span 80, tween 20, cholesterol (Chol) and stearic acid (SA) were procured from Merck (Merck Co., Germany). Span 60 was purchased from Daejung (Daejung Chemicals & Metals Co., Ltd. Korea). Beeswax (BW) was supplied from John’s Laboratory (John’s laboratory chemicals, India). Glyceryl monostearate (GMS) was purchased by Gattefossé (France). Distilled water was purified using a Human power 2 system (human Co., Korea). Mushroom tyrosinase (EC1.14.18.1), L-3,4-dihydroxyphenylalanine (L-DOPA) were from Sigma Chemical Co. (St. Louis, MO).
Preparation of KA-NLCs
Probe sonication method was used for the preparation of KA-NLCs. Briefly, lipid phase containing GMS and Cho as a solid lipid, OA as a liquid lipid and Span® 60 as a lipophilic surfactant were melted together at 95 °C. The aqueous phase containing deionized water and Tween®20 as a hydrophilic surfactant were homogenized using a high-shear homogeniser (D-91126 Schwabach, Heidolph, Germany) and then was heated to 95 °C and one-third of the aqueous phase subjected in an ice-water bath. Then two-third of the aqueous phase containing KA added dropwise to the lipid phase and it was immediately subjected to sonication using a probe sonicator (Bandelin, 3100, Germany) for 5 min (100% amplitude). After this stage, one-third of the cooled aqueous phase was added into the mixture to produce a pre-emulsion and it was placed in an ice-water bath. The mixture sonicated for 5 min and allowed to cool to room temperature (22 °C) finally.
Determination of physicochemical characterization
Particle size and zeta potential
A dynamic light scattering (DLS) analyser (Nano ZS, Malvern Instruments, UK) has been utilised to determine zeta potential (ZP), the mean particle size, polydispersity index (PDI) of KA-NLCs. In this technique, formulations of KA-NLCs were analyzed with a laser Doppler velocimetry at 25 °C and a 90° detector angle and the concentrations of KA-NLC formulations were optimum [kilo counts per second (KCPS) of 20–400 for each analysis, the intensity of diffraction 100,000 counts per second] to determine mean particle size, PDI and ZP. Each formulation was tested three times and the samples were analyzed and the outcomes were ultimately described as mean ± SD ().
Table 1. Formulation composition and characteristics of investigated KA-NLC dispersion (% w/w).
Entrapment efficiency (EE)
To determine % entrapment efficacy (EE%), the supernatants from NLCs were separated by centrifuging (Sigma 3-30KS, Germany) for 120 min at 27,000 rpm and 4 °C. The supernatants were filtered using a syringe filter (pore size: 0.45 μm). The amount of un-encapsulated KA (free KA) in separated supernatant was determined using a UV-visible spectrophotometer (JASCO V-630) technique (λ max of KA: 268.5 nm). The test was repeated three times. EE and DL (drug loading) percentage values of KA-NLCs were calculated by the following equations, EquationEqs. (1)(1)
(1) and Equation(2)
(2)
(2) :
(1)
(1)
(2)
(2)
Where Winitial drug is total amount of KA added in the NLCs formulation and Wfree drug is the amount of KA (free KA) detected in separated supernatant after centrifugation of NLCs formulation.
Attenuated total reflectance-Fourier transform infra-red spectroscopy (ATR-FTIR)
NLCs containing KA were lyophilized in −80 °C for 24 h and then lyophilized in −50 °C and 0.1 mbar. In order to certify the encapsulation of KA in the NLC and the intermolecular interactions between the KA and NLC excipients, ATR-FTIR analysis was done using ATR-FTIR spectrophotometer (Agilent CARY 630 ATR-FTIR). Each sample was placed on the diamond ATR crystal and the obtained spectra of ATR-FTIR processed using Agilent resolutions pro-software. The ATR-FTIR spectra were recorded in the region of 3800–700 cm−1 (at a resolution of 4 cm−1, average of 32 scans).
Transmission electron microscope (TEM) analysis
TEM imaging method (912AB, Leo, England) was used to investigate the morphological observation and dispersion quality of the KA-NLCs within the matrix. A drop of freshly prepared KA-NLCs was placed on copper grids. To ensure the absence of agglomeration, samples were subjected to bath-sonicated before air drying. Surface samples of KA-NLCs were air-dried for 24 h and in this stage a drop of 1% aqueous solution of uranyl acetate was added on surface samples for contrast enhancement. TEM images of KA-NLCs were obtained after the samples were completely stained and dried at room temperature.
Differential scanning calorimetry (DSC) analysis
To evaluate drug loading in NLCs, DSC technique (Pyris 6, PerkinElmer, USA) was applied to analysis of the crystallinity degree of KA-NLC formulations. Prior to heating, about 5 mg of each sample were subjected to an aluminium oxide pan with an empty pan used as a reference. DSC was set at 20 to 300 °C temperature range by scanning rate of 20 °C/min under N2 flow.
Powder X-ray diffraction (PXRD)
The PXRD θ/2θ analysis was performed on the samples to identify crystalline structures of the samples using a Bruker D8 Advance X-ray diffractometer (Germany) (40 kV and 30 mA). Diffractograms were performed from the initial angle 2θ = 1° to the final angle 2θ = 100°. A Cu Kα radiation (λ = 0.2 nm) was used for samples with a 0.04° step size and 1 s step time.
Drug release
A standard curve for the analysis of released KA was drawn before evaluating KA-NLCs release. The analyses of standard curve were performed at three consecutive days with three repetitions per day. Interday and intraday studies are important for accuracy and reliability. Accuracy of method was determined based on the relative standard deviation (RSD) from the obtained data of the repeatability (intraday precision) and intermediate precision (interday precision). The analytical method is performed by UV spectrophotometric and it was found to be linear at the desired concentrations. Correlation coefficients (r2) was found to be 0.998. The equation for the standard curve was y = 0.0577x − 0.0004. Where Y is absorbance, 0.0577 is slope, X is concentration (Con) (μg/ml) and 0.0004 is intercept. Using this equation, the concentration of released KA (μg/ml) is obtained. ARKA as amount of released KA (mg) and % drug release are calculated by the following equations, EquationEquations (3)(3)
(3) and Equation(4)
(4)
(4) :
(3)
(3)
(4)
(4)
Where DF and V (ml) are dilution factor and volume of dissolution medium, respectively.
In vitro release kinetics of KA-NLC3 were evaluated by the dialysis membrane. The release studies were done in phosphate buffer as the dissolution medium with pH 7.4 (receptor compartment). The KA-NLC3 formulation placed in a dialysis membrane and sealed at both ends. Then the dialysis membrane containing KA-NLC3 as donor compartment, was immersed in the receptor compartment (containing 900 ml of the dissolution medium) and it was stirred at 100 rpm and maintained at 37 ± 2 °C. About 5 ml aliquots were withdrawn at predetermined time intervals (0.5, 1, 2, 4, 6, 8 and 24 h) and replaced with fresh media of similar volume. The amount of KA released in the dissolution medium was determined by UV-visible spectrophotometer (JASCO V-630) method (λ max of KA: 268.5 nm).
Determination of mushroom tyrosinase activity
Mushroom tyrosinase inhibitory activity was evaluated using L-DOPA as substrate and the formation of dopachrome was observed at 475 nm. The nanoparticles precipitated and unloaded KA was extracted by washing with deionised water (for three times). All test samples were first dispersed in phosphate buffer (pH 7.4) at 10 µg/ml and diluted to the required concentrations (KA-NLC3: 10, 5, 2.5, 2, 1, 0.5, 0.25 µg/ml and KA: 100, 50, 25, 10, 5 µg/ml). First, 10 µL of tyrosinase (0.5 mg/mL) were mixed with 160 µL of 50 mM phosphate buffer (pH 7.4) and then 10 µL of the test sample were added to 96-well microplates. After pre-incubation at 28 °C for 20 min, 20 µL of L-DOPA solution (0.5 mM) were added to the phosphate buffer and KA was used as the positive control. Each assay was conducted as three separate replicates. The inhibitory effects of the tested compounds were expressed as the concentrations that inhibited 50% of the enzyme activity (IC50). The percentage inhibition was calculated according to the following equation:
(5)
(5)
Where, Abs control is the absorbance of control and Abs compound is the absorbance of the compound.
Ex vivo and in vitro skin permeation/penetration study
Dermal study was evaluated via human and rat skin specimens as ex vivo skin models and artificial membrane as in vitro skin model. The human skin samples from cosmetic surgery obtained from the abdominal region of a young female in Sari Pars Clinic Surgery Centre. Written informed consent was obtained from the patient. Rat skin studies investigated through male Wistar rats (1.5 month) with weighing 200–250 g. The ethics committee of Mazandaran University of Medical Sciences approved skin permeation/penetration studies of the ex vivo human and animal models (IR.MAZUMS.REC.96-10322). Also, in vitro skin penetration study was done using the artificial membrane, Strat-M™ (STM; artificial skin), that was purchased from Merck (Merck Co., Germany).
The HEM, rat skins and STM were mounted on the Franz-type permeation cells (HDT6, Erweka, Germany) and 3 ml of dispersion containing optimum formulation of KA-NLCs or KA solution (as control) were placed on the surface of skins or membrane in the donor compartment (n = 3). About 33 ml of phosphate buffer solution (PBS, pH 7.4 and 37 ± 0.5 °C) were used as the receptor medium (stirred with Teflon coated magnetic stirring bars at 600 rpm).
The skin surface temperature was maintained at 37 °C to approximate normal skin conditions by thermostatic water pump during the experiment. The samples (approximately 5 ml) of receptor medium were withdrawn at pre-determined time intervals (1, 2, 3, 4, 6, 8, 12 and 24 h) and then immediately replaced with an equal volume of medium heated to 37 °C. The permeated KA was determined in samples using a spectrophotometer analysis at 268 nm.
After 24 h, the skin fragments were removed from the diffusion Franz cells for evaluation of drug remaining in skin samples. The remaining substances of skin surface were removed via three times washing with PBS, pH 7.4. The samples sliced into small segments in a buffer solution and were sonicated for 1 h using a bath sonicator. The obtained supernatants from this stage were filtered by 0.2 μm membrane. At the end of the experiment, the amounts of drug remaining in the skin were quantified using a spectrophotometer analysis at 268 nm. Each set of experiments was done in three permeation cells and tests were repeated three times.
Stability studies
KA-NLC3 as selected formulation was subjected in Eppendorf tubes and stored at two different temperature conditions at 4–8 °C and at room temperature (RT) for a period of 3 months. The physical stability of KA-NLC3 was monitored after 3 months and compared with the initial data. Findings were done in triplicate and results expressed as average values ± SD.
In vitro biocompatibility study using HFF-1 (ATCC® SCRC-1041™) cells
MTT assay was performed to evaluate the cell viability by the MTT solution of 3-(4,5-dimethylthiazol2yl)2,5-diphenyltetrazolium bromide. Concisely, HFF-1 cells (1 × 10⁴ cells per well) were seeded into 96-well plates (SPL Life Sciences, South Korea) and allowed the cells to adhere completely to the plate during 24 h. Then, 100 µl of different concentrations of KA (as the positive control) (62.5, 125, 250, 500, 1000, 2000 mg/mL) and KA-NLC3 (62.5, 125, 250, 500, 1000, 2000 mg/mL) were added to the wells in eight replicates, and the plates were remained intact for 24, 48 and 72 h.
After passing 24, 48 and 72 h, the medium was removed and 100 μl of MTT solution (0.05 mg/well) was added to the plates in the dark conditions and the plates were incubated at 37 °C for 4 h. Then, the supernatant of the wells was removed with a sampler, and 100 μl of dimethyl sulfoxide (DMSO, Merck, Germany) were added to the wells and then placed on the shaker for 20 min (at this stage, it should be covered in a container to avoid exposure to light). Where, KA was used as the positive control. Finally, the resulting colour intensity was read by a microplate reader (DNM-9602G) at 570 nm. Finally, the absorbance spectrum of MTT formazan solution (the purple formazan crystals in DMSO) was measured at a wavelength of 570 nm using a microplate reader (Bio-Rad, Hercules, CA, USA). Where control cells are untreated cells. The results were demonstrated as mean ± SD of eight replicates (n = 8). The cell viability was evaluated using the following equation:
(6)
(6)
Statistical analysis
Results of study were expressed as mean ± SD of at least three determinations (n = 3) and analysed using one-way analysis of variance (ANOVA) and one sample t-test. The data followed by Tuckey–Kramer multiple comparison post-tests (using the SPSS 2021 software) and a value of p value < 0.05 was considered as the minimal level of significance.
Results and discussion
Ka-NLC characteristics (size, PDI, ZP and entrapment efficiency) analysis
Ultra-probe sonication method was employed for the preparation of KA-NLCs using high-speed homogenisation for improve its effectiveness. Pre-formulation studies were carried out. The final goal of pre-formulation studies was to obtain maximum EE% in KA-NLCs with suitable characteristics. Different formulations containing several lipid excipients such as OA, Chol, BW, GMS, SA, PA were evaluated. In this study, span 60, span 80 and tween 20 were selected as surfactants and the amounts of lipid excipients, KA and surfactants were kept constant (data were not shown).
Results of previous investigations were shown that the presence of Chol and Span 60 as co-emulsifier in the lipid matrix of lipid nanoparticles decreased the particle size and the crystallinity of the lipid phase and increased drug encapsulation. Also, it was found that the presence of very high amounts of Chol in the lipid matrix of lipid nanoparticles has no significant effect on drug entrapment [Citation4].
Preliminary studies on pre-formulations showed that temperature, sonication time, speed and time of stirrer, frequency of probe sonicator homogenization cycles had affected on the mean particle size, PDI, ZP, EE% of the NLCs. The aggregate particle size decreased significantly by high-speed stirring (from 3000 to 8000 rpm) for 10 min because of kinetic energy and high shear. Also, it resulted fairly small particles of KA-NLCs by increasing ultrasound intensity and number of cycles at 100% amplitude for two 5 min cycles compared to 30, 50, 75, and 90% amplitude.
Formulations with different liquid lipid: solid lipid ratios were tested; and of these, a weight ratio 1:3 of OA in solid lipid matrix (GMS and Chol) exhibited excellent stability. Thus, mixtures of OA/solid lipid matrix (ratios of 1/3) were investigated at 25 °C for 1 month. Aggregation of particles was observed in KA-NLCs prepared with BW, SA and PA. The KA-NLCs prepared with OA, GMS and Chol were stable, whereas the BW, SA and PA indicated sedimentation (data were not shown). Therefore, the mixture of OA, GMS and Chol were selected for the formulation with a ratio of 1/3 of OA/(GMS and Chol) matrix ().
Lipid matrix of KA-NLC3 formulation containing OA, GMS and Chol showed a decrease in particle size, PDI and an increase in EE% and ZP compared to lipid matrix of Chol and others lipids such as BW, SA and PA. The characteristics of investigated KA-NLCs are presented in . In another study of NLCs, Fathi et al. [Citation6] demonstrated that formulations containing GMS had smaller size, narrower size distribution and higher entrapment of drug in comparison to SLN formulations.
Transmission electron microscopy (TEM)
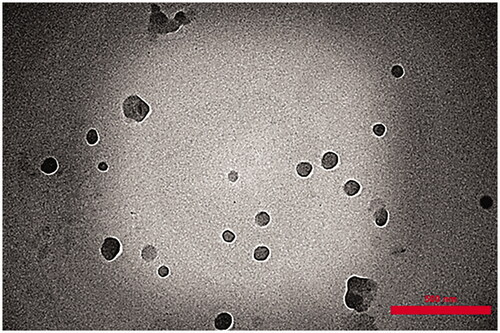
The morphology of freshly prepared KA-NLC3 was observed under TEM (). TEM analysis confirmed that the NLCs had the colloidal particle size and were approximately spherical and uniform in shape and well dispersed and separated on the surface. TEM image demonstrated that mixture of SP 60 and lipid matrix (OA, GMS and Chol) had developed stable KA-NLC3
Figure 1. TEM micrographs of KA-NLC3 dispersion.
Attenuated total reflectance-Fourier transform infra-red spectroscopy (ATR-FTIR)
ATR-FTIR technique is an important and efficient method for the quick assess of encapsulated active ingredient (drug) and investigating the existence of chemical interaction between drug and formulation components during the preparation process of the drug-NLCs [Citation7]. represents the ATR-FTIR spectra of pure KA, OA, Chol, GMS, and physical mixture with the same ingredients and KA-NLC3. In the ATR-FTIR spectrum of KA-NLC3, characteristic peaks related to C=O and C=C groups of KA were still recognisable, which were an indirect confirmation of good drug encapsulation in KA-NLC3 formulation. On the basis of ATR-FTIR studies of physical mixture and KA-NLC3 formulation, it represented that there was no shift in characteristic peaks due to C=O and C=C stretching vibrations of KA. The results proved that there was no chemical interaction between KA and other formulation ingredients. The results of ATR-FTIR analyses of pure KA, Chol, GMS and OA were summarised as follows:
Figure 2. The ATR-FTIR spectra of KA, Chol, GMS, OA, physical mixture, and KA-NLC3 dispersion.
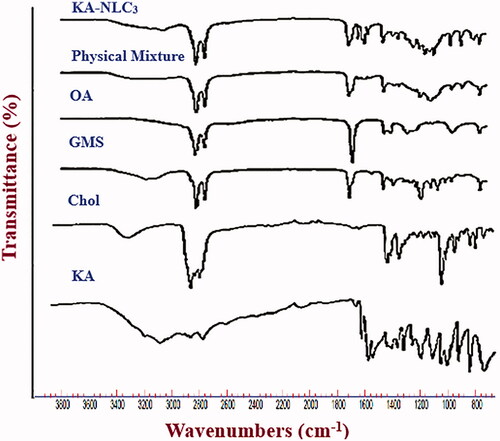
KA: 3263 and 3144 cm−1 (O–H stretching vibrations), 2925 and 2833 cm−1 (aliphatic C–H stretching vibrations), 1656 cm−1 (C=O stretching of ring), 1607 cm−1 (C=C stretching) and 1069 cm−1 (C–O stretching of ring).
Chol: 3402 cm−1 (O–H stretching), 3000–2850 cm−1 (C–H of CH2 and CH3 groups, asymmetric and symmetric stretching vibrations), 1463–1457 cm−1 (C–H bending) and 1054 cm−1 (C–O stretching).
GMS: 3400–3200 cm−1 (O–H stretching), 3000–2850 cm−1 (C–H stretching), 1730 cm−1 (C=O stretching) and 1300–1000 cm−1 (C–O stretching).
OA: 3006 cm−1 (C–H of C=C–H stretching), 2923 cm−1 (C–H asymmetric stretching), 2854 cm−1 (C–H symmetric stretching), 2670 cm−1 (O–H stretching), 1707 cm−1 (C=O stretching), and 1284 cm−1 (C–O stretching).
Differential scanning calorimetry (DSC) and XRD
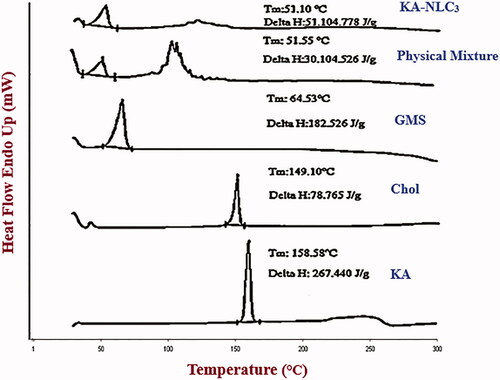
DSC analysis was used to characterize the enthalpy changes and melting temperature and recrystallization behaviour, unloaded and loaded nanoparticles [Citation4]. DSC thermograms of the pure KA, Chol, GMS, the physical mixture and KA-NLC3 powder are shown in . The DSC thermograms of Chol, GMS and KA exhibited a single sharp endothermic peak at about 149.1 °C, 64.5 and 158.6 °C, respectively, which confirms the extreme crystalline nature of them. Thermal analysis of physical mixture by DSC indicated endothermic peak at 51.6 °C. Also, lyophilized powder of KA-NLC3 had a wide peak at 51.1 °C. The melting endotherm of the KA at 158.6 °C was completely absent in the thermograms of KA-NLC3 structure, which demonstrates that KA is entrapped in NLC matrix amorphously and in a high amount.
Figure 3. DSC thermograms obtained for KA, Chol, GMS, physical mixtures, and KA-NLC3 dispersion.
X-ray diffraction (XDR) was used to determine the crystallinity and polymorphic behaviour of the lipid nanocarries and complement the DSC analysis [Citation4]. By XRD, the patterns of the pure KA, GMS, Chol, the physical mixture and freeze-dried powder of KA-NLC3 were recorded, as shown in . In the XRD refractogram of KA, significant diffraction peaks were detected at 2θ of 14.2°, 19.2°, 22.0°, 25.4°, 27.6°, 31.0°, 36.2°, 37.4°, and 39.9° that this represents the crystalline nature of KA. Intense diffraction peaks appeared for Cho at 2θ: 5.1235°, 6.226°, 6.9°, 7.6°, 9.4°, 10.4°, 11.2°, 11.6°, 12.7°, 13.9°, 15.3°, 16.8°, 17.3°, 18.0°, 18.7°, 19.2°, 20.93°, 23.4°, and 25.2°.
Figure 4. XRD of KA, Chol, GMS, physical mixtures, and KA-NLC3 dispersion.
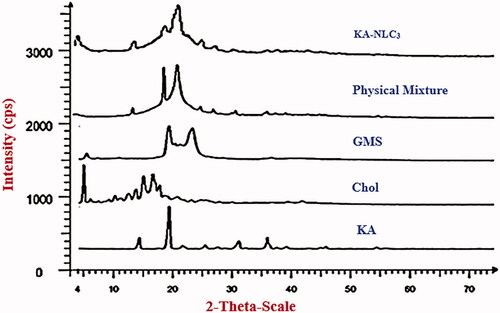
GMS showed a crystalline diffractogram with sharp peaks at 2θ: 5.4°, 19.3°, 20.3°, 21.4°, 22.7°, 23.2°, and 36.6°. The sharp and distinct peaks were obtained from KA, Cho and GMS, evidencing the high degree of crystallinity. The PXRD pattern of physical mixture exhibited the characteristic peaks at 14.2°, 19.3°, 21.5°, 25.2°, 27.4°, 30.4°, 31.0°, 35.7°, and 36.1°. In addition, the characteristic peaks of KA-NLC3 showed diffraction peaks at 4.9°, 14.1°, 19.1°, 20.8°, 21.4°, and 25.1°.
As observed in , lipid peaks and KA were not seen or were reduced in intensity in the XRD diffractograms of KA-NLC3 as compared to pure lipids and KA. These results confirmed that KA and lipids were transformed from a crystalline state to an amorphous form in the KA-NLC3. Results of XRD, ATR-FTIR and DSC patterns confirmed the presence of KA as an amorphous state in KA-NLC3 with a good entrapment in lipid matrix without any chemical interaction between KA and other formulation components.
Drug release
In vitro release studies on the release rate of encapsulated KA from NLC3 and pure KA were done for 24 h at 37 °C using the method mentioned above (). Obtained data of diffusion-controlled release showed that up to 0.8% ± 0.2 of KA from NLC3 were released over the initial assay stages (the first 30 min) followed by sustained release pattern and reached 15.6 ± 0.8% after 24 h. These results can be described by important factors including mechanisms of controlled drug release and diffusion from the lipid core matrix of the NLC3 to dissolution environment. KA release rate from NLC3 was significantly slower than KA solution (p<.0001).
Figure 5. Dissolution profile of KA solution and KA-NLC3 dispersion.
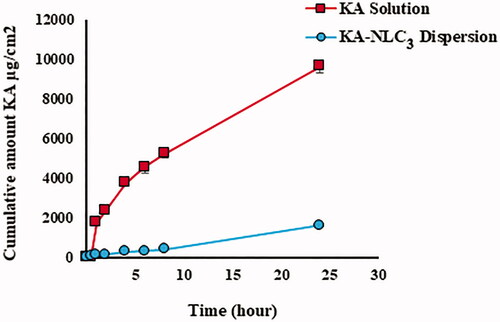
Obtained results from in vitro release studies showed that the release rate of KA-NLC3 compared with pure KA has the slower and controlled release behaviour during 24 h. Data release demonstrated that the NLC3 formulation released KA in a controlled pattern. This behaviour can be related to the loaded KA into the lipid matrix and KA-enriched lipid core that it can slow down the drug release rate. Similarly, efficacy and bioavailability of lidocaine, clobetasol were enhanced when formulated as NLCs where release behaviour of formulations improved with the sustained release in drug delivery [Citation8].
In vitro tyrosinase inhibition activity
The aim of this test was to evaluate the tyrosinase inhibitory activity of KA-NLC3 against mushroom tyrosinase. KA, as a well-known tyrosinase inhibitor, used as a positive control to inhibit of tyrosinase activity [Citation3].
The results of this study demonstrated that KA-NLC3 and KA solution inhibited the activity of tyrosinase mushroom in a concentration-dependent manner. shows that in KA solution, the maximum enzyme inhibition was 92% at 100 μg/ml and this effect was similar in solutions containing more than 100 µg/ml KA. But these results () show that the enzyme inhibition enhances with increasing nanoparticle concentration. This profile shows a sustained action of enzyme inhibition in KA-NLC3 between 0.25 and 10 µg/ml concentrations of nanoparticles. The release profile of KA from NLC3 () can explain this pattern (the maximum percentage of enzyme inhibition was 86% at 10 μg/ml). Evaluation of these data () indicated enzyme inhibition effect in both solution and NLCs of KA; also, a concentration-dependent behaviour and sustained action of enzyme inhibition were observed in KA-NLC3 due to the slow release of the drug from lipid nanoparticles.
Figure 6. Curves of tyrosinase mushroom activity of KA solution and KA-NLC3 dispersion. (A) The concentrations of KA were 100, 50, 25, 10, 5 µg/ml and (B) the concentrations of KA-NLC3 dispersion were 10, 5, 2.5, 2,1, 0.5, and 0.25 µg/ml. IC50 values were calculated by nonlinear regression using Graph Pad Prism 5.0.
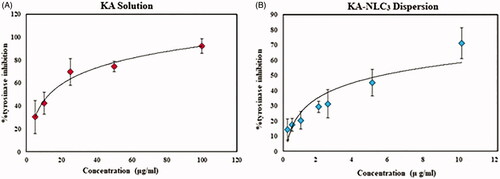
The KA-NLC3 showed potent inhibitory activity against tyrosinase (IC50 value of 5.4 ± 0.1 µg/ml) as compared with that of pure KA (positive control) (IC50 value of 18.3 ± 0.1 μg/ml) (). These results indicate that KA loading into NLCs could potentially increase the process of tyrosinase inhibitory which could be promising for cosmetic use as an excellent skin bleaching agent.
Ex vivo and in vitro percutaneous absorption study
In this study, ex vivo and in vitro permeation experiments (transdermal delivery) as a function of time were carried out in order to determine the permeation profile of KA-NLC3 and KA solution. shows the cumulative amounts of permeated KA (transdermal delivery) from KA-NLC3 after 24 h permeation through rat, HEM and artificial skins which are 351.7, 308.0 and 45.5 μg/cm2, respectively. Also according to the data obtained from , the cumulative amounts of permeated KA from KA solution through rat, HEM and artificial skins were 168.7, 156.6 and 21.7 μg/cm2, respectively. By comparing these values, it can conclude that permeated drug amount from KA-NLC3 was significantly more than the KA solution at 24 h. These results demonstrated that the highest diffusion of drug from KA-NLC3 formulation was obtained for rat membrane model compared to HEM and artificial membranes, respectively.
Figure 7. Ex vivo and in vitro permeation profiles of KA-NLC3 dispersion and KA solution across human, rat and synthetic skins. Data are presented as mean and standard deviation of three determinations (n = 3).
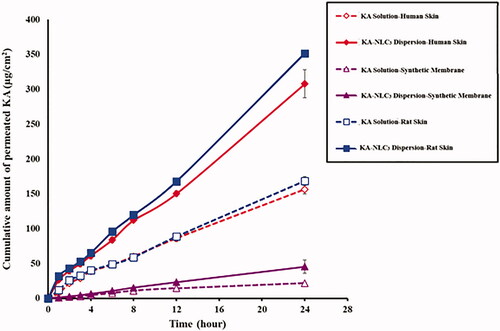
According to these results, it seems that the presence of substances such as surfactants (as chemical permeation enhancers) and the use of lipid matrix containing OA, Cho and GMS in the KA-NLC3 caused better permeation than the KA solution. Consequently, it can be concluded that drug permeation of KA-NLC3 was significantly faster compared with KA solution. Results of the studies indicated that KA-SLNs and KA-loaded emulsion increased skin permeation and accumulation [Citation4,Citation9].
The amount of permeated drug to receptor compartment for KA solution was lesser than KA-NLC3 formulation in all of membranes’ model (p<.001). A significant and strong correlation was found for the KA-NLC3 with more percutaneous penetration across rat and HEM and STM membranes too (p<.001).
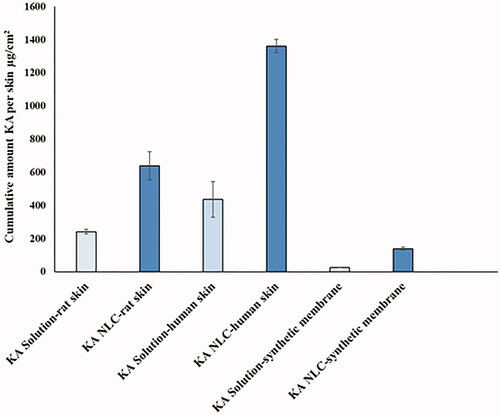
In second stage, the amount of KA remaining in dermal and artificial membranes was evaluated. Results showed that the amount of accumulated KA from KA-NLC3 was much higher (HEM > rat > artificial membranes, respectively) in comparison with KA solution (). With an excellent dermal profile obtained from this investigation, it suggests that KA-NLC3 can be used as promising carrier for the treatment of skin disorders such as photoaging, hyperpigmentation, etc.
Figure 8. Cumulative amount of KA in the membrane layers, including rat skin, HEM and synthetic membrane.
Many studies showed that NLCs compared to SLNs could provide higher drug accumulation and dermal penetration in SC [Citation10], because NLCs have irregular crystal structure, which can provide higher drug loading capacity by preventing drug expulsion [Citation11].
Stability studies
According to , KA-NLC3 indicated no significant change in particle size, PDI, ZP and EE% and physical appearance such as precipitate and aggregation of particles which indicate the good physical stability of KA-NLC3. Therefore, KA-NLC3 was considered as the best formulation with enough colloidal stability.
Table 2. Stability information of the KA-NLC3 dispersion after 3 months of storage.
In vitro biocompatibility
When HFF-1 cells were treated with various concentrations of KA (as the positive control) for 24, 48, and 72 h, obvious cell death did not induce in HFF-1 cells (cell viability was about >90%), as shown in . Dramatic cytotoxicity activities were only observed at higher KA concentrations (p<.001).
Figure 9. Viability of normal human skin fibroblast cells (HFF-1) (MTT assay) after 24, 48, and 72 h exposure to (a) KA solution for 24, 48, and 72 h, (b) NLC-drug (KA) and NLC + drug (KA) for 24 h, (c) NLC-drug (KA) and NLC + drug (KA) for 48 h, (d) NLC-drug (KA) and NLC + drug (KA) for 72 h. Data represented as the means ± SD of eight identical experiments. ***p<.001 expression in the formulations treated cells versus the untreated cells.
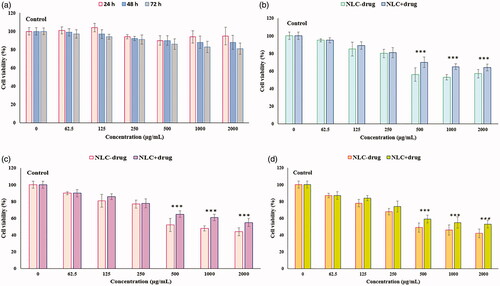
After HFF-1 cells were treated with different concentrations of NLC-drug (KA) and NLC + drug (KA) at 24, 48 and 72 h, it showed the concentration-dependent toxicity in the HFF-1 cells and moderately cytotoxicity effects were observed at concentrations up to 250 μg/mL. Also, the results of these test demonstrated that approximately 80% of the cells (at concentrations below 250 μg/mL) were viable at 24, 48, and 72 h, as shown in ). No significant differences were indicated in cell cytotoxicity results between NLC-drug (KA) or KA-free NLC3 and NLC + drug (KA) or (KA-NLC3). Therefore, concentrations below 250 μg/mL were determined as suitable KA concentrations for NLC + drug (KA) and this formulation is biocompatible for the aims of the cosmetics.
Conclusion
This research showed that KA was well encapsulated in NLC formulation in an amorphous state and there was no significant interaction between the drug and other formulation ingredients. With an excellent dermal profile obtained from this investigation, KA-NLC3 can be used as promising carriers for the treatment of skin disorders such as photoaging, hyperpigmentation, etc. These nanoparticles showed that the NLCs released KA in a prolonged and controlled behaviour and could significantly improve therapeutic effects of KA. The results of studies related to the antioxidant test showed that KA-NLC3 had stronger antioxidant activities than KA. Concentrations below 250 μg/mL were determined as suitable KA concentrations for KA-NLC3. According to the wonderful advantages of the NLC carriers, these nanoparticles can be considered as a novel delivery system for skin use in the pharmaceutical and cosmetic fields.
Acknowledgments
The authors also would wish to express their sincere and special appreciation to Dr. Mehdi Khalili and their team in Pars Clinic Surgery Center, Sari, Iran, for their valuable and technical cooperation.
Disclosure statement
No potential conflict of interest was reported by the author(s).
Additional information
Funding
References
- Kang M, Park S-H, Oh SW, et al. Anti-melanogenic effects of resorcinol are mediated by suppression of cAMP signaling and activation of p38 MAPK signaling. Biosci Biotechnol Biochem. 2018;82(7):1188–1196.
- Nicolaidou E, Katsambas AD. Pigmentation disorders: hyperpigmentation and hypopigmentation. Clin Dermatol. 2014;32(1):66–72.
- Saeedi M, Eslamifar M, Khezri K. Kojic acid applications in cosmetic and pharmaceutical preparations. Biomed Pharmacother. 2019;110:582–593.
- Khezri K, Saeedi M, Morteza-Semnani K, et al. An emerging technology in lipid research for targeting hydrophilic drugs to the skin in the treatment of hyperpigmentation disorders: kojic acid-solid lipid nanoparticles. Artif Cells Nanomed Biotechnol. 2020;48(1):841–853.
- Pardeike J, Hommoss A, Müller RH. Lipid nanoparticles (SLN, NLC) in cosmetic and pharmaceutical dermal products. Int J Pharm. 2009;366(1–2):170–184.
- Fathi M, Varshosaz J, Mohebbi M, et al. Hesperetin-loaded solid lipid nanoparticles and nanostructure lipid carriers for food fortification: preparation, characterization, and modeling. Food Bioprocess Technol. 2013;6(6):1464–1475.
- Karimi N, Ghanbarzadeh B, Hamishehkar H, et al. Antioxidant, antimicrobial and physicochemical properties of turmeric extract-loaded nanostructured lipid carrier (NLC). Colloid Interface Sci Commun. 2018;22:18–24.
- Salvi VR, Pawar P. Nanostructured lipid carriers (NLC) system: a novel drug targeting carrier. J Drug Delivery Sci Technol. 2019;51:255–267.
- Ephrem E, Elaissari H, Greige-Gerges H. Improvement of skin whitening agents efficiency through encapsulation: current state of knowledge. Int J Pharm. 2017;526(1–2):50–68.
- Agrawal U, Gupta M, Vyas S. Capsaicin delivery into the skin with lipidic nanoparticles for the treatment of psoriasis. Artif Cells Nanomed Biotechnol. 2015;43(1):33–39.
- Ghasemiyeh P, Azadi A, Daneshamouz S, et al. Cyproterone acetate-loaded nanostructured lipid carriers: effect of particle size on skin penetration and follicular targeting. Pharm Dev Technol. 2019;24(7):812–823.