
Abstract
Osteoarthritis (OA) is a degenerative disease closely associated with Anoikis. The objective of this work was to discover novel transcriptome-based anoikis-related biomarkers and pathways for OA progression.The microarray datasets GSE114007 and GSE89408 were downloaded using the Gene Expression Omnibus (GEO) database. A collection of genes linked to anoikis has been collected from the GeneCards database. The intersection genes of the differential anoikis-related genes (DEARGs) were identified using a Venn diagram. Infiltration analyses were used to identify and study the differentially expressed genes (DEGs). Anoikis clustering was used to identify the DEGs. By using gene clustering, two OA subgroups were formed using the DEGs. GSE152805 was used to analyse OA cartilage on a single cell level. 10 DEARGs were identified by lasso analysis, and two Anoikis subtypes were constructed. MEgreen module was found in disease WGCNA analysis, and MEturquoise module was most significant in gene clusters WGCNA. The XGB, SVM, RF, and GLM models identified five hub genes (CDH2, SHCBP1, SCG2, C10orf10, P FKFB3), and the diagnostic model built using these five genes performed well in the training and validation cohorts. analysing single-cell RNA sequencing data from GSE152805, including 25,852 cells of 6 OA cartilage.
Introduction
Osteoarthritis (OA) is a degenerative inflammatory joint disease and a leading cause of disability, characterized by joint pain and stiffness, especially after prolonged activity [Citation1]. In 2021, more than 22% of people over 40 will suffer from OA, and it is estimated that more than 500 million people worldwide will suffer from OA [Citation2]. The continuous increase in life expectancy causes more people to suffer from osteoarthritis [Citation3]. At present, the treatment of osteoarthritis includes not only appropriate joint functional exercise and a healthy diet, but also oral drug therapy, intra-articular injection, and surgical treatment [Citation4]. Intra-articular injection mainly includes local administration of sodium hyaluronate, growth factors, and glucocorticoids such as dexamethasone (DEX) [Citation5–7]. However, it is still unclear whether the pathogenesis of osteoarthritis is caused by a combination of factors [Citation8,Citation9], such as joint injury, genetic, and metabolic factors [Citation10]. Apoptosis is one of the mechanisms by which chondrocytes die, which has been proven to be involved in OA progression [Citation11,Citation12]. Anoikis is a form of programmed apoptosis that is caused when the extracellular matrix (ECM) is lost or when there is a disruption between the cell and ECM [Citation13,Citation14]. Several studies have reported that anoikis may be triggered by some signals, including DNA damage and endoplasmic reticulum stress [Citation15,Citation16]. There is related study has showed that the mechanism was explored by cell adhesion molecules, growth factors and inducing epithelia-mesenchymal transitions through regulating anoikis resistance [Citation13]. A related study showed that the mechanism was explored by cell adhesion molecules, growth factors, and inducing epithelia-mesenchymal transitions through regulating anoikis resistance [Citation13]. These pathways, including the focal adhesion kinase, mitogen-activated protein kinase (MAPK), ERK1/2, and Bcl-2 family, have been proven to play an important role in anti-apoptosis [Citation17–19]. Recently, the accumulation and adhesion of M1 macrophages into synovium tissues in the joint microenvironment were reported in OA patients [Citation20]. It is reported that several adhesion molecules play an important role during OA development by regulating the infiltration and migration of macrophages and monocytes, and the expression of vascular cell adhesion molecule 1 (VCAM-1) was higher in OA synovium [Citation21,Citation22]. Intercellular adhesion molecule-1 (ICAM-1) is an adhesion molecule in the articular microenvironment for OA development [Citation23]. These results indicated the crucial role of cell adhesion in OA treatment. Anoikis, as an apoptosis, can prevent detached cells from migrating to other places for abnormal proliferation [Citation24]. However, little study is available on the role of anoikis in osteoarthritis. Therefore, identifying anoikis-related genes in OA and then exploring their mechanisms are very meaningful for the treatment of OA. Therefore, this study aims to focus on exploring the expression levels of anoikis-related genes in the occurrence, progression, and treatment of OA, as well as exploring the key anoikis-related genes by means of machine learning and single-cell analysis.
Method
Data collection and processing
The datasets GSE114007, GSE89408, GSE55235, and GSE152805 were downloaded from the Gene Expression Omnibus (GEO) database (http://www.ncbi.nlm.nih.gov/geo/). And then, we merged the data using batch-to-batch variation, which was then eliminated by combining the GSE114007 and GSE89408 datasets into a single dataset using the combat function from the ‘sva’ R package [Citation25], which included 46 control samples and 42 OA samples for OA gene expression profiles. GSE55235 as a validation dataset. In order to eliminate data differences brought on by various GEO database platforms, the merged gene expression data for each sample were translated into log2 (x + 1). Using the limma R package [Citation26] and the combined OA data, differentially expressed genes were obtained (log2FC = 1, p value = .05). Furthermore, anoikis-related genes (ARGs) were downloaded from the GeneCard database [Citation27] (https://www.genecards.org/). 513 of the 801 aboikis-related genes that were retrieved from the database and chosen based on |correlation coefficient| > 0.4. The overlap of DEGs for OA and anoikis-related genes was displayed using the R package ‘VennDiagram’.
Consensus clustering analysis of anoikis-related genes
The ‘glmnet’ R software program performed through the LASSO method analysis to achieve the dataset reduction. By using 10-fold cross-validation, the ideal value of λ was found, with the log (λ) on the bottom x-axis, mean squared error on the y-axis, and the number of genes in the model on the top x-axis. DEGs were analysed to identify 10 DEARGs by lasso analysis. Based on 10 DEARGs, OA patients’ unsupervised clustering data were analysed with the ‘ConsensusClusterPlus’ R package [Citation28]. The ideal number of subtypes, k, was determined using the consensus matrix, consensus score, and cumulative distribution function (CDF) cure.
Differentially expressed gene analysis and immune-related analysis
To find differentially expressed genes (DEGs) between different clusters, the R package ‘Limma’ was employed. Anoikis subtype-associated DEGs were used to conduct the immune-related analysis, including GO, KEGG analysis, immune infiltration, immune checkpoint, and GSEA analysis. To investigate the changes in biological signalling pathways, the ‘c2.cp.kegg. v2022.1.Hs. symbols’ and ‘c5.go. v2022.1.Hs. symbols’ files were retrieved from the MSigDB database. To examine the different biological functions and pathways between anoikis-related subtypes, the R packages ‘GSVA’ and ‘Limma’ were utilized. 28 different immune cell types of relative infiltration levels were determined [Citation29]. Violin plots were drawn to demonstrate the differential expression levels of the 28 immune infiltrating cells. The barplot was used to display the proportion of immune cells in each group. Spearman correlations were calculated for 28 immune infiltrating cells with 10 ARDEGs, followed by visualization using the ‘ggplot2’ package.
Gene clustering and WGCNA analysis
The DEGs of anoikis-related subtypes were used to divide OA samples into two gene clusters. In order to affirm the optimal number of subgroups k, we constructed the consensus matrix, cumulative distribution function (CDF) cure, and consensus score. According to two gene clusters, a barplot, GSVA analysis, alluvial diagram, and comparison of immune cell infiltration and immune-related pathways were explored. According to gene clustering, weight gene co-expression network analysis (WGCNA) was performed to identify highly correlated gene modules in OA samples by gene subgroups [Citation30]. Meanwhile, we conducted the WGCNA analysis between normal and OA samples to confirm highly correlated gene modules in the merged dataset. The intersection of disease WGCNA and Anoikis-related gene WGCNA is to obtain the OA gene module significantly related to Anoikis. The goodSamplesGenes function was used to filter genes and samples. We calculated adjacency by using an appropriated soft-thresholding power β and achieved the scale-free topology. Then, hierarchical clustering and a dynamic cut function were used to obtain co-expression modules, with a minimum number of module genes was group size (n = 100). Finally, the expression profiles for each module were calculated using the module eigengene. The eigengene network was finally visualized.
Candidate diagnosis marker selection
One hundred fourteen intersection genes of disease WGCNA analysis and gene clusters WGCNA analysis was identified by machine learning. Four machine learning algorithms, including Extreme Gradient Boosting (XGB) [Citation31], the support vector machine recursive feature elimination (SVM-RFE) [Citation32], Random Forest (RF) [Citation33], and Generalized Linear Model (GLM) [Citation34], were used to screen hub genes for OA diagnosis. The SVM-RFE analysis was carried out using the ‘e1071’ software. We used the RF function in the ‘caret’ package to identify important genes using ten-fold cross validation, the ‘randomForest’ R package for RF. The boxplots of residual, the receiver operating characteristic (ROC) curve, and feature importance created for the GLM, RF, SVM, and XGB models were constructed to identify hub genes.
Validation and model construction of hub genes
The hub genes’ accuracy was validated using the GSE55235 dataset. The nomogram was created using hub genes and the rms package [Citation35]. The accuracy of the nomogram was verified by the calibration curve. Using decision curve analysis, we assessed the Nomo-clinical grade’s utility. A ROC curve was created to assess the hub genes’ diagnostic utility for the diagnosis of OA.
The construction of the ceRNA network and the correlation between hub genes and immune cells
TargetScan Human 7.2 (http://www.targetscan.org/vert_72/), miRDB (http://mirdb.org/), microT v5 (http://diana.imis.athena-innovation.gr/DianaTools/index.php?r=microT_CDS/index), and miRWalk 3.0 (http://mirwalk.umm.uni-heidelberg.de/) were used to predict the miRNAs [Citation36–39]. StarBase (v2.0) For the purpose of predicting miRNA-lncRNA interactions, StarBase (v2.0) (https://starbase.sysu.edu.cn/starbase2/index.php) was employed [Citation40]. The lncRNA-mRNA-miRNA regulatory network was then created and visualized using the Cytoscape software. The connection between hub genes and 28 types immune cells was investigated using the R packages ‘ggstatsplot’ and ‘ggplot2’.
Single cell analysis
The single-cell data (GSE152805) of OA cartilage that contained Six single-cell chondrocyte samples were selected from the GEO database and analysed it using the ‘Seurat’ and ‘CellChat’ packages [Citation41,Citation42]. We eliminated cells with a percentage of mitochondrial genes higher than 10%, and cells expressing less than 200 and greater than 6000 genes to retain high-quality data by removing low-quality cells. The cells with greater than 60,000 genes were obtained. Finally, 25,852 cells including 6 OA cartilages were identified. We normalized the gene expression of included cells with the ‘NormalizeData’ function, performed a principal component analysis (PCA) to extract the top 15 principal components (PC) based on the top 2000 highly variable genes, and retained these for further analysis by using ‘FindVariableFeatures’ function. To unsupervised and unbiased cluster, the cell subpopulations, ‘FindNeighbors’, ‘FindClusters’ (resolution = 0.5), and ‘RunTSNE’ functions were applied. There were related studies [Citation43–45] to report that Homeostatic chondrocytes (HomC) were related with MMP3, FOSB, and JUN. Hypertrophic chondrocyte (HTC) included COL10A1, IBSP, and JUN. pre-HTC was characterized by COL10A1, IBSP, and COL2A1. The hallmark genes of regulatory chondrocytes (RegC) were labelled with CHI3L1 and CHI3L2. The reparative chondrocytes (RepCs) included COL2A1, CILP, COL3A1, and COMP. FC were associated with COL1A1, COL1A2, S100A4, PRG4, and TMSB4X. pre-fibro chondrocytes (pre-FC) were annotated with IL11, COL2A1, CILP, and OGN. We used these genes to conduct cell type annotation, and further explore the trajectory inference.
Results
Expression landscape of anoikis-related genes
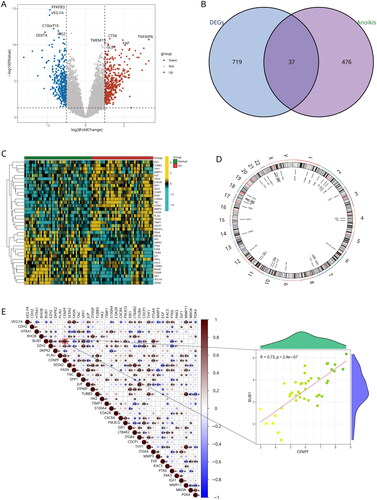
The flowchart of study in (). 756 DEGs were showed in Volcano plot between Normal and OA groups (). We identified 37 intersection genes in the Venn diagram between 756 DEGs and 513 anoikis-related genes (). Thirty-seven DEARGs were visualized in the heatmap, and the results showed that many genes were highly expressed in OA samples, including IGF1, TUBB3, THY1, MMPP11, EGF, CDH2, EDA2R, SPP1, EZH2, CENPF, BUB1, S100A4, TNC, HTRA1, MMP3, CXCR4, PLAU, ITGA4, TIMP1, CDCP1, and PIK3CG, while PDK4, MAOA, HK2, DAPK2, PTK6, FASN, ITGB4, JUP, PAK3, PAC3, LTB4R2, RHOB, and SIK1, VEGFA, AND SESN2 were expressed at low levels in OA samples (). At the same time, the chromosome positions of 37 DEARGs were visualized (). In order to investigate the interactions between these differentially expressed DEARGs, a correlation analysis was carried out, and the highly positive connection between CENPF and BUB1 was shown ((E)).
Figure 1. Study flow diagram. GEO: gene expression omnibus; DEG: differentially expressed gene; DEARGs: anoikid-related DEGs; GO: gene ontology; KEGG: Kyoto Encyclopaedia of Genes and Genomes; GSEA: gene set enrichment analysis; GSVA: gene set variation analysis; WGCNA: weighted gene co-expression network analysis; ROC: receiver operating characteristic.
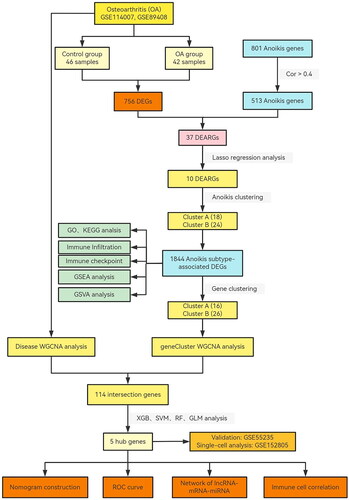
Figure 2. Landscape of anoikis in osteoarthritis. (A) Volcano plot showing the differential expression of OA between normal and OA samples. (B) Venn diagram showing the intersected genes of OS DEGs, anoikis genes. (C) Heatmap showing that the expression of 37 anoikis-related DEGs. (D) Circus plot of chromosome distributions of the 37 DEARGs. (E) Correlation analysis among 37 differentially expressed anoikis-related genes in OA patients. *p < .05, **p < .01, ***p < .001.
Identification of anoikis subtypes
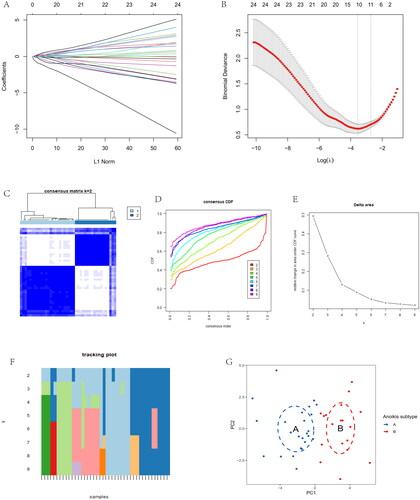
Lasso regression analysis was used to obtain 10 genes from 37 DEARGs as potential OA biomarkers (). We conducted unsupervised clustering to identify anoikis-related subtypes using a consensus clustering algorithm, based on the expression of 10 DEARGs. The value of k was set to 1–9, and the results showed that k = 2 was the best parameter for dividing 42 Oa samples into subtypes A and B based on 10 anoikis-related DEGs (). Principal component analysis (PCA) results showed a clear classification between subtype A and subtype B ().
Figure 3. Identification of two distinct anoikis modification subtypes across OA samples. (A, B) Ten genes were identified by lasso regression analysis. (C) Consensus matrix heatmap defining two subtypes (k = 2) and their correlation area. (D) Consensus clustering model with cumulative distribution function (CDF) for k = 2–9. k means cluster count. (E) Relative change in the area under the CDF curve for k = 2–9. (F) The consensus cluster of items (in column) at k = 2–9 (in row). (G) Principal component analysis (PCA) showing a remarkable difference in transcriptomes between the two subtypes of OA.
Immune infiltration characteristics of anoikis subtypes
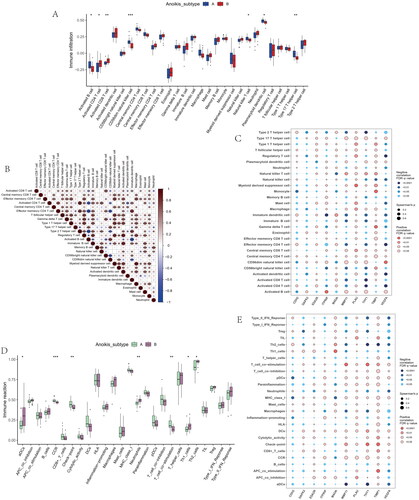
DEGs were shown in the volcano plot between the two anoikis-related subtypes (). The heatmap of expression of 28 immune cells showed a difference between two anoikis subtypes, such as Plasmacytoid dendritic cell and Central memory CD4 T cells, which have higher expression in cluster B (). The barplot showed the different proportions of 28 immune cells, and the result indicated that Macrophages M0 and Plasma cells accounted for a large part of the entire ratio column (). Gene Set Variation Analysis (GSVA) was performed to show that glycosaminoglycan biosynthesis heparan sulphate and glycosaminoglycan biosynthesis chondroitin sulphate was highly expressed in subtype A. Subtype B was mainly enriched in pentose and glucuronate interconversions (). A GO analysis revealed that 1844 anoikis-related subtype DEGs were enriched in ossification in BP, collagen-containing extracellular matrix in CC, nucleoside-triphosphatase regulator activity, and GTPase regulator activity in MF (). The different functional ratios of GO terms in the GO circle (). The KEGG barplot and bubble, including the top 20 KEGG terms, displayed that PI3K-Akt signalling pathway and Calcium signalling pathway were mainly enriched by KEGG analysis (). In addition, 25 immunological examination sites were explored in two subtypes, and the results showed that a total of 9 immune checkpoint genes have significance (). To determine the potential process and pathway between two subtypes, GSEA was carried out for the KEGG pathway enrichment analysis. Multiple immune-related pathways, including histidine metabolism, propanoate metabolism, ribosome, RNA degradation and ubiquitin, mainly enriched in cluster A (). Meanwhile, the pathways, including axon guidance, basal cell carcinoma, ECM receptor interaction, focal adhesion, and notch signalling pathway, are mainly enriched in cluster B (). The levels of Activated B cell, Activated CD4 T cell, Activated CD8 T cell, CD56dim natural killer cell, Natural killer T cell, Plasmacytoid dendritic cell, and Type 17 T helper cell were significantly higher than those in cluster A (). Correlation analysis showed the correlation of 28 immune cells in OA. Macrophage had the highest positive correlation with Myeloid derived suppressor cell, and Immature dendritic cell had the highest negative correlation with Activated B cell (). The correlations between 10 gene signatures and 28 immune cell types were also calculated for all osteoarthritis patients between subtype A and subtype B groups. Type 2 T helper cell and Activated CD4 T were negatively correlated with THY1 gene in anoikis-related subtypes in OA patients, and Monocyte was positively correlated with the TIMP1 gene (). The level of aDCs, Neutrophils, Th1_cells, and Th2_cells were higher in subtype B, and CCR, Checkpoint, and T cell co-stimulation were higher in subtype A (). The correlation between aDCs and MMP11 was highest and most negative, and APC co stimulation was positively associated with the TIMP1 gene (). These results showed that the two subtypes had different characteristics in terms of immune infiltration levels.
Figure 4. Immune signature and pathways of two distinct anoikis subtypes. (A) Volcano plots of DEGs via anoikis subtypes. (B) Heatmap visualizing the infiltrated immune cells in Cluster A and Cluster B groups. (C) The barplot was used to show the proportion of 22 immune cells in different OA samples. (D) Gene-set variation analysis (GSVA) of biological pathways enrichment between two anoikis subtypes.
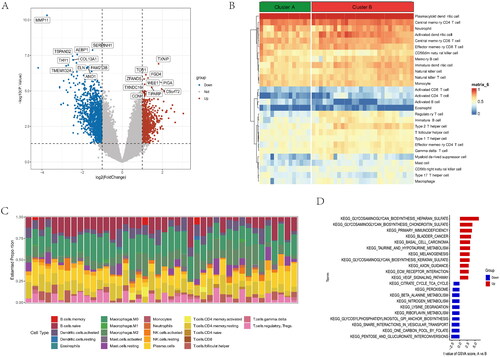
Figure 5. GO and KEGG functional enrichment analysis in anoikis subtypes. (A) Gene ontology (GO) analysis for the DEGs between anoikis subgroups, including biological process, cellular component, and molecular function, respectively. (B) Circle plots for the GO analysis. (C) KEGG enrichment analysis barplot of DEGs between two anoikis subtypes. (D) Bubble of KEGG. (E) Differential expression of immune checkpoint genes between anoikis-related subtype. (F) Multiple pathways and functions were found to be enriched in cluster A group. (G) GSEA analysis in cluster B group. *p < .05, ** p < .01, *** p < .001.
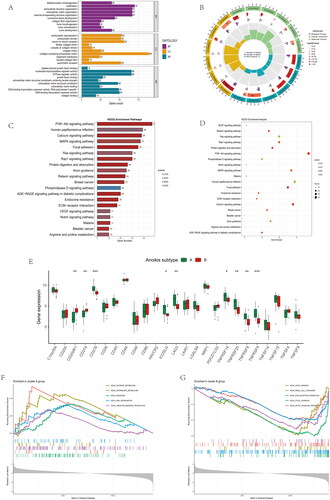
Figure 6. Immune cell infiltrations and immune-related pathways in the immune landscape. (A) Comparison of immune cell infiltration levels in anoikis subtypes. (B) Correlation plot showing significant correlations between the 28 immune cells. (C) Correlation plot showing significant correlations between the genes and immune cell infiltrations. (D) Comparison of immune-related pathways in anoikis subtypes. (E) Correlation plot showing significant correlations between the genes and immune-related pathways. *p < .05, **p < .01, ***p < .001.
Identification of the gene subgroups based on the DEGs of anoikis subtypes
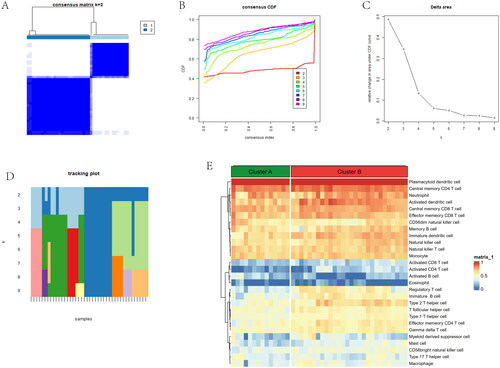
To validate the anoikis subtypes, we performed differential analysis between subtype A and subtype B and found a total of 1844 anoikis-related DEGs. We used consensus clustering to divide the OA patients into two genomic groups (Gene subgroup A and Gene subgroup B) based on the DEARGs. The consensus score had a maximum value, and the ideal grouping was K = 2 (). The heatmap of 28 immune infiltrations based on gene subgroups indicated Activate CD8 T cell and Activate CD4 T cell were at higher levels in gene cluster A ().
Figure 7. Identification of two distinct gene cluster across OS samples. (A) Unsupervised consensus clustering matrix and optimal clusters. (B) Item-consensus plot showing the relationship between each cluster. (C) Relative change in the area under the CDF curve for k = 2–9. (D) The consensus cluster of items (in column) at k = 2–9 (in row). (E) The heatmap of immune cell infiltrations based on gene cluster.
Identification of immune infiltration and biological function in two gene subgroups
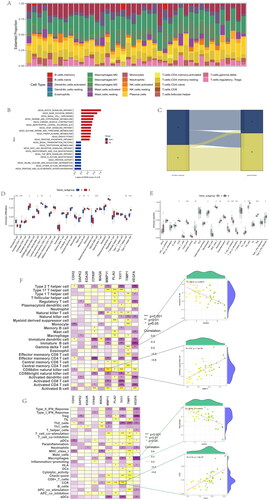
According to gene subgroups, the different ratios of 28 immune cells were visualized in the barplot (). B cells navie, Macrophages M0 and Plasma cells have a large part in the barplot. We conducted GSVA between two gene subgroups. We found notch signalling pathway and base excision repair were upregulated in subgroup A, while pentose and glucuronate interconversions and other glycan degradation were downregulated in subgroup B (). An alluvial diagram showed that the distribution and relationship between anoiki subtypes and gene subgroups was similar (). Activated B cell and Type 2 T helper cell have a lower level in gene subgroup B, while Activated CD4 T cell and Natural killer cell were higher in gene subgroup B (). Comparison of immune-related pathway, T cell co-inhibition and T cell co-stimulation were higher in gene subgroup A. Meanwhile, Th2 cells and Treg were higher in gene subgroup B (). A correlation plot showed significant correlations between 10 genes and immune cells and immune pathways. The VEGFA gene and Immature B cell show a negative relationship, and MMP11 gene was positively correlated with CD56dim natural killer cell (). The VEGFA gene and Macrophages show a negative relationship, and the THY1 gene was positively associated with CCR (). The above results showed that the two gene subgroups had different characteristics in terms of immune infiltration levels.
Figure 8. Comparison of immune microenvironment between two gene clusters. (A) Proportion of 22 immune cell types in two gene subgroups. (B) Gene-set variation analysis (GSVA) of biological pathways enrichment between two gene clusters. (C) Alluvial diagram showing the changes of anoikis subtypes and anoikis gene subgroups of OA. (D) Comparison of immune cell infiltration levels in two gene clusters. (E) Comparison of immune-related pathways in two gene clusters. (F) Correlation plot showing significant correlations between the genes and immune cell infiltration. (G) Correlation plot showing significant correlations between the genes and immune-related pathways. *p < .05, **p < .01, ***p < .001.
Expression of 37 anoikis-related DEGs in different groups
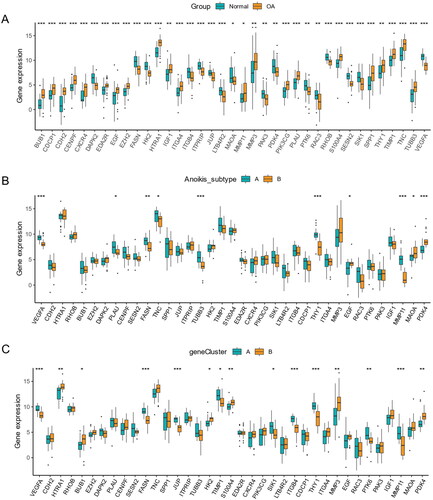
Most genes were higher in OA samples than normal samples. However, the expression of DAPK2, FASN, ITGB4, ITPRIP, JUP, LTB4R2, MAOA, PAK3, PDK4, PTK6, RAC3, RHOB, SESN2, SIK1, and VEGFA was lower in OA samples (). Based on anoikis subtypes, the boxplot of 37 DEARGs was visualized, and the expression of VEGFA, PLAU, FASN, TNC, TUBB3, TUBB3, and MMP11 had a lower level in anoikis subtype B. On the contrary, the expression of EGF, MAOA, and PDK4 was higher in aoikis subtype B (). In a comparison of 37 anoikis-related DEGs expression between two gene subgroups, the genes including HTRA1, BUB1, HK2, S100A4, MMP3, and PDK4 had a lower expression level in gene subgroup A. Meanwhile, the expression of VEGFA, FASN, JUP, TIMP1, SIK1, ITGB4, THY1, PTK6, and MMP11 was higher in gene subgroup A (). We could conclude that DEARGs had higher expression in OA samples, while more genes were higher between anoikis subtype B and gene subgroup B.
Figure 9. Expression of sample groups, anoikis subtypes, gene subgroups based on 37 anoikis-related DEGs. (A) The two sample groups exhibit distinct expression profiles of the 37 DEARGs. (B) Comparison of 37 DEARGs expression levels between the two anoikis subtypes. (C) Comparison of 37 anoikis-related DEGs expressions between the two gene subgroups. *p < .05, **p < .01, ***p < .001.
Identification of hub genes and construction of a nomogram
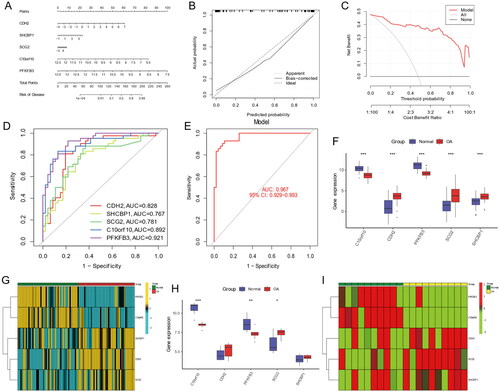
The MEturquoise module was identified as a hub module by WGCNA analysis in gene subgroups, which contained 1192 genes (). We conducted disease WCNA analysis, with the MEgreen module as the most significant module with 239 genes (). The Venn diagram showed the 114 intersection genes between gene subgroups WGCNA and disease WGCNA analysis (). Four models, including XGB, RF, SVM, and GLM, were used to identify the best model. The residual of XGB was the smallest (). The ROC values of RF, SVM, XGB, and GLM were 0.892, 0.850, 0.917, and 0465, respectively (). The feature importance created for the GLM, RF, SVM, and XGB models is visualized in . Above all, we identified the XGB model as the best model and the top five genes of the XGB model as hub genes (CDH2, SHCBP1, SCG2, C10orf10, and PFKFB3). We constructed a nomogram model based on the hub genes to explore the risk of disease (). The calibration curve was used to evaluate the nomogram model and showed that the five hub anoikis-related genes were in good agreement with the ideal model (). The DCA curve showed that decision-making based on a nomogram may benefit OA patients, and the nomogram model had higher clinical utility than individual ARGs (). Finally, we used five hub genes to construct separate ROC curve and an entire ROC curve from the merged dataset (). The boxplot of five hub genes was visualized, which suggested that C10orf10 and PFKFB3 had lower expression in OA samples than normal samples and that CDH2, SCG2, and SHCBP1 had higher expression in OA samples (). The heatmap showed the expression of five hub genes in . The GSE55235 database was used to validate the expression of hub genes. The boxplot and heatmap of hub genes in GSE55235 were the same as in the merged dataset ().
Figure 10. Identification of anoikis-related hub genes in OA. (A) Heatmap of the correlation between module eigengenes and disease groups. (B) Heatmap of the correlation between module eigengenes and OA gene subgroups. (C) 114 genes were identified by intersecting between disease WGCNA and gene clusters WGCNA analysis. (D) The boxplots of residual among XGB, RF, SVM, GLM model. (E) The ROC curve evaluated the diagnostic effect of RF, SVM, XGB, GLM model. (F) Future Importance created for the GLM, RF, SVM, XGB model.
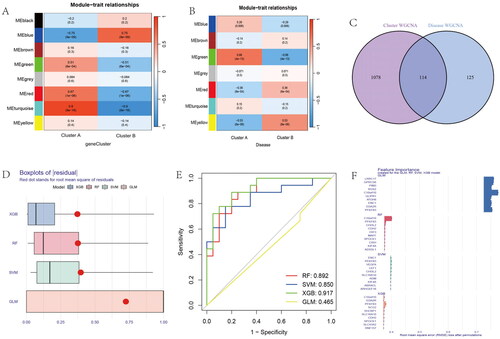
Figure 11. Nomogram and The ROC curve of five hub genes construction and validation by GSE55235 dataset. (A) The nomogram of genes was visible for diagnosing OA. (B) Calibration curve to evaluate nomogram model. (C) The DCA curve suggests that decision-making based on the nomogram may benefit in OA patients because the red lines are consistently maintained above the gray and black lines of 0 to 1. (D) The ROC curve exhibition of four genes (CDH2, SHCBP1, SCG, C10orf10, PFKF). (E) The entire ROC curve of five hub genes. (F) The expression of five hub gens in train dataset. (G) The heatmap showing that the expression of five genes. (H) The boxplot showing that the expression of five hub genes were validated in GSE55235 dataset. (I) The heatmap showing that the expression of five hub genes in validation dataset.
Construction of ceRNA and immune infiltration correlation analysis
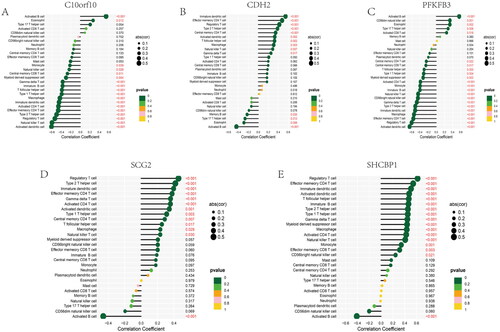
We constructed a network of lncRNA-mRNA-miRNA, and the result showed that there are numerous lncRNAs and miRNAs that would be regulated by five hub genes (). The has-miR-30b-3p, hsa-miR-149-3p, and hsa-miR-515-5p of incRNAs and SNHG14, and MUC2 of lncRNAs are closed linked with hub anoikis-related genes. According to the network, it is helpful for us to explore the potential mechanisms of osteoarthritis and provide some directions for a subsequent therapeutic strategy. In addition, we performed a correlation between 5 hub genes and 28 immune infiltration cells. The results showed that C10orf10 had the strongest relationship with Activated B cell and was negatively related to Activated dendritic cell (). CDH2 was positively associated with Immature dendritic cell and negatively associated with Activated B cell (). PFKFB3 had the highest correlation with Activated B cell and a negatively relationship with Activated dendritic cell (). SCG2 was highest positively with Regulatory T cell and highest negatively with Activate B cell (). SHCBP1 had the strongest positive relationship with Regulatory T cell and the converse with Active B cell (). In conclusion, these hub genes are likely to be involved in immune regulation during the pathogenesis of OA.
Figure 12. Construction of lncRNA-mRNA-miRNA network in OA. Red nodes indicate hub genes, green nodes stand for miRNAs, blue nodes show lncRNAs.
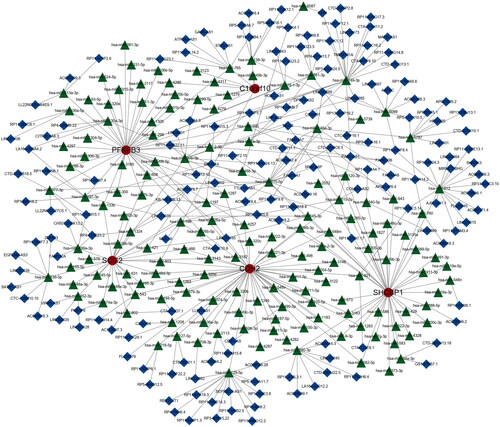
Figure 13. Correlation between four candidate genes and 28 kinds of immune cells. (A–E) Correlation between five genes (C10orf10, CDH2, PFKFB3, SCG2, SHCBP1) and infiltration immune cells. The dot size was used to represent the correlation intensity between genes and immune cells. The greener colour, the p value was higher, and the more yellow colour, the p value was lower.
Sigle-cell analysis the anoikis interacts with the immune in OA cartilage
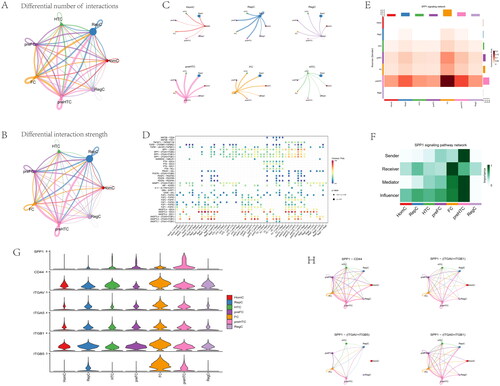
Gene expression profiles of 25,852 cells from 6 OA samples were obtained from the GSE152805 dataset (). The correlation for nCount_RNA was positively with nFeature_RNA (). The variance plot showed 30,738 genes in all cells, red dots represent the top 2000 highly variable genes (). Twenty-four identified marker genes were used to show in different clusters, and corresponding cell types were identified (). Fourteen separate clusters were found and seven cell types (HomC, RepC, HTC, preFC, FC, preHTC, and RegC) were established (). Feature and violin plots showing the distribution of five ARG hub genes in various cell types (). The expression of C10orf10 and BFKFB3 were higher than other immune cell types. Circular plots of the cellular interaction number and interaction strength between each chondrocyte subtype (). Cross-talk analysis between each cluster’s cell type in OA cartilage (). Expression of genes associated with each cluster’s cell type (). Relative strength of seven cell subtypes in clusters from OA cartilage (). The role importance of different clusters in the SPP1 signalling pathway (). The expression level of genes associated with SPP1 signalling pathway (). The circle plots show the obvious changes in cell communication mediated by SPP1 signalling pathways (). the SPP1 signal level was enhanced in the OA cartilage with pre-FC as signal communication centres.
Figure 14. Analysis of single-cell RNA sequencing data from 25,852 cells of six OA cartilage. (A) The gene counts per cell (nFeature_RNA), number of unique molecular identifers (UMIs) per cell (nCount_RNA), and percentage of mitochondrial genes per cell (percent. mt) of the single-cell RNA-seq data. (B) The correlation for nCount_RNA between percent. Mt and nFeature_RNA. (C) The variance plot showed 30,738 genes in all cells, red dots represent the top 2000 highly variable genes. (D) Twenty-four identified chondrocyte marker genes were used to show in different clusters. (E) Cells were divided into 14 separate clusters. (F) Cells were clustered into seven types via tSNE dimensionality reduction algorithm, each colour represented the annotated phenotype of each cluster. (G–H) Feature and violin plots showing the distribution of five ARG hub genes in various cell types.
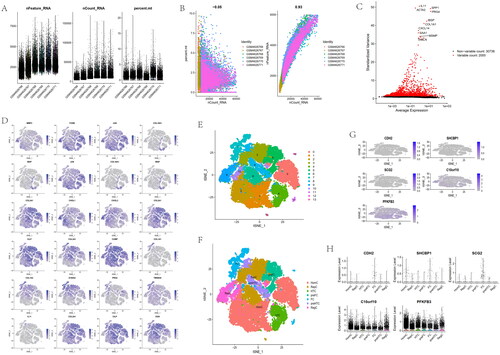
Figure 15. Inferences of cell–cell communication by CellChat revealing the global signalling changes. (A–B) Circular plots of the cellular interaction number and interaction strength between each chondrocyte subtype. (C) Cross-talk analysis between each cluster’s cell type in OA cartilage. (D) Expression of genes associated with each cluster’s cell type. (E) Relative strength of seven cell subtypes in clusters from OA cartilage (F) The role importance of different clusters in the SPP1 signalling pathway. (G) The expression level of genes associated with SPP1 signalling pathway. (H) The circle plots show the obvious changes in cell communication mediated by SPP1 signalling pathways.
Discussion
Ageing, obesity, strain, trauma, congenital anomalies of the joint, joint deformity, and many other causes can cause osteoarthritis, a degenerative disease that damages the articular cartilage, reactive hyperplasia of the articular border, and subchondral bone. Middle-aged and elderly adults are more likely to develop the disease, especially in weight-bearing and more active joints like the cervical vertebrae, lumbar vertebrae, knee joints, hip joints, etc [Citation46]. One of the pathological signalling pathways of OA is related to cell adhesion [Citation47]; Anoikis, a form of programmed cell death, would be activated if there was no cell-substance adhesion [Citation48]. However, there was no research to explore the correlation between OA and anoikis through bioinformation analysis. In order to better investigate the aetiology of OA from a genetic perspective, it is crucial to investigate the essential genes connected to the anoikis of osteoarthritis based on bioinformatics.
Osteoarthritis-related genes and anoikis genes were screened through the GEO and GeneCards databases, and the intersection genes were obtained for lasso regression analysis. We obtained 37 anoikis-related differentially expressed genes by differential analysis between normal and OA groups. Finally, unsupervised clustering was formed based on 10 genes, and we could divide osteoarthritis samples into two subtypes, and then the differential genes were analysed between anoikis-related subtypes. The immune infiltration of these two subtypes was analysed. The results showed that ossification, collagen-containing extracellular matrix, and nucleoside-triphosphatase regulator activity were significantly enriched by GO analysis. PI3K-Akt signalling pathway was enriched in KEGG analysis, which is a classical pathway for the cartilage’s metabolism and development of OA [Citation49]. If the PI3K/AKT/mTOR signalling pathway was inhibited, it could alleviate inflammation in OA [Citation50]. The immune-related infiltration indicated that Activated CD4 T cell and Th2 cells were related with anoikis-related genes.
With the development of machine learning, it can be proven to study the complex nature of human physiology in the medical field [Citation51]. We performed anoikis subtypes, gene subgroups, and WGCNA analysis to explore the potential mechanism of OA, and then machine learning algorithms were conducted to identify hub genes. The candidate genes were validated and constructed into a nomogram and ceRNA. Furthermore, through the mechanical learning method, the top five genes were screened by four different calculation methods, and finally the first five genes calculated by the XGB model were selected as the hub genes: CDH2, SHCBP1, SCG2, C10orf10, and PFKFB3. And the validation dataset of GSE55235 verified the hub genes that had a significant difference. The expression of CDH2, SHCBP1, and SCG2 were higher in OA samples, and the three genes can be viewed as risk genes for OA. On the contrary, the expression of C10orf10 and PFKFB3 was lower in OA samples than in normal groups, and the two genes were protective genes in OA. And then, we can know that the SPP1 signal was remarkably enhanced under OA conditions and pre-HTC seemed to be the major signal transduction players in the signal pathway of OA by single-cell analysis.
However, there are several limitations to this study. Firstly, although the gene expression was obtained from the GEO database, more samples should be collected from clinical OA patients to improve the accuracy of the results. Additionally, further research should be adapted to determine the precise connection of the network of lncRNA-mRNA-miRNA. Finally, the underlying mechanism of the five hub genes for OA should be further explored by in vitro and in vivo experiments. Therefore, these drawbacks should be taken into consideration in future follow-up plans. if conditions allow, we will do experimental verification in addition to collecting clinical samples.
Conclusion
Five anoikis-related hub genes (CDH2, SHCBP1, SCG2, C10orf10, and PFKFB3) and immune-related cells were screened using machine learning and Single-cell analysis. The exploitation of ceRNA regarding hub genes can offer corresponding lncRNAs and miRNAs to explore the mechanism of OA, and key genes provide an underlying target for the immunotherapy of OA. This study may provide a novel insight to research the relationship between Anoikis-related genes and OA.
Author contributions
JunSong Zhang had substantial contributions to the conception or design of the study. RunSang Pan, GuoLu Li, JianXiang Teng, and HongBo Zhao were involved in the acquisition, analysis or interpretation of data for the work. ChangHua Zhou, JiSheng Zhu, Hao Zhen, and XiaoBin Tian drafted the work and revised it critically for important intellectual content and finally approved the version to be published. All authors agree to be accountable for all aspects of the work in ensuring that questions related to the accuracy or integrity of any part of the work are appropriately investigated and resolved.
Disclosure statement
No potential conflict of interest was reported by the author(s).
Data availability statement
The GSE114007, GSE89408, GSE55235, and GSE152805 datasets were publicly available and obtained from Gene Expression Omnibus (GEO, https://www.ncbi.nlm.nih.gov/geo/).
Additional information
Funding
References
- Hunter DJ, Bierma-Zeinstra S. Osteoarthritis. Lancet. 2019;393(10182):1745–1759. doi: 10.1016/s0140-6736(19)30417-9.
- Quicke JG, Conaghan PG, Corp N, et al. Osteoarthritis year in review 2021: epidemiology & therapy. Osteoarthr Cartil. 2022;30(2):196–206. doi: 10.1016/j.joca.2021.10.003.
- Loeser RF. The role of aging in the development of osteoarthritis. Trans Am Clin Climatol Assoc. 2017;128:44–54.
- Duan WL, Zhang LN, Bohara R, et al. Adhesive hydrogels in osteoarthritis: from design to application. Mil Med Res. 2023;10(1):4. doi: 10.1186/s40779-022-00439-3.
- Ma L, Zheng X, Lin R, et al. Knee osteoarthritis therapy: recent advances in intra-articular drug delivery systems. Drug Des Devel Ther. 2022;16:1311–1347. doi: 10.2147/dddt.S357386.
- Steinmeyer J, Bock F, Stöve J, et al. Pharmacological treatment of knee osteoarthritis: special considerations of the new German guideline. Orthop Rev. 2018;10(4):7782. doi: 10.4081/or.2018.7782.
- Grässel S, Muschter D. Recent advances in the treatment of osteoarthritis. F1000Res. 2020;9:325. doi: 10.12688/f1000research.22115.1.
- Watts DT, Moosa A, Elahi Z, et al. Comparing the results of total ankle arthroplasty vs tibiotalar fusion (ankle arthrodesis) in patients with ankle osteoarthritis since 2006 to 2020- a systematic review. Arch Bone Jt Surg. 2022;10(6):470–479. doi: 10.22038/abjs.2021.55790.2778.
- Yang L, Sun J, Zhang Y, et al. Comprehensive comparative analysis of histopathology and gene expression in subchondral bone between kashin-beck disease and primary osteoarthritis. Front Genet. 2022;13:942326. doi: 10.3389/fgene.2022.942326.
- Liu H, Deng Z, Yu B, et al. Identification of SLC3A2 as a potential therapeutic target of osteoarthritis involved in ferroptosis by integrating bioinformatics, clinical factors and experiments. Cells. 2022;11(21):3430. doi: 10.3390/cells11213430.
- Ansari MY, Novak K, Haqqi TM. ERK1/2-mediated activation of DRP1 regulates mitochondrial dynamics and apoptosis in chondrocytes. Osteoarthr Cartil. 2022;30(2):315–328. doi: 10.1016/j.joca.2021.11.003.
- Park DR, Kim J, Kim GM, et al. Osteoclast-associated receptor blockade prevents articular cartilage destruction via chondrocyte apoptosis regulation. Nat Commun. 2020;11(1):4343. doi: 10.1038/s41467-020-18208-y.
- Adeshakin FO, Adeshakin AO, Afolabi LO, et al. Mechanisms for modulating anoikis resistance in cancer and the relevance of metabolic reprogramming. Front Oncol. 2021;11:626577. doi: 10.3389/fonc.2021.626577.
- Wang J, Luo Z, Lin L, et al. Anoikis-associated lung cancer metastasis: mechanisms and therapies. Cancers. 2022;14(19):4791. doi: 10.3390/cancers14194791.
- Li S, Chen Y, Zhang Y, et al. Shear stress promotes anoikis resistance of cancer cells via caveolin-1-dependent extrinsic and intrinsic apoptotic pathways. J Cell Physiol. 2019;234(4):3730–3743. doi: 10.1002/jcp.27149.
- Zhi Z, Ouyang Z, Ren Y, et al. Non-canonical phosphorylation of Bmf by p38 MAPK promotes its apoptotic activity in anoikis. Cell Death Differ. 2022;29(2):323–336. doi: 10.1038/s41418-021-00855-3.
- Alanko J, Ivaska J. Endosomes: emerging platforms for integrin-mediated FAK signalling. Trends Cell Biol. 2016;26(6):391–398. doi: 10.1016/j.tcb.2016.02.001.
- Li K, Zhao G, Ao J, et al. ZNF32 induces anoikis resistance through maintaining redox homeostasis and activating Src/FAK signaling in hepatocellular carcinoma. Cancer Lett. 2019;442:271–278. doi: 10.1016/j.canlet.2018.09.033.
- Mason JA, Davison-Versagli CA, Leliaert AK, et al. Oncogenic Ras differentially regulates metabolism and anoikis in extracellular matrix-detached cells. Cell Death Differ. 2016;23(8):1271–1282. doi: 10.1038/cdd.2016.15.
- Lee KT, Su CH, Liu SC, et al. Cordycerebroside a inhibits ICAM-1-dependent M1 monocyte adhesion to osteoarthritis synovial fibroblasts. J Food Biochem. 2022;46(7):e14108. doi: 10.1111/jfbc.14108.
- Zhang H, Cai D, Bai X. Macrophages regulate the progression of osteoarthritis. Osteoarthr Cartil. 2020;28(5):555–561. doi: 10.1016/j.joca.2020.01.007.
- Schett G, Kiechl S, Bonora E, et al. Vascular cell adhesion molecule 1 as a predictor of severe osteoarthritis of the hip and knee joints. Arthritis Rheum. 2009;60(8):2381–2389. doi: 10.1002/art.24757.
- Ramos TN, Bullard DC, Barnum SR. ICAM-1: isoforms and phenotypes. J Immunol. 2014;192(10):4469–4474. doi: 10.4049/jimmunol.1400135.
- Chen S, Gu J, Zhang Q, et al. Development of biomarker signatures associated with anoikis to predict prognosis in endometrial carcinoma patients. J Oncol. 2021;2021:3375297–3375212. doi: 10.1155/2021/3375297.
- Chakraborty S, Datta S, Datta S. Surrogate variable analysis using partial least squares (SVA-PLS) in gene expression studies. Bioinformatics. 2012;28(6):799–806. doi: 10.1093/bioinformatics/bts022.
- Ritchie ME, Phipson B, Wu D, et al. Limma powers differential expression analyses for RNA-sequencing and microarray studies. Nucleic Acids Res. 2015;43(7):e47–e47. doi: 10.1093/nar/gkv007.
- Stelzer G, Rosen N, Plaschkes I, et al. The GeneCards suite: from gene data mining to disease genome sequence analyses. Curr Protoc Bioinformatics. 2016;54(1):1.30.1–1.30.33. doi: 10.1002/cpbi.5.
- Wilkerson MD, Hayes DN. ConsensusClusterPlus: a class discovery tool with confidence assessments and item tracking. Bioinformatics. 2010;26(12):1572–1573. doi: 10.1093/bioinformatics/btq170.
- Charoentong P, Finotello F, Angelova M, et al. Pan-cancer immunogenomic analyses reveal Genotype-Immunophenotype relationships and predictors of response to checkpoint blockade. Cell Rep. 2017;18(1):248–262. doi: 10.1016/j.celrep.2016.12.019.
- Langfelder P, Horvath S. WGCNA: an R package for weighted correlation network analysis. BMC Bioinformatics. 2008;9(1):559. doi: 10.1186/1471-2105-9-559.
- Chen T, Guestrin C. XGBoost: a scalable tree boosting system. ACM; 2016.
- Huang S, Cai N, Pacheco PP, et al. Applications of support vector machine (SVM) learning in cancer genomics. Cancer Genom Proteom. 2018;15(1):41–51. doi: 10.21873/cgp.20063.
- Wang H, Yang F, Luo Z. An experimental study of the intrinsic stability of random Forest variable importance measures. BMC Bioinformatics. 2016;17(1):60. doi: 10.1186/s12859-016-0900-5.
- Friedman J, Hastie T, Tibshirani R. Regularization paths for generalized linear models via coordinate descent. J Stat Softw. 2010;33(1):1–22. doi: 10.18637/jss.v033.i01.
- Pan X, Jin X, Wang J, et al. Placenta inflammation is closely associated with gestational diabetes mellitus. Am J Transl Res. 2021;13(5):4068–4079.
- Chen Y, Wang X. miRDB: an online database for prediction of functional microRNA targets. Nucleic Acids Res. 2020;48(D1):D127–D131. doi: 10.1093/nar/gkz757.
- Paraskevopoulou MD, Georgakilas G, Kostoulas N, et al. DIANA-microT web server v5.0: service integration into miRNA functional analysis workflows. Nucleic Acids Res. 2013;41(Web Server issue):W169–W173. doi: 10.1093/nar/gkt393.
- Agarwal V, Bell GW, Nam JW, et al. Predicting effective microRNA target sites in mammalian mRNAs. Elife. 2015;4:e05005. doi: 10.7554/eLife.05005.
- Dweep H, Gretz N, Sticht C. miRWalk database for miRNA-target interactions. Methods Mol Biol. 2014;1182:289–305. doi: 10.1007/978-1-4939-1062-5_25.
- Li JH, Liu S, Zhou H, et al. starBase v2.0: decoding miRNA-ceRNA, miRNA-ncRNA and protein-RNA interaction networks from large-scale CLIP-Seq data. Nucleic Acids Res. 2014;42(Database issue):D92–D97. doi: 10.1093/nar/gkt1248.
- Satija R, Farrell JA, Gennert D, et al. Spatial reconstruction of single-cell gene expression data. Nat Biotechnol. 2015;33(5):495–502. doi: 10.1038/nbt.3192.
- Jin S, Guerrero-Juarez CF, Zhang L, et al. Inference and analysis of cell-cell communication using CellChat. Nat Commun. 2021;12(1):1088. doi: 10.1038/s41467-021-21246-9.
- Kang X, Zhang K, Wang Y, et al. Single-cell RNA sequencing analysis of human chondrocytes reveals cell-cell communication alterations mediated by interactive signaling pathways in osteoarthritis. Front Cell Dev Biol. 2023;11:1099287. doi: 10.3389/fcell.2023.1099287.
- Ji Q, Zheng Y, Zhang G, et al. Single-cell RNA-seq analysis reveals the progression of human osteoarthritis. Ann Rheum Dis. 2019;78(1):100–110. doi: 10.1136/annrheumdis-2017-212863.
- Sebastian A, McCool JL, Hum NR, et al. Single-cell RNA-seq reveals transcriptomic heterogeneity and post-traumatic osteoarthritis-associated early molecular changes in mouse articular chondrocytes. Cells. 2021;10(6):1462. doi: 10.3390/cells10061462.
- Kang X, Fransen M, Zhang Y, et al. The high prevalence of knee osteoarthritis in a rural chinese population: the Wuchuan osteoarthritis study. Arthritis Rheum. 2009;61(5):641–647. doi: 10.1002/art.24464.
- Yao Q, Wu X, Tao C, et al. Osteoarthritis: pathogenic signaling pathways and therapeutic targets. Signal Transduct Target Ther. 2023;8(1):56. doi: 10.1038/s41392-023-01330-w.
- Weems AD, Welf ES, Driscoll MK, et al. Blebs promote cell survival by assembling oncogenic signalling hubs. Nature. 2023;615(7952):517–525. doi: 10.1038/s41586-023-05758-6.
- Sun K, Luo J, Guo J, et al. The PI3K/AKT/mTOR signaling pathway in osteoarthritis: a narrative review. Osteoarthr Cartil. 2020;28(4):400–409. doi: 10.1016/j.joca.2020.02.027.
- Xue JF, Shi ZM, Zou J, et al. Inhibition of PI3K/AKT/mTOR signaling pathway promotes autophagy of articular chondrocytes and attenuates inflammatory response in rats with osteoarthritis. Biomed Pharmacother. 2017;89:1252–1261. doi: 10.1016/j.biopha.2017.01.130.
- Heo J, Yoon JG, Park H, et al. Machine learning-based model for prediction of outcomes in acute stroke. Stroke. 2019;50(5):1263–1265. doi: 10.1161/strokeaha.118.024293.