
 ?Mathematical formulae have been encoded as MathML and are displayed in this HTML version using MathJax in order to improve their display. Uncheck the box to turn MathJax off. This feature requires Javascript. Click on a formula to zoom.
Abstract
Green-mediated synthesis of nanoparticles has earned a promising role in the area of nanotechnology due to their biomedical applications. This study describes the synthesis of silver nanoparticles (AgNPs) using Mikania micrantha leaf extract and its functional activities against cancer. The synthesis of AgNPs was confirmed using Ultraviolet-Visible (UV-Vis) spectrum that exhibited an absorption band at 459 nm. The bioactive compounds of M. micrantha leaf extract that functioned as reducing and capping agents were confirmed by a shift in the absorption bands in Fourier Transform Infra-red Spectroscopy (FT-IR). Scanning Electron Microscopy (SEM) and Transmission Electron Microscopy (TEM) studies validated the spherical shape and size of AgNPs, respectively. Energy Dispersive Spectroscopy (EDS) analysis revealed the presence of elemental silver. The crystalline nature of AgNPs was confirmed by the X-ray Diffraction Analysis (XRD). AgNPs effectively induced cytotoxicity and prevented A549 cell colony formation in a dose-dependent manner. Treatment of A549 cells with AgNPs also increased DNA damage, which was coupled with elevated lipid peroxidation and decreased antioxidant enzymes such as glutathione (GSH), glutathione-s-transferase (GST), and superoxide dismutase (SOD). Following AgNPs treatment, the mRNA expression levels of the pro-apoptotic genes as well as the activities of caspases were significantly elevated in A549 cells while the expression levels of anti-apoptotic genes were downregulated. Our study demonstrates the potential of the synthesised AgNPs for cancer therapy possibly targeting the apoptotic pathway.
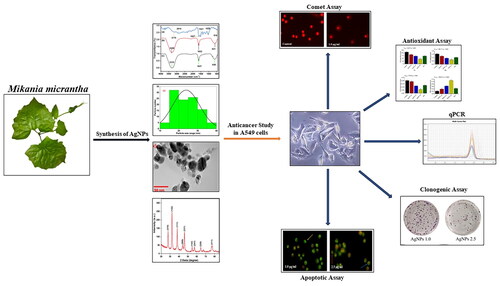
GRAPHICAL ABSTRACT
Introduction
Nanotechnology has emerged as a multidisciplinary approach in biochemical applications due to its wide range of applications in various fields such as diagnostics, biomarkers, cell labelling, antimicrobial agents, drug delivery, and cancer therapy [Citation1]. The intrinsic nature of nanoparticles and their unique physicochemical properties such as increased surface-volume ratios, the ability to absorb or carry other compounds and their efficiency of cell penetration make them ideal for many biological applications when compared to bulk materials [Citation2]. Green synthesis of metallic nanoparticles provides advancement over physical or chemical techniques due to their ecologically benign nature, cost-effectiveness, functional capabilities, and potential for large-scale production [Citation3]. Additional advantage of green synthesis is the ability to control the size of the nanoparticles synthesised by various parameters such as pH and temperature; and does not require the use of stabilisers to prevent aggregation since the proteins in the system act as stabilising agents [Citation4]. Among various metallic nanoparticles, silver nanoparticles have drawn significant attention because of their distinctive characteristics such as catalytic ability, conductivity, chemical stability, relatively lower toxicity, and outstanding therapeutic potential [Citation5]. Many biological resources have been used to create AgNPs including microorganisms, animal metabolites, marine algae, microfluids, and plant extracts [Citation6–8]. Due to phytochemical components of plants that serve as a reducing and coating agent of nanoparticles as well as their eco-friendliness, affordability, and accessibility, plant extracts have gained significant interest among biomaterials as a nanomedicine. The diverse phytoconstituents in plants provide significant benefits, such as antibacterial, anticancer, and antioxidant properties; thus, plant-based green synthesis platforms are recommended as one of the ideal techniques for synthesising metal nanoparticles [Citation9].
Mikania micrantha (mile-a-minute) is a tropical vine that belongs to the family Asteraceae. Traditionally, it has been used as a medicinal plant worldwide for treating insect bites [Citation10], influenza, rheumatism, respiratory diseases [Citation11] and to reduce skin rashes and itches [Citation12]. In the recent years, a wide range of scientific studies have documented the medicinal properties of M. micrantha such as antibacterial, anti-inflammatory, anticancer, antidiabetic, antioxidant, anti-stress, its cytotoxic effects and wound-healing actions [Citation13,Citation14]. M. micrantha has been shown to contain several groups of active compounds, including terpenoids, flavonoids, coumarins, diterpenes, sesquiterpene lactones, and sesquiterpenes which may be linked to its medicinal properties [Citation15]. Interestingly, the anticancer effects of M. micrantha have been shown earlier using cancer cell lines and animal models. Aqueous extract of M. micrantha inhibited cancer cell proliferation, cell cycle arrest, induction of apoptosis and inhibition of tumour growth [Citation16]. Although medicinal plant extracts show activities against pathogenic conditions and alteration of cellular functions, their activities are often augmented in green metallic nanoparticles form. With this view, we hypothesised that M. micrantha activities may be enhanced by silver nanoparticles. Thus, M. micrantha aqueous leaf extract was used as a bio-reducing agent of Ag+ to Ag for the synthesis of silver nanoparticles. Using Type II human lung adenocarcinoma cell line A549 as our model, we tested the anticancer effects of biosynthesized AgNPs prepared using M. micrantha leaf extract. With cancer being a global health issue affecting millions of lives, it is the need of the hour to hunt for cancer treatment with high efficacy and less side effect and the green synthesised AgNPs may pose as an attractive agent.
Materials and methods
Chemicals and reagents
Eagle’s Minimal Essential Medium (MEM), Trypsin-EDTA, foetal bovine serum (FBS), bovine serum albumin (BSA), 3-(4,5-dimethylthiazole-2-yl)-2, 5-diphenyl tetrazolium bromide (MTT), sodium bicarbonate, glutathione (GSH) reduced, Folin-ciocalteu’s reagent, nicotinamide adenosine dinucleotide (NADH), nitroblue tetrazolium (NBT), n-butanol, thiobarbituric acid (TBA), potassium chloride (KCl), 5, 5′ dithio 2-nitrobenzoic acid (DTNB), sodium chloride (NaCl), phenazine methosulphate (PMS), ethidium bromide, dimethyl sulphoxide (DMSO), 1-chloro-2,4 dinitrobenzene (CDNB) and Triton X-100 were purchased from HiMedia Laboratories Pvt. Ltd. (Mumbai, India). Ethylenediamine tetra-acetic acid (EDTA), L-Glutamine, agarose (low gelling temperature), phenol red, trichloroacetic acid (TCA), silver nitrate, Trizma base and Trizma hydrochloride were purchased from Sigma Chemical Co., Bangalore, India. Fluorouracil (5FU) was obtained from GLS Pharma Ltd. (Hyderabad, India). The remaining chemicals were purchased from Merck Specialities Pvt., Ltd. (Mumbai, India).
Preparation of plant extract
Fresh leaves of M. micrantha were collected from Aizawl, Mizoram, India. The leaves were thoroughly washed, dried, and minced. Pulverised leaves (25 g) were boiled in distilled water (100 mL) for 1 h. After centrifugation, the liquid extract was filtered through Whatman No. 1 filter paper. The extract was kept at 4 °C after filtration until it was further processed for the synthesis of AgNPs.
Preparation of 1 mM silver nitrate (AgNO3) solution
AgNO3 (17 mg) was dissolved in 100 mL of double distilled water for the preparation of 1 mM silver nitrate solution. To avoid light-induced oxidation of silver, the solution was stored in an amber bottle.
Synthesis of silver nanoparticles (AgNPs)
For reduction of silver ions, M. micrantha leaf extract (10 mL) was mixed with 90 mL of 1 mM AgNO3 solution and the pH of the mixture was maintained at 7.0. The reaction mixture changed from light yellowish to reddish brown due to excitation of surface plasmon resonance with continuous stirring at room temperature, indicating the synthesis of AgNPs. The biosynthesized AgNPs were centrifuged at 15,000 rpm for 5 min and redispersed in deionised water to eliminate any uncoordinated biological molecules. UV-Vis spectral analysis was further performed to confirm the formation of AgNPs by the reduction of Ag+ from AgNO3.
Characterisation of silver nanoparticles
The bio-reduction of Ag+ ions in solutions was monitored by measuring the UV–vis spectrum (Shimadzu UV-1900I UV-Vis Spectrophotometer) at 300–600 nm. FT-IR spectrum analysis (Perkin-Elmer Spectrum Two with Universal ATR Software 10; Spectrum 10.5.2.636) was performed to analysed the possible functional groups involved in the synthesis of AgNPs. The crystalline nature of metallic AgNPs was determined by X-ray diffraction analysis (X-ray diffractometer D8 ADVANCE ECO BRUKER) in the range of 10–80° at 2θ angles with a Cu Kα radiation (λ = 1.54060 Ao, 40 kV, 30 mA) monochromatic filter. The morphology of biosynthesized AgNPs was investigated by Transmission Electron Microscopy (TEM) (JEM-2100 Plus Electron Microscope, JEOL Ltd) and Scanning Electron Microscopy (JSM-IT800 Schotty Field Emission; JEOL Ltd).
Cell lines and culture
Type II human lung adenocarcinoma cell line (A549 cells) was procured from the National Centre for Cell Sciences (NCCS), Pune, India. The cells were maintained in MEM supplemented with 10% FBS and 1% L-Glutamine in a humidified incubator with 5% CO2 at 37 °C (Eppendorf, Hamburg, Germany)
Cytotoxicity assay
The cytotoxicity of AgNPs was estimated by a 3-(4,5-dimethylthiazol-2-yl)-2,5 diphenyltetrazolium bromide (MTT) reduction assay [Citation17]. Researchers have frequently employed the MTT assay to assess the cytotoxic effects of various nanoparticles [Citation9,Citation18,Citation19]. Briefly, 100 µL of MEM containing 1 × 10⁴ cells were seeded into 96 well plates (Himedia Laboratories Pvt. Ltd., Mumbai, India). The cells were treated with different concentrations of AgNPs (1–20 µg/mL) for 24 h, along with a control sample, after being allowed to adhere for 24 h at 37 °C and 5% CO2. Drug-containing media were discarded and cells were rinsed in FBS-free media after the completion of treatments. Then, each well received 10 µL of MTT (5 mg/mL) and was incubated for a further 2 h at 37 °C in a CO2 incubator. Following this, 100 μL of DMSO was used to dissolve the insoluble purple formazan crystals. After 30 min of incubation, the absorbance of the solution was measured at 560 nm using a microplate reader (Spectramax m2e, Molecular Devices). For each treatment, three independent experiments with three replicates were conducted. Cytotoxicity was expressed as inhibition (%) which was calculated by the formula given below:
Clonogenic assay
The clonogenic assay was performed to determine the effect of AgNPs on the reproductive viability of A549 cells [Citation20]. 200 cells were seeded into individual petri-dishes with 5 mL of media. Cells were treated with different concentrations of AgNPs (1.0, 2.5 and 5.0 µg/mL) or 5FU at the dose of 100 µg/mL (positive control) after being allowed to adhere for 24 h. Following a sterile 1X PBS wash, cells were cultured for an additional 11 days in a fresh medium. Colonies having more than 50 cells were counted using an inverted microscope after being stained with 1% crystal violet in methanol (w/v) for 30 min at room temperature. Plating efficiency (PE) and surviving fraction (SF) of A549 cells were calculated by the following formula:
Cell morphology analysis by fluorescent staining (apoptotic assay)
Acridine orange/Ethidium bromide (AO/EtBr) staining was performed to assess the ability of AgNPs to induce apoptosis. After 1 × 10⁵ A549 cells were seeded in six-well plates containing 5 mL of media, cells were allowed to adhere overnight and treatment was given for 24 h with different concentrations of AgNPs (1–5 µg/mL) along with 5FU as positive control (100 µg/mL). Untreated controls were also maintained in the culture medium alone. Cells were washed with sterile 1X PBS following treatments and then detached with 1X trypsin EDTA. The pelleted cells were resuspended in 100 µL of FBS-free media. Acridine orange (100 g/mL) and ethidium bromide (100 g/mL) were added to a 25 µL cell solution and stained for 2 min in a ratio of 1:1. The morphology of apoptotic cells was then observed on a slide using a fluorescence microscope (Thermo Fisher Scientific, EVOSR Fluorescence Imaging, AMEP-4615). The cationic dye acridine orange is a fluorescent nucleic acid that permeates both living and dead cells, intercalating in double-stranded DNA to turn the nucleus green. Only dead cells with compromised cytoplasmic membrane integrity may absorb ethidium bromide, which causes the nuclei to become yellowish-orange in colour. For this reason, ethidium bromide-incorporated apoptotic cells show condensed and fragmented orange chromatin, in contrast to living cells, which have green nuclei. Conversely, necrotic cells have a structurally normal orange nucleus [Citation21]. The apoptotic index of at least 300 cells was evaluated as follows:
Assessment of genotoxicity of AgNPs using Comet assay
The alkaline single cell gel electrophoresis (Comet assay) was carried out using standard method [Citation22] with minor modifications. Briefly, 1 × 10⁵ A549 cells treated with different concentrations of AgNPs or 5FU for 24 h along with the untreated control were suspended in 0.5% low-melting point agarose (75 µL) prepared in 1X PBS and spread onto a frosted slide precoated with 1% normal-melting point agarose. Slides were immersed for 2 h in freshly prepared lysing solution (2.5 M NaCl, 100 mM Na2EDTA, 10 mM Trizma base, 1% Triton X-100 and 10% DMSO, pH 10). Following lysis, slides were placed in a horizontal electrophoresis tank containing freshly prepared alkaline electrophoresis buffer (300 mM NaOH, 1 mM Na2EDTA, pH13) for 20 min to allow unwinding of DNA. Electrophoresis was then carried out for 30 min at 24 V and 300 mA and the slides were then neutralised by washing with neutralisation buffer (0.4 M Tris-HCl, pH 7.5) for 5 min. Slides were washed with distilled water after neutralisation and then stained with ethidium bromide (EtBr) solution (2 μg/mL) for 5 min. Each slide was prepared in triplicate and 100 randomly selected cells from each slide were examined using a fluorescence microscope (Thermo Fisher Scientific, EVOSR Fluorescence Imaging, AMEP-4615) with a magnification of 200x. The images captured were analysed with Image J software.
Antioxidant assays
Cells (2.5 × 10⁶) were seeded in a T-25 flask with 5 mL of medium for the assessment of antioxidant enzyme activities and the level of lipid peroxidation. After 24 h of AgNPs or 5FU treatments, the drug-containing medium was discarded and the cells were harvested after being washed in sterile 1XPBS. The cells were pelleted, sonicated (PCI Analytics Pvt. Ltd., Mumbai, India), and a 5% homogenate was prepared in cold sterile PBS (pH-7.4) for biochemical assays. Total protein contents were determined using the standard protocol [Citation23] using bovine serum albumin as standard.
Glutathione (GSH) levels were assessed using the standard method [Citation24]. Briefly, the cell homogenate (80 µL) was incubated with 0.02 M sodium phosphate buffer (900 µL) and 10 mM DTNB (20 µL) for 2 min at room temperature. A mixture devoid of tissue lysates served as blank. The absorbance of the sample was taken against blank at 412 nm in a UV-visible spectrophotometer (SW 3.5.1.0. Biospectrometer, Eppendorf India Ltd., Chennai). GSH concentration was calculated from the standard graph and expressed in μmol/mg protein.
Glutathione-s-transferase (GST) was measured using the standard method [Citation25]. Briefly, 5 mM CDNB (50 µL) was mixed with 0.1 M phosphate buffer (850 µL, pH 6.5) and incubated at 37 °C for 10 min. Then, 50 µL each of 20 mM GSH and cell homogenate was added to the mixture. A mixture devoid of tissue lysates served as blank. The absorbance was measured at 1-min interval for 5 min at 340 nm. GST activity was expressed as Unit/mg protein. GST activity was measured as:
where, 9.6 is the molar extinction coefficient for GST.
The activity of superoxide dismutase activity was estimated by the NBT reduction method [Citation26]. Briefly, cell homogenate (100 µL) and 186 µM PMS (100 µL) was mixed with 3 mM NBT (300 µL) and 780 µM NADH (200 µL). The mixture was incubated at 30 °C for 90 s and the reaction was stopped by adding 1 mL of acetic acid and 4 mL of n-butanol. A mixture devoid of tissue lysates served as blank. The absorbance was measured at 560 nm and the enzyme activity was expressed in unit (1 unit = 50% inhibition of NBT reduction)/mg protein.
Lipid peroxidation (LPO) assay
Lipid peroxidation (LPO) was estimated using standard method [Citation27]. Briefly, 10% TCA, 0.8% TBA and 0.02 N HCl were mixed with cell homogenate in 1:2 ratio. After boiling for 10 min, the mixture was cooled immediately and centrifuged at 12,000 rpm for 10 min. The absorbance of supernatant was taken at 535 nm against blank. A mixture devoid of tissue lysates served as blank. The malondialdehyde (MDA) concentration of the sample was calculated using the extinction coefficient of 1.56 x 10⁶ M−1cm−1
qRT-PCR analysis of pro-apoptotic and anti-apoptotic gene expression
Briefly, 3 × 10⁶ A549 cells were seeded in T-25 flask with 5 mL media. After an overnight adherence, cells were treated with 2.5 µg/mL AgNPs or 5FU for 24 h along with a control sample. Cells were washed and harvested following treatments. Total RNA was extracted from the pelleted cells using Tri reagent (BR Biochem, Life Science Pvt. Ltd, R1022). Extracted RNA was quantified using Nanodrop Spectrophotometer (Eppendorf Biophotometer Plus, Hamburg, Germany) and an RQ1 DNase kit (Promega, M198A, Madison, WI, USA) was used to remove the genomic contamination. 3 μg of total RNA was used to synthesise cDNA with a first-strand cDNA synthesis kit (Thermo scientific, K1621; Lithuania, Europe). Gene-specific primers were designed using Primer 3, Boston, MA, USA. The primer sequences used in qRT-PCR analyses were: GAPDH, forward: 5′-GAGTCAACGGATTTGGTCGT-3′ and reverse: 5′-GACAAGCTTCCCGTTCTCAG-3′; BCl-XL, forward: 5′-GGCCACTTACCTGAATGACC-3′ and reverse: 5′- AAGAGTGAGCCCAGCAGAAC-3′; BCl-2, forward: 5′-GGATGCCTTTGTGGAACTGT-3′ and reverse: 5′-AGCCTGCAGCTTTGTTTCAT-3′; Bax, forward: 5′-TCCCCCCGAGAGGTCTTTT-3′ and reverse: 5′-CGGCCCCAGTTGAAGTTG-3′; Bid, forward: 5′-CCTTGCTCCGTGATGTCTTTC-3′ and reverse: 5′-GTAGGTGCGTAGGTTCTGGT-3′; Survivin, forward: 5′- AGAACTGGCCCTTCTTGGAGG −3′ and reverse: 5′-CTTTTTATGTTCCTCTATGGGGTC-3′; p53, forward: 5′- GTTCCGAGAGCTGAATGAGG-3′ and reverse: 5′-TCTGAGTCAGGCCCTTCTGT-3′; PARP, forward: 5′-CCAGATGCTTGTCTTCCTGAGAG-3′ and reverse: 5′- AGTGACAGCAGGGTTGGCATGA −3′; Apaf-1, forward: 5′-AAGGTGGAGTACCACAGAGG-3′ and reverse: 5′-TCCATGTATGGTGACCCATCC-3′. qPCR was performed using Quant-Studio 5 (ThermoFisher Scientific, Foster City, CA, USA). 1 µL of cDNA, 1 µL of gene-specific forward and reverse primers, 1 µL of nuclease-free water (ThermoFisher Scientific, A19938, Bangalore, India) and 3 µL of PowerUpTM SYBRTM Green Master Mix (Thermo Fisher Scientific, A25742, Lithuania, Europe) constitute a 7 µL PCR reaction volume for each gene. The cycling condition of qPCR was 1 cycle at 95 °C (20 s), 35 cycles at 95 °C (01 s), 60 °C (20 s), and 95 °C (01 s), additional melt curve plot step included 1 cycle of 60 °C (20 s) and 1 cycle of 95 °C (01 s). Melting curves were subsequently generated to confirm a single uniform peak. For the purpose of determining the relative expression levels of specific target genes, the GAPDH gene was selected as a reference gene. Each sample was run in duplicate along with non-template and negative RT controls. The relative expression of genes was determined using the ΔΔCt method [Citation28].
Caspase-3/6 activity assay
A quantitative enzymatic activity assay for caspase 3 and caspase 6 was performed in accordance with the manufacturer’s protocols (BioVision Incorporated, USA). Briefly, 2 × 10⁶ A549 cells were treated with 2.5 µg/mL AgNPs or 5FU for 24 h in T-25 flask with 5 mL of medium along with the untreated control. Following treatment, cells were washed and lysed in 50 µL of chilled lysis solution, followed by a 10 min incubation on ice. The cell lysates were centrifuged at 15,000 × g for 1 min at 4 °C, and the supernatant was collected. The total amount of protein was estimated using the Bradford assay [Citation29]. The assay was performed in a total volume of 100 μL in 96-well plates. 150 µg of protein from each sample was assayed for caspase-3/6 activity against their specific colorimetric substrate DEVD-pNA for caspase-3, and VEID-pNA for caspase-6. The mixture was incubated for another 2 h at 37 °C and the absorbance of free p-nitroanilide (pNA) produced via cleavage from their specific substrates by activated caspase-3 and caspase- 6 was measured at 405 nm using a microplate reader.
Statistical analysis
All data were expressed as mean ± standard error of the mean. One-way ANOVA followed by Tukey’s test was performed to test significant variations between control and treatment groups. SPSS ver.16.0 software (SPSS Inc, Chicago, Illinois, USA) and Graph Pad Prism ver. 6.0 were used for statistical and graphical analyses. A p-value of less than 0.05 was considered statistically significant.
Results
Visual confirmation and UV-visible spectra analysis
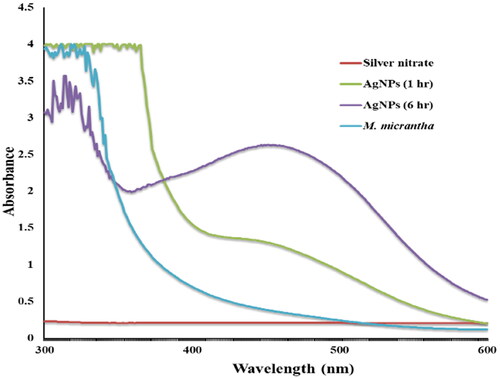
The preliminary detection of the formation of AgNPs was done by visual observation as the reaction mixture changed from a light-yellow to a reddish-dark-brown colour (). This colour change was due to the excitation of surface plasmon resonance (SPR) of the silver nanoparticles. The absorption spectra of biosynthesized AgNPs formed in the reaction mixture was recorded using UV-Vis analysis at different time intervals. The SPR of the nanoparticles produced a peak centred at 459 nm, confirming the reduction of AgNO3 into AgNPs at room temperature (). The intensity of the SPR peak increased with reaction time indicating the increasing yield of AgNPs. Electrostatic interactions between metal complexes and organic functional groups, such as polyphenols, flavonoids, terpenoids, amino acids, reducing sugars and alkaloid of the leaf extract of M. micrantha are involved for the formation and stabilisation of silver nanoparticles [Citation30].
Figure 1. Visual identification of biosynthesized AgNPs as recorded at different time-interval: (a) Initial, (b) 2 h, and (c) 4 h. The formation of reddish-brown colour revealed the formation of AgNPs in the reaction mixture.
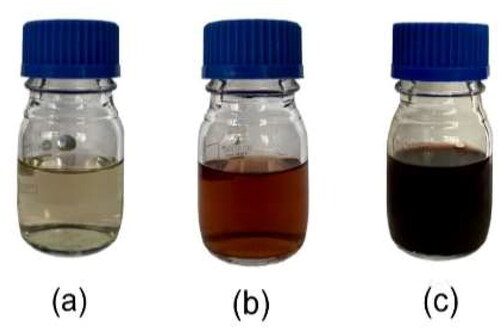
Figure 2. UV-Vis absorption spectra of biosynthesized AgNPs using M. micrantha leaf extract at different time intervals.
FT-IR spectrum
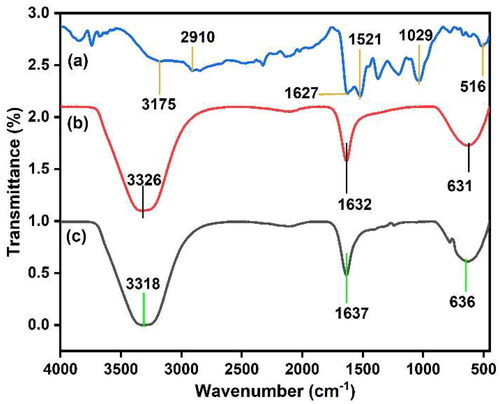
FT-IR spectrum analysis was used to investigate the possible functional groups involved in the synthesis of AgNPs (). Strong stretching vibrations of the hydroxyl and amino groups of alcohols and phenolic compounds are indicated by the intense bands observed in the FT-IR spectrum of AgNPs at 3175 cm−1. The single-bonded C-H alkane and -CH3-sym stretching vibrations were responsible for the absorption peak detected at 2910 cm−1 and 1521 cm−1, respectively. This suggests the existence of aromatic and carbonyl groups in the protein and metabolites found in the M. micrantha leaf extract [Citation31]. The stretching of carbonyl groups (C = O) is responsible for the high peak at 1627 cm−1, indicating the presence of compounds such as terpenoids and flavonoids [Citation32]. A prominent peak was observed in the infra-red spectra of M. micrantha leaf extract at 1632 cm−1 which corresponds to the C = O stretching or amide 1 bending, indicating the reduction of silver ions to silver nanoparticles. The peak at 1029 cm−1 corresponds to C–O stretching from alcohol, carboxylic acid, ester, and ether assigned by protein and metabolite functional groups covering the AgNPs [Citation33]. The peak at 516 cm−1 corresponds to C–Cl, C–Br stretching vibrations to alkyl halides [Citation34]. Comparison of the FT-IR spectra of the plant extract and AgNPs revealed a shift in the absorption peak of the hydroxyl and carbonyl groups, suggesting that these biomolecules act on both the bio-reduction and stabilisation of AgNPs synthesised using M. micrantha leaf extract.
Figure 3. FT-IR analysis of (a) biosynthesized AgNPs (b) M. micrantha leaf extract (MMAE), and (c) Silver nitrate.
SEM and EDS analysis
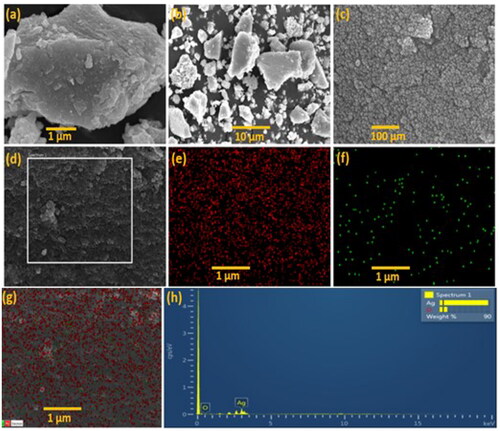
Scanning electron microscopy (SEM) micrographs confirmed the formation of uniformly spherical nanoparticles at different magnificence images (). The chemical composition of the silver nanoparticles that have been synthesised using M. micrantha leaf extract is revealed by energy dispersive spectroscopy (EDS) (). The biosynthesised AgNPs exhibit optical absorption peak of the surface plasmon resonance at around 3 keV showing strong signal for Ag and oxygen, which could be attributed to biomolecules attached to the surface of the silver nanoparticles (). The emission energy at 3 keV is a clear indication of the reduction of silver ions to the elemental silver (Ag0) [Citation35].
Figure 4. (a–d) SEM micrographs of biosynthesized AgNPs. Elemental mapping of silver (e), and oxygen (f), and both elements (g) for the inset region, and (h) EDS data of the area in the white box in (c). Scale bars: (a) 1 µm (b) 10 µm (c) 100 µm, and (e–g and inset) 1 µm.
TEM analysis
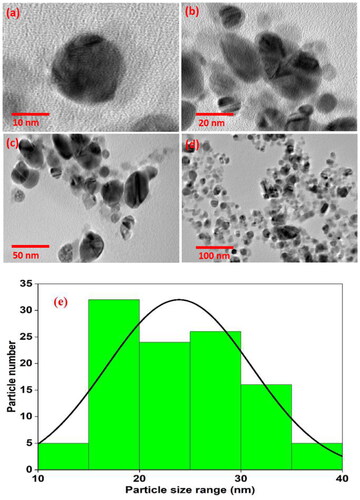
Transmission electron microscope (TEM) is used to determine the morphology, individual size, and precise shape of AgNPs at various angles. The TEM images () showed that the biosynthesized AgNPs exhibit poly-dispersed spherical morphology and are predominantly spherical and oval in shape. The average size of the AgNPs is 23.9 nm, with particle sizes ranging from 10 to 40 nm (). A very slight thin layer on the surface of the AgNPs was clearly visible in the TEM images, which may be related to the organic compounds from the extract possibly acting as capping and stabilising agents of AgNPs.
Figure 5. (a–d) TEM micrograph showing size of biosynthesized AgNPs. Scale bars: (a) 10 nm, (b) 20 nm, (c) 50 nm, and (d) 100 nm. (e) Histogram of the TEM image (100 nm).
X-ray diffraction analysis
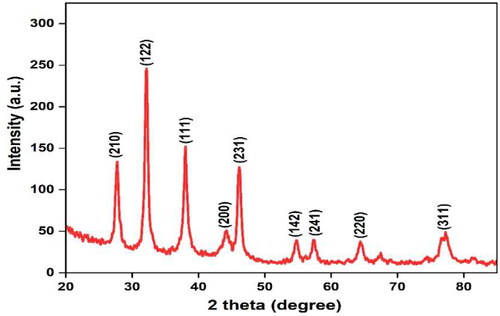
X-ray diffraction was employed to analyse the crystallinity nature of the biosynthesized AgNPs. Significant diffraction peaks were detected at 2θ values of 38.42°, 44.71°, 64.92° and 77.75° corresponding to the (111), (200), (220) and (311) planes of pure silver based on the face-centred cubic structure (JCPDS file No. 04-0783). Thus, the XRD pattern showed that the biosynthesized AgNPs are composed of pure crystalline silver. The sharp peaks confirm cubic crystalline nature of AgNPs synthesised by M. micrantha leaf extract (). The broadening of Bragg’s peaks was used as confirmation for the synthesis of silver nanoparticles. Several unidentified peaks were attributed to the phytochemical compounds found in the M. micrantha leaf extract.
Figure 6. XRD pattern of biosynthesized AgNPs using M. micrantha leaf extract.
The antiproliferative and cytotoxic effects of AgNPs in A549 cells
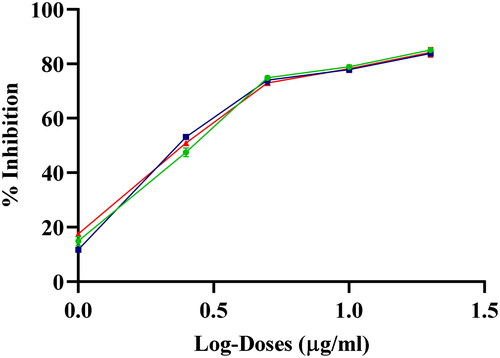
A549 cells were treated for 24 h with different concentrations of AgNPs to determine their cytotoxicity and the amount of cell death induced by AgNPs was assessed by the MTT assay. Treatment of cells with AgNPs showed a dose dependent increase in cytotoxicity. The inhibition (%) of A549 cells by AgNPs was plotted against log doses for the calculation of IC50 (). The cytotoxic effect of AgNPs (IC50: 2.8 ± 0.02 µg/mL) at 24 h treatment was found to be significantly higher than the M. macrantha extract alone as well as AgNO3, where the IC50 could not be determined even at the dose of 200 µg/mL.
Figure 7. Plots of log-doses of various concentration of AgNPs in triplicate against inhibition (%) of A549 cells after 24 h treatment for the calculation of IC50.
The inhibitory effect of AgNPs on the clonogenicity of A549 cells
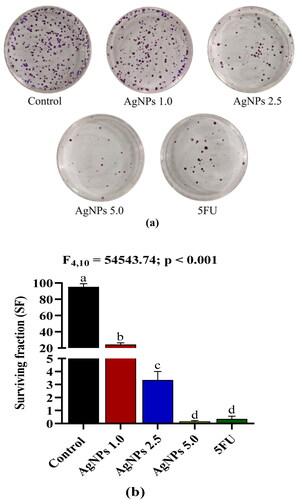
Cancer cells are able to regulate their growth and spread by forming colonies, which they utilise as a means of communicating and assembling themselves into a tumour. Compared to the untreated control, our results reveal that AgNPs treatment significantly decreased the clonogenicity of A549 cells in a dose-dependent manner (). Colony-forming ability was considerably suppressed in A549 cells treated with AgNPs at concentrations of 1.0, 2.5 and 5.0 µg/mL with 24.21, 3.35, and 0.17 surviving fraction, respectively (). The colony inhibitory effect of AgNPs at a concentration of 5.0 µg/mL was comparable to that of the standard drug 5FU, showing the efficacy of AgNPs in reducing the formation of colonies in cancer cells.
Figure 8. (a) Inhibition of colony formation of A549 cells mediated by AgNPs. (b) Effect of AgNPs on the reproductive viability of A549 cells, expressed as a surviving fraction (SF). Control: A549 cells without treatment; AgNPs 1.0, AgNPs 2.5 and AgNPs 5.0: A549 cells treated with 1.0, 2.5 and 5.0 µg/mL of AgNPs respectively; 5FU: A549 cells treated with 100 µg/mL of 5FU (positive control). Values are expressed as Mean ± SEM. Different letters indicate significant variation.
Morphological evidence of apoptosis induced by AgNPs
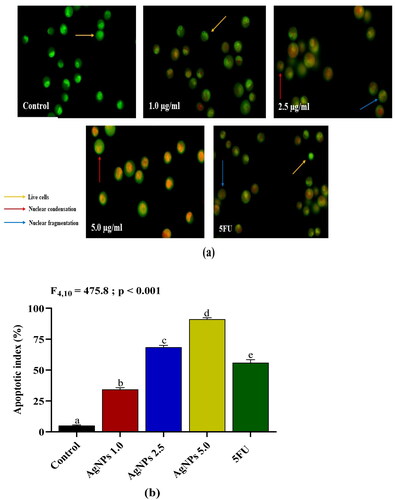
The apoptotic morphology was identified and quantified using acridine orange/ethidium bromide (AO/EtBr) dual staining to ascertain whether apoptosis is the mechanism underlying AgNPs-induced suppression of A549 cell growth. A549 cells treated with various concentrations of AgNPs for 24 h revealed a dose-dependent increase in apoptotic cells. Fluorescence microscopic images of the AgNPs treated cells () showed morphological alterations such as nuclear condensation and nuclear fragmentation which are the distinct characteristics of apoptotic cells. Treatment with AgNPs at 1.0, 2.5, and 5.0 µg/mL resulted in a progressive increase in the apoptotic index (%), with the percentage of dead cells being 34.4%, 68.5%, and 91.2%, respectively. The apoptotic index of A549 cells treated with 5.0 µg/mL of AgNPs was found to be significantly higher than that of the standard drug 5FU ().
Figure 9. (a) Acridine orange/Ethidium bromide (AO/EtBr) dual staining of A549 cells after treatment with different doses of AgNPs for 24 h (yellow arrow shows the live cells, red arrow shows apoptotic cells with nuclear condensation, and blue arrow shows apoptotic cells with nuclear fragmentation). (b) Percentage of dead cells after treatment of A549 with biosynthesized AgNPs. Control: A549 cells without treatment; AgNPs 1.0, AgNPs 2.5 and AgNPs 5.0: A549 cells treated with 1.0, 2.5 and 5.0 µg/mL of AgNPs respectively; 5FU: A549 cells treated with 100 µg/mL of 5FU (positive control). Values are expressed as Mean ± SEM. Different letters indicate significant variation.
Induction of DNA strand breaks by AgNPs
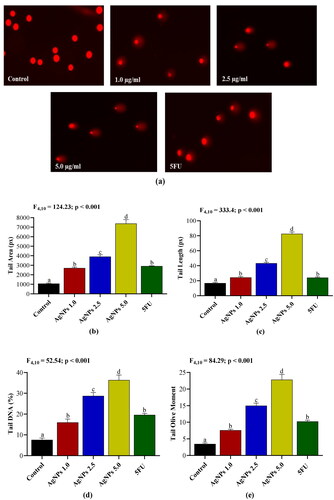
DNA damage and activation of apoptosis in response to anti-cancer drugs is a crucial component of anticancer therapy. The alkaline Comet assay was performed to evaluate DNA damage in A549 cells after treatment with different concentrations of AgNPs. Our findings revealed that AgNPs treatment led to significant DNA damage in A549 cells, as indicated by the increased tail area, tail length, tail DNA, and tail olive moment in AgNPs-treated groups when compared to untreated control group (). Moreover, the levels of DNA damage induced by AgNPs were found to be significantly higher when compared with the damage induced by the standard drug 5FU ().
Figure 10. (a) Fluorescence images of Comets observed in control and A549 cells treated with different concentrations of AgNPs. (b–e) The extent of DNA damage expressed in terms of tail area, tail length, tail DNA and tail olive moment. Control: A549 cells without treatment; AgNPs 1.0, AgNPs 2.5 and AgNPs 5.0: A549 cells treated with 1.0, 2.5 and 5.0 µg/mL of AgNPs respectively; 5FU: A549 cells treated with 100 µg/mL of 5FU. Values are expressed as Mean ± SEM. Different letters indicate significant variation.
Antioxidants/oxidant status
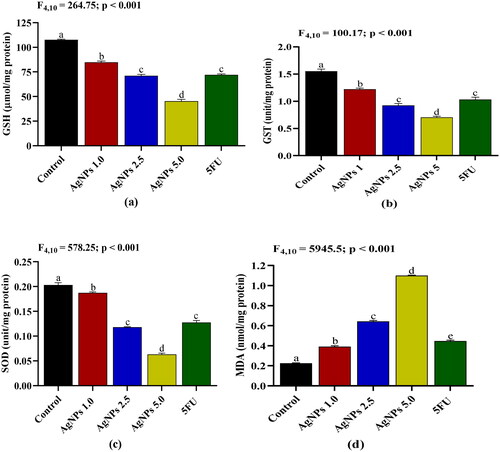
The level and activities of antioxidants and oxidants in A549 cells were measured after treatment with AgNPs. The treatment of cancer cells with AgNPs decreases the levels and activities of antioxidant in a dose-dependent manner when compared to untreated cells (). The reducing action of AgNPs (5 µg/mL) on the antioxidants activities was found to be significantly better than the standard 5FU (100 µg/mL). In order to determine whether AgNPs treatment affects intracellular oxidant levels, the level of lipid peroxidation (LPO) as an oxidative stress biomarker was measured. Consistent with the decreased antioxidant enzyme activities, oxidative stress levels increased significantly after AgNPs treatment of cancer cells. The increase in LPO was found to be dose dependent up to 5 μg/mL in response to AgNPs treatment ().
Figure 11. Effects of AgNPs on (a) glutathione (GSH) level; (b) glutathione-s-transferase (GST) activity; (c) superoxide dismutase (SOD) activity; and (d) lipid peroxidation (LPO) expressed in malondialdehyde (nmol/mg protein) in A549 cells after 24 h treatment. Control: A549 cells without treatment; AgNPs 1.0, AgNPs 2.5 and AgNPs 5.0: A549 cells treated with 1.0, 2.5 and 5.0 µg/mL of AgNPs respectively; 5FU: A549 cells treated with 100 µg/mL of 5FU. Values are expressed as Mean ± SEM. Different letters indicate significant variation.
Effect of AgNPs on the relative expression of pro-apoptotic and anti-apoptotic genes
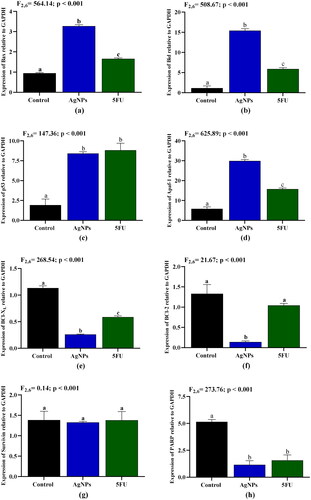
The relative mRNA expression levels of both pro-apoptotic (Bax, Bid, p53, and Apaf-1) and anti-apoptotic (BCl-XL, BCl-2, Survivin, and PARP) genes were assessed using qRT-PCR techniques. Treatment of A549 cells with AgNPs (2.5 μg/mL) for 24 h induced up-regulation of pro-apoptotic genes such as Bax, Bid, p53, and Apaf-1 by 3.5, 13.4, 4.4, and 5.2 folds, respectively, in comparison to the untreated control (). Moreover, anti-apoptotic genes including BCl-XL, BCl-2, and PARP were downregulated by 4.5, 9.6, and 4.5-fold relative to the untreated group ().
Figure 12. Effects of AgNPs on mRNA expression levels of (a) Bax; (b) Bid; (c) p53; (d) Apaf-1; (e) BCl- XL; (f) BCl-2; (g) Survivin and (h) PARP in A549 cells after 24 h treatment. Control: A549 cells without treatment; AgNPs: A549 cells treated with 2.5 µg/mL of AgNPs; 5FU: A549 cells treated with 100 µg/mL of 5FU. Values are expressed as Mean ± SEM. Different letters indicate significant variation.
Activation of caspase-3/6 by AgNPs on A549 cells
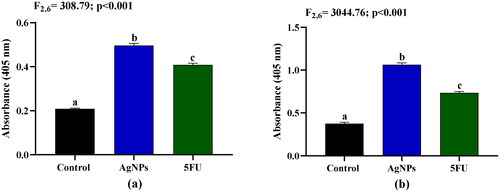
Caspase-3/6 plays a crucial role in the activation of apoptosis in cancer cells, and the effect of AgNPs on apoptosis in A549 cells was evaluated by assessing caspase-3/6 activity. Treatment of A549 cells with 2.5 µg/mL AgNPs resulted in a 2.4- and 2.9-fold increase in the activities of caspase-3 and caspase-6, respectively, compared to the untreated control (). The activity of caspase-3 was significantly higher in the AgNPs treated group than the standard drug 5FU.
Figure 13. Effects of AgNPs on activities of (a) Caspase-3 and (b) Caspase-6 in A549 cells after 24 h treatment. Control: A549 cells without treatment; AgNPs: A549 cells treated with 2.5 µg/mL of AgNPs; 5FU: A549 cells treated with 100 µg/mL of 5FU. Values are expressed as Mean ± SEM. Different letters indicate significant variation.
Discussions
Green synthesis of AgNPs has become an attractive therapeutic agent against several chronic diseases including cancer. The peak absorbance for AgNPs was observed at a wavelength of 459 nm, which can be attributed to the reduction of AgNO3 and the presence of surface plasmon resonance characteristics in silver. The presence of bioactive compounds was confirmed by FTIR analysis of AgNPs, in which we observed aromatic structure with double bond stretching and carbonyl groups existence with amide groups, confirming the reduction of silver ions to silver nanoparticles. SEM and TEM revealed that the biosynthesized AgNPs have a polydisperse spherical morphology. Nanoparticles have the potential to enhance the efficacy of many drugs by enabling targeted delivery to certain cells. In this regard, the application of silver nanoparticles as a coating material holds promise for recognising target cells and facilitating gene-targeted therapy. The cytotoxic effect of aqueous silver nanoparticles synthesised from Chaetomorpha linum has been found to be potent against HCT-116 cancer cells, which is consistent with our findings [Citation6]. The main features of the silver nanoparticles with plant extract includes reduced side effects and cytotoxicity at a relatively low concentration especially in cancer experimental models. Accelerated cell proliferation is one of the hallmarks of cancer. Thus, targeting the rapidly dividing cells seems most appropriate when searching for a novel anticancer agent. The silver nanoparticle synthesised using M. micrantha extract exhibit high antiproliferative activity against the lung cancer cells A549. Both AgNPs and M. micrantha extract have antiproliferative activities, however this action is enhanced when the two are combined and appears to show synergistic effect. An important criterion in considering an effective anticancer agent is the induction of apoptosis. The programmed cell death apoptosis is no doubt the preferred cell death mechanism for any cytotoxic agent. The biosynthesized AgNPs showed cytotoxic effects in A549 cells and triggers the apoptotic pathway. Upregulation of the pro-apoptotic genes and down regulation of the anti-apoptotic genes could imply that the biosynthesized AgNPs selectively target the apoptotic pathway. Whether the apoptotic pathway activated by the biosynthesized AgNPs is the intrinsic or extrinsic pathway needs more investigation, however, judging from our results, it is likely that the mitochondrial pathway is involved. This is because the balance of pro- and anti-apoptotic BCl-2 proteins can influence the susceptibility of cells to apoptotic stimuli. An over-abundance of pro-apoptotic BCl-2 proteins such as Bax at the mitochondrial surface generates the permeability transition (PT) pore, resulting in the hierarchical release of pro-apoptotic proteins such as cytochrome c, Smac/Diablo, and apoptosis-inducing factor (AIF) and the subsequent activation of caspase-3 and caspase-6 [Citation36]. In our study, significant increase in caspase-3 and caspase-6 activities in A549 cells following AgNPs treatment strongly suggested that AgNPs-induced apoptosis was carried out via a caspase-dependent pathway. The silver ions released by AgNPs were primarily responsible for caspase-3 and caspase-6 activation and oxidative stress.
Many anticancer agents currently in the market viz. such as doxorubicin, paclitaxel, vinblastine and some that are currently undergoing clinical trials induced a reactive oxygen species (ROS)-dependent apoptosis. Similarly, treatment of cancer cells with the biosynthesized AgNPs triggered a ROS induced apoptotic pathway. This is evident from the fact that treatment of A549 cells with the biosynthesized AgNPs leads to increased ROS in the cell and decreased antioxidant activities. It was found that the effect of AgNPs on the antioxidant/oxidant status of A549 cells was substantially more effective than that of 5FU. Despite the fact that effective antioxidants are essential for maintaining redox homeostasis, elevated antioxidant levels have been linked to cancer progression and chemoresistance. For instance, it has been observed that cancer cells with high glutathione levels exhibit increased neoplastic transformation [Citation37], drug resistance, and cancer therapy failure [Citation38]. It has been found that certain human cancer cells exhibit resistance to therapeutic intervention due to elevated activities of GST and SOD [Citation39]. Furthermore, AgNPs treatment also induced a significant elevation in lipid peroxidation levels, which could be mediated by a reduction in antioxidant activity that leads to an accumulation of cellular ROS (). The DNA damaging effects of AgNPs () correspond well with the elevation of lipid peroxidation in A549 cells treated with AgNPs since malondialdehyde, the end product of LPO, can generate mutagenic adducts that result in DNA damage [Citation40]. Redox imbalance is often the causative agent for apoptosis whereby too much ROS in the cells triggers the apoptotic pathway. Whether the biosynthesized AgNPs treatment by itself affects increased ROS production is not known, however, the increase in ROS due to AgNPs could be the result of inefficient antioxidant system caused by the treatment.
Conclusion
We report a reductive green synthesis of AgNPs using aqueous leaf extract of M. micrantha and its functional activities against the deadly disease cancer. Our study confirms the crystalline nature and characteristics of the biosynthesized AgNPs with the presence of elemental silver. Importantly, our study demonstrates the cytotoxic effects of AgNPs on human lung adenocarcinoma A549 cells by targeting the apoptotic pathway which is the preferred cell death pathway for any novel drug candidate. The involvement of apoptotic pathway was shown by the upregulation of pro-apoptotic genes and down-regulation of anti-apoptotic genes as well as activation of caspases. The biosynthesized AgNPs also activates the apoptotic pathway via increasing the ROS levels and decreased antioxidant levels. Our study therefore highlights an important role of the biosynthesized AgNPs prepared using M. micrantha leaf extract as a potential novel candidate for cancer therapy.
Authors’ contributions
FL: Investigation, Formal analysis and Writing – Original Draft. SLR: Analysis of data related to characterisations of silver nanoparticles, Review and Editing of manuscript. FN: Investigation, Data analysis and preparation of first draft of the manuscript. JVLR: Analysis of data related to characterisations of silver nanoparticles. LT: Formal analysis, Review and Editing of final manuscript. AKT: Investigation and formal analysis. RL: Supervision, Data analysis, Review and Editing of final manuscript. ZS: Conceptualisation, Investigation, Data analysis, Supervision, Writing – Review and Editing. The published version of the manuscript has been read and approved by all authors.
Acknowledgements
The authors thank the University Grant Commission, Ministry of Tribal Affairs, Government of India, for providing fellowship to Fanai Lalsangpuii (201920-NFST-MIZ-02751). The authors also thank the Department of Science and Technology (DST), Government of India, for providing Inspire fellowship to Fanai Nghakliana (DST/INSPIRE Fellowship/[IF190903]). The authors thanks Department of Biotechnology (DBT), New Delhi, Government of India sponsored Advanced Level State Biotech Hub (BT/NER/143/SP44475/2021) at Mizoram University for the equipment’s and Infrastructure supports.
Disclosure statement
No potential conflict of interest was reported by the author(s).
Data availability statement
The article contains all the data necessary to understand the conclusions of this investigation.
Additional information
Funding
References
- Al-Sheddi ES, Farshori NN, Al-Oqail MM, et al. Anticancer potential of green synthesized silver nanoparticles using extract of Nepeta deflersiana against human cervical cancer cells (HeLA). Bioinorg Chem Appl. 2018;2018:9390784–9390712. doi:10.1155/2018/9390784.
- Fageria L, Pareek V, Dilip RV, et al. Biosynthesized protein-capped silver nanoparticles induce ROS-dependent proapoptotic signals and prosurvival autophagy in cancer cells. ACS Omega. 2017;2(4):1489–1504. doi:10.1021/acsomega.7b00045.
- Pallavi SS, Rudayni HA, Bepari A, et al. Green synthesis of silver nanoparticles using Streptomyces hirsutus strain SNPGA-8 and their characterization, antimicrobial activity, and anticancer activity against human lung carcinoma cell line A549. Saudi J Biol Sci. 2021;29(1):228–238. doi:10.1016/j.sjbs.2021.08.084.
- Gurunathan S, Han JW, Eppakayala V, et al. Cytotoxicity of biologically synthesized silver nanoparticles in MDA-MB-231 human breast cancer cells. Biomed Res Int. 2013;2013:535796. doi:10.1155/2013/535796.
- Xu L, Wang YY, Huang J, et al. Silver nanoparticles: synthesis, medical applications and biosafety. Theranostics. 2020;10(20):8996–9031. doi:10.7150/thno.45413.
- Acharya D, Satapathy S, Somu P, et al. Apoptotic effect and anticancer activity of biosynthesized silver nanoparticles from marine algae Chaetomorpha linum extract against human colon cancer cell HCT-116. Biol Trace Elem Res. 2021;199(5):1812–1822. doi:10.1007/s12011-020-02304-7.
- Wypij M, Jędrzejewski T, Trzcińska-Wencel J, et al. Green synthesized silver nanoparticles: antibacterial and anticancer activities, biocompatibility, and analyses of surface-attached proteins. Front Microbiol. 2021;12:632505. doi:10.3389/fmicb.2021.632505.
- Lalsangpuii F, Rokhum SL, Nghakliana F, et al. Green synthesis of silver nanoparticles using Spilanthes acmella leaf extract and its antioxidant-mediated ameliorative activity against doxorubicin-induced toxicity in Dalton’s lymphoma ascites (DLA)-bearing mice. ACS Omega. 2022;7(48):44346–44359. doi:10.1021/acsomega.2c05970.
- Devanesan S, AlSalhi MS. Green synthesis of silver nanoparticles using the flower extract of Abelmoschus esculentus for cytotoxicity and antimicrobial studies. Int J Nanomedicine. 2021;16:3343–3356. doi:10.2147/IJN.S307676.
- Ríos E, León A, Chávez MI, et al. Sesquiterpene lactones from Mikania micrantha and Mikania cordifolia and their cytotoxic and anti-inflammatory evaluation. Fitoterapia. 2014;94:155–163. doi:10.1016/j.fitote.2014.02.006.
- Saikia S, Tamuli KJ, Narzary B, et al. Chemical characterization, antimicrobial activity, and cytotoxic activity of Mikania micrantha Kunth flower essential oil from North East India. Chem Pap. 2020;74(8):2515–2528. doi:10.1007/s11696-020-01077-6.
- Li Y, Li J, Wang XX, et al. Antimicrobial constituents of the leaves of Mikania micrantha H. B. K. PLoS One. 2013;8(10):e76725. doi:10.1371/journal.pone.0076725.
- Sheam M, Haque Z, Nain Z. Towards the antimicrobial, therapeutic and invasive properties of Mikania micrantha Knuth: a brief overview. J Adv Biotechnol Exp Ther. 2020;3(2):92–101. doi:10.5455/jabet.2020.d112.
- Ishak AH, Shafie NH, Esa NM, et al. From weed to medicinal plant: antioxidant capacities and phytochemicals of various extracts of Mikania micrantha. IJAB. 2018;20(03):561–568. doi:10.17957/IJAB/15.0522.
- Nayak SK, Maharana M, Jagat S, et al. Anti-bacterial potential and qualitative phytochemical analysis of an invasive alien plant Mikania micrantha Kunth found in Dhenkanal district of Odisha, India. Int J Pharm Sci Rev Res. 2017;4:53–58.
- Dou X, Zhang Y, Sun N, et al. The anti-tumor activity of Mikania micrantha aqueous extract in vitro and in vivo. Cytotechnology. 2014;66(1):107–117. doi:10.1007/s10616-013-9543-9.
- Mosmann T. Rapid colorimetric assay for cellular growth and survival: application to proliferation and cytotoxicity assays. J Immunol Methods. 1983;65(1-2):55–63. doi:10.1016/0022-1759(83)90303-4.
- Khan MS, Alomari A, Tabrez S, et al. Anticancer potential of biogenic silver nanoparticles: a mechanistic study. Pharmaceutics. 2021;13(5):707. doi:10.3390/pharmaceutics13050707.
- Chang X, Wang X, Li J, et al. Silver nanoparticles induced cytotoxicity in HT22 cells through autophagy and apoptosis via PI3K/AKT/mTOR signaling pathway. Ecotoxicol Environ Saf. 2021;208:111696. doi:10.1016/j.ecoenv.2020.111696.
- Franken NA, Rodermond HM, Stap J, et al. Clonogenic assay of cells in vitro. Nat Protoc. 2006;1(5):2315–2319. doi:10.1038/nprot.2006.339.
- Kasibhatla S, Amarante-Mendes GP, Finucane D, et al. Acridine orange/ethidium bromide (AO/EB) staining to detect apoptosis. Cold Spring Harb Protoc. 2006;3:4493.
- Singh NP, McCoy MT, Tice RR, et al. A simple technique for quantitation of low levels of DNA damage in individual cells. Exp Cell Res. 1988;175(1):184–191. doi:10.1016/0014-4827(88)90265-0.
- Lowry OH, Rosebrough NJ, Farr AL, et al. Protein measurement with the folin phenol reagent. J Biol Chem. 1951;193(1):265–275. doi:10.1016/S0021-9258(19)52451-6.
- Moron MS, Depierre JW, Mannervik B. Levels of glutathione, glutathione reductase and glutathione S-transferase activities in rat lung and liver. Biochim Biophys Acta. 1979;582(1):67–78. doi:10.1016/0304-4165(79)90289-7.
- Beutler E. Red cell metabolism, a manual of biochemical methods. 3rd ed. New York: Grune Startton; 1984. p. 133.
- Fried R. Enzymatic and non-enzymatic assay of superoxide dismutase. Biochimie. 1975;57(5):657–660. doi:10.1016/S0300-9084(75)80147-7.
- Buege JA, Aust SD. Biomembranes - part C: biological oxidations. Methods Enzymol. 1978;52:302–310.
- Livak KJ, Schmittgen TD. Analysis of relative gene expression data using real-time quantitative PCR and the 2(–ddC(T)) method. Methods. 2001;25(4):402–408. doi:10.1006/meth.2001.1262.
- Bradford MM. A rapid and sensitive method for the quantitation of microgram quantities of protein utilizing the principle of protein-dye binding. J Anal Chem. 1976;72:248–254.
- Widatalla HA, Yassin LF, Alrasheid AA, et al. Green synthesis of silver nanoparticles using green tea leaf extract, characterization and evaluation of antimicrobial activity. Nanoscale Adv. 2022;4(3):911–915. doi:10.1039/d1na00509j.
- Shahzadi I, Aziz Shah SM, Shah MM, et al. Antioxidant, cytotoxic, and antimicrobial potential of silver nanoparticles synthesized using Tradescantia pallida extract. Front Bioeng Biotechnol. 2022;10:907551. doi:10.3389/fbioe.2022.907551.
- Biswas A, Vanlalveni C, Adhikari PP, et al. Green biosynthesis, characterisation and antimicrobial activities of silver nanoparticles using fruit extract of Solanum viarum. IET Nanobiotechnol. 2018;12(7):933–938. doi:10.1049/iet-nbt.2018.0050.
- Bhakya S, Muthukrishnan S, Sukumaran M, et al. Biogenic synthesis of silver nanoparticles and their antioxidant and antibacterial activity. Appl Nanosci. 2016;6(5):755–766. doi:10.1007/s13204-015-0473-z.
- Ahmed S, Ikram S. Silver nanoparticles: one pot green synthesis using terminalia arjuna extract for biological application. J. Nanomed. Nanotechnol. 2015;6(4):309. doi:10.4172/2157-7439.1000309.
- Parveen M, Ahmad F, Malla AM, et al. Microwave-assisted green synthesis of silver nanoparticles from Fraxinus excelsior leaf extract and its antioxidant assay. Appl Nanosci. 2016;6(2):267–276. doi:10.1007/s13204-015-0433-7.
- Bidian C, Filip GA, David L, et al. Green synthesized gold and silver nanoparticles increased oxidative stress and induced cell death in colorectal adenocarcinoma cells. Nanomaterials. 2023;13(7):1251. doi:10.3390/nano13071251.
- Hayes JD, Dinkova-Kostova AT, Tew KD. Oxidative stress in cancer. Cancer Cell. 2020;38(2):167–197. doi:10.1016/j.ccell.2020.06.001.
- Kennedy L, Sandhu JK, Harper M-E, et al. Role of glutathione in cancer: from mechanisms to therapies. Biomolecules. 2020;10(10):1429. doi:10.3390/biom10101429.
- Gupta N, Verma K, Nalla S, et al. Free radicals as a double-edged sword: the cancer preventive and therapeutic roles of curcumin. Molecules. 2020;25(22):5390. doi:10.3390/molecules25225390.
- Yui K, Imataka G, Shiohama T. Lipid peroxidation via regulating the metabolism of docosahexaenoic acid and arachidonic acid in autistic behavioral symptoms. Curr Issues Mol Biol. 2023;45(11):9149–9164. doi:10.3390/cimb45110574.