
Abstract
The main purpose of this study was to explore the changes of biomarkers in different developmental stages of bleomycin-induced pulmonary fibrosis (PF) in rats via comprehensive pathophysiology, UPLC-QTOF/MS metabonomic technology, and 16S rRNA gene sequencing of intestinal microbiota. The rats were randomly divided into normal control and 1-, 2- and 4-week model group. The rat model of PF was established by one-time intratracheal instillation of bleomycin. The levels of inflammatory and fibrosis-related factors such as hydroxyproline (HYP), type III procollagen (COL-III), type IV collagen (COL-IV), hyaluronidase (HA), laminin (LN), interleukin (IL)-1β, IL-6, malondialdehyde (MDA) increased and superoxide dismutase (SOD) decreased as the PF cycle progressed. In the 1-, 2- and 4-week model group, 2, 19 and 18 potential metabolic biomarkers and 3, 16 and 12 potential microbial biomarkers were detected, respectively, which were significantly correlated. Glycerophospholipid metabolism pathway was observed to be an important pathway affecting PF at 1, 2 and 4 weeks; arginine and proline metabolism pathways significantly affected PF at 2 weeks. Linoleic acid metabolism pathway exhibited clear metabolic abnormalities at 2 and 4 weeks of PF, and alpha-linolenic acid metabolism pathway significantly affected PF at 4 weeks.
KEY MESSAGES
In this study, metabolomics technology and intestinal microbiota 16S rRNA gene sequencing were used to search for biomarkers with significant differences in each stage of pulmonary fibrosis. Finally, the variation characteristics of each stage of the disease were discussed. The hope is to provide new insights into the development of diagnostic biomarkers and potential therapeutic targets at all stages.
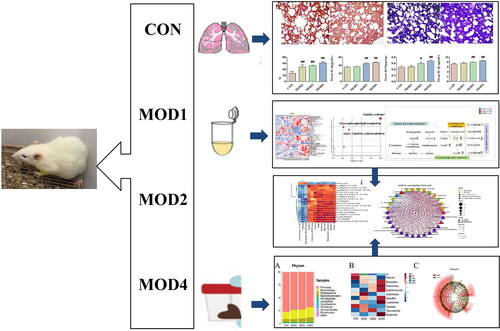
GRAPHICAL ABSTRACT
Introduction
Pulmonary fibrosis (PF) is a progressive pulmonary interstitial disease that gradually develops from chronic inflammatory disease to fibrosis, which can lead to loss of lung function and eventually, death [Citation1]. As the disease develops, the patients have cough, chest tightness, poor breathing, asthma and other symptoms. The median survival period of PF is approximately 2–3 years, and the 5-year survival rate is <30% [Citation2,Citation3]. At the same time, the incidence of lung cancer in patients with PF is five times more than that in other people [Citation4]. The chest imaging of patients with COVID-19 pneumonia, which has attracted much attention, is also highly similar to that of patients with PF [Citation5,Citation6]. Early and diversified diagnosis for PF is a global challenge. The pathogenesis and mechanism of PF are complex and not completely clear. The disease progression is generally attributed to the persistent damage of pulmonary epithelial cells, and the abnormally activated pulmonary epithelial cells promote the migration, proliferation and differentiation of fibroblasts into active myofibroblasts. The extracellular matrix secreted by these myofibroblasts is deposited in the lung, thus reshaping the structure of the lung [Citation7]. At present, the blood test results for the diagnosis of PF still lack specificity, and lung biopsy is currently the standard for the diagnosis of PF [Citation8]. Studying the progression of PF can help in understanding the characteristics of various stages of PF and provide new insights for the early diagnosis and potential targeted treatment.
Metabonomics integrates high-throughput data, analyses the close relationship between the change in the metabolite content and phenotype, and fully explores the biological significance of these data [Citation9,Citation10]. Metabonomic analysis can reflect the changes in metabolites of organisms in different states and reveal the overall functional state of organisms in a specific time and environment [Citation11]. Currently, it is often used to explain the pathophysiological process of disease progression and identify new diagnostic or prognostic biomarkers [Citation12]. Intestinal microbiota is a complex community composed of trillions of bacteria in the gastrointestinal tract. It participates in human nutrition absorption, energy supply and immune regulation. Therefore, intestinal microbiota is considered a metabolic organ and has become the core factor affecting human health and disease [Citation13,Citation14]. Biomarkers are indicators of significant changes in cells at the individual or population level, which can provide important reference value for disease prevention, treatment and prognosis [Citation15]. Several studies have reported that the imbalance of intestinal microbiota is related to changes in the health of the host. The imbalance of intestinal microbiota can lead to the damage to intestinal barrier, and bacterial translocation can aggravate the lung immune damage [Citation16]. Some studies have reported that pulmonary bacteria can change intestinal microecology through blood circulation and immune response, and in turn, intestinal microbiota can affect pulmonary immunity by regulating innate and adaptive immunity [Citation17]. The interaction between different lung diseases and changes in intestinal microenvironment, resulting in the lung gut axis theory [Citation18]. Intestinal microbiota binding metabonomic analysis has been widely used to study various diseases, such as neurodegenerative disease [Citation19], cardiovascular diseases [Citation20], chronic kidney disease [Citation21] and lung cancer [Citation22]. The combined analysis of metabonomics and intestinal microbiota is more systematic, comprehensive and holistic in exploring the development of diseases.
In this study, we established a rat model of PF by intratracheal instillation of bleomycin. Such PF model is relatively close to the PF in humans. At present, bleomycin is widely used to induce PF [Citation23,Citation24]. UPLC-QTOF/MS was performed to analyse the metabolic profile of serum samples. Various metabolites in different stages of PF were screened and identified, and their important metabolic pathways were explored. Further, 16S rDNA high-throughput sequencing of intestinal microbiota was conducted. The significantly different microbiota at various stages of PF was identified. Finally, the characteristics of changes in each stage of the disease were explored to provide new insights for developing diagnostic biomarkers and potential therapeutic targets at each stage.
Materials and methods
Chemicals and reagent
Bleomycin for injection (Beijing Kulaibo Technology Co., LTD., Beijing, China). Enzyme-linked immunosorbent assay (ELISA) kits for type III procollagen (COL-III), type IV collagen (COL-IV), hyaluronidase (HA), laminin (LN), interleukin (IL)-1β, IL-6, superoxide dismutase (SOD), malondialdehyde (MDA) and hydroxyproline (HYP) kit (Nanjing Jiancheng Technology Co., LTD., Nanjing, China). Methanol, acetonitrile and formic acid (HPLC grade) (Fisher, America). E.Z.N.A.® Stool DNA Kit (Omega, USA), AMPure XT beads (Beckman Coulter Genomics, Danvers, MA) and the Library Quantification Kit for Illumina (Kapa Biosciences, Woburn, MA).
Establishment of PF model in rats
Overall, 40 SPF-grade male Sprague–Dawley (SD) rats (weight 180–250 g), were purchased from the Department of Medical Sciences of Peking University (Department of Experimental Animal Science, licence number: SCXK [Beijing] 2017-0005). The feeding environment was well ventilated, with room temperature (22–26 °C), relative humidity of 40% ± 5% and 12 h light/dark cycle. Each animal had free access to food and water. The experimental procedure was approved by the Medical Ethics Committee of Baotou Medical College, Inner Mongolia University of Science and Technology (20170317).
In total, 40 SD rats were randomly divided into four groups after 1 week of feeding: normal (CON), 1-week model (MOD1), 2-week model (MOD2) and 4-week model (MOD4) groups. The rats in the MOD1, 2, 4 groups received bleomycin slowly through the space between the tracheal cartilage rings to establish the PF model. Further, the rats had free access to diet, and we observed them for their basic condition and death.
Specimen collection
Model group rats were sampled at weeks 1, 2 and 4, and normal group rats were sampled at week 4. In total, 40 rats were anaesthetized by intraperitoneal injection of 3% pentobarbital sodium 24 h after the last administration. After anaesthesia, the rats were fixed in supine position; their abdominal cavity was cut, and blood from the abdominal aorta was collected. Serum samples were stored at −80 °C until further metabolomics research. The caecum of rats was immediately removed and the contents were collected and stored at −80 °C for DNA extraction to study the intestinal microbiota. The complete rat lung tissue was collected. A proper amount of lung tissue was fixed with 4% paraformaldehyde solution for haematoxylin-eosin staining (HE) and Masson staining. A proper amount of lung tissue was stored at −80 °C for the detection of biochemical indicators.
Determination of biochemical indicators and pathological analysis
The levels of HYP, COL-III, COL-IV, HA, LN, IL-6, MDA, IL-1β and SOD in lung tissue homogenate were detected according to the kit instructions. The paraffin-embedded lung tissue was cut into 3–4-μm thick section and stained with HE and Masson staining. The pathological changes were observed.
Metabolomic analysis
Six rats in each group were randomly selected for metabolomics analysis. An ACQUITY UPLC T3 column (100 mm × 2.1 mm, 1.8 µm, Waters, UK) was used for the reversed-phase separation. The experimental details were as follows: mobile phase solvent A: water and 0.1% formic acid, solvent B: acetonitrile and 0.1% formic acid, flow rate: 0.4 mL·min−1, the column temperature: maintained at 35 °C. The gradient elution conditions were: 5% B, 0–0.5 min; 5–100% B, 0.5–7 min; 100% B, 7–8 min; 100–5% B, 8–8.1 min; and 5% B, 8.1–10 min. The TripleTOF5600 Plus system detects metabolites eluted from the column. The curtain gas pressure was set at 30 PSI. The ion source gas1 and gas2 pressure was set at 60 PSI. The interface heater temperature was 650 °C. For positive and negative ion modes, the ion spray floating voltage was set at 5000 and 4500 V, respectively. The mass spectrometry data were acquired using the IDA mode. In one acquisition cycle, the primary acquisition range was 60–1200 Da, and time was 150 ms. Further, the first 12 signal ions with a charge and signal accumulation intensity of >100 per s were selected from the primary spectrum for secondary fragmentation scanning, and the total cycle time was fixed at 0.56 s. Four time bins were summed for each scan at a pulser frequency of 11 kHz through monitoring the 40-GHz multichannel TDC detector with four-anode/channel detection. Dynamic exclusion was set for 4 s.
Metabolomic data analysis
The acquired LC-MS data pre-treatment was performed using XCMS software. Raw data files were converted into mzXML format and further processed using the XCMS, CAMERA and metaX toolbox included in R software. The secondary mass spectrum information was matched and identified with the in-house standard database and annotated with HMDB, KEGG and other databases. UPLC-Q-TOF/MS was used to collect data of serum samples. Principal component analysis (PCA), supervised partial least squares discriminant analysis (PLS-DA) and orthogonal projections to latent structures (OPLS-DA) were used to observe the clustering separation of each group after dimensionality reduction. The results of permutation test were used to determine the prediction ability and whether the model was overfitted. Significantly different metabolites between the normal and each model groups of PF were screened with the criteria variable importance in projection (VIP) > 1 and p < 0.05. Then analyse the changes of differential metabolites in each week using heat map. MetaboAnalyst software version 5.0 (https://www.metaboanalyst.ca) was used to analyse the metabolic pathway and screen the key metabolic pathway of PF in each week (impact > 0.1, −Log (P) > 2). According to the differential metabolites involved in these key metabolic pathways, key biomarkers for the progression of PF were screened.
16S rDNA high-throughput sequencing
Six rats in each group were randomly selected for intestinal microbiota analysis. DNA from different samples was extracted using the E.Z.N.A.®Stool DNA Kit. The total DNA was eluted in 50 μL of elution buffer and stored at −80 °C. The V3-V4 regions of 16S rRNA genes were amplified using PCR using the following primers: 341 F (5′-CCTACGGGNGGCWGCAG-3′) and 805 R (5′-GACTACHVGGGTATCTAATCC-3′). PCR amplification was performed in a total volume of 25 μL reaction mixture. The PCR conditions to amplify the prokaryotic 16S fragments consisted of an initial denaturation at 98 °C for 30 s, 32cycles of denaturation at 98 °C for 10 s, annealing at 54 °C for 30 s, and extension at 72 °C for 45 s and then final extension at 72 °C for 10 min. The PCR products were confirmed with 2% agarose gel electrophoresis. The amplicon pools were prepared for sequencing, and the size and quantity of the amplicon library were assessed using Agilent 2100 Bioanalyzer and the Library Quantification Kit for Illumina, respectively. The libraries were sequenced on NovaSeq PE250 platform. Paired-end reads were assigned to samples based on their unique barcode and truncated by cutting off the barcode and primer sequence. Paired-end reads were merged using FLASH.
Data analysis of intestinal microbiota
The high-quality clean tags were obtained using the fqtrim (version 0.94). After dereplication using DADA2, we obtained the feature table and feature sequence. Feature abundance was normalized using relative abundance of each sample. Alpha- and beta-diversities were obtained using QIIME2. Alpha diversity was used to analyse species richness and evenness, and Beta diversity was analysed for the difference in the composition and distribution of microbiota. The microbiota with higher abundance at phylum level and genus level were analysed by clustering heat map. Finally, LDA value >3, p < 0.05 were used for LEfSe analysis to screen out the different bacterial groups in each week.
Statistical analysis
Data were analysed using IBM SPSS Statistics version 2.0 (IBM SPSS Statistics, Armonk, NY). Data were expressed as means ± SD. Student’s t test was performed for the comparison of two groups. p < 0.05 was considered significant.
Results
Histopathological observation and determination of biochemical indicators
The results of HE and Masson staining of lung tissues of rats in all groups are given in . HE staining results revealed that compared with the normal group, inflammatory cell infiltration and collagen deposition were observed to a small extent in the lung parenchyma, and the alveolar structure was complete in the MOD1 group. In the MOD2 group, inflammatory cell infiltration increased and the pulmonary interstitial oedema was obvious. In the MOD4 group, inflammatory cells infiltration occurred to a great extent, alveolar structure basically disappeared, lung parenchyma was damaged in a large area and fibrosis was obvious. Masson staining can be used to evaluate collagen deposition in lung tissues. Compared with the CON group, the longer the PF cycle in the models, the more serious the collagen deposition in lung tissues and the more obvious the PF. The semiquantitative score that was used to evaluate the severity of PF increased significantly in the MOD1, MOD2 and MOD4 groups (p < 0.01) ().
Figure 1. The histopathological changes and biochemical indicators of lung tissues in the CON, MOD1, MOD2 and MOD4 groups. (A) Representative photomicrographs of HE and Masson staining (HE and Masson staining ×100). (B) Staining score and biochemical index results. *p < 0.05, **p < 0.01 vs. CON group (n = 10).
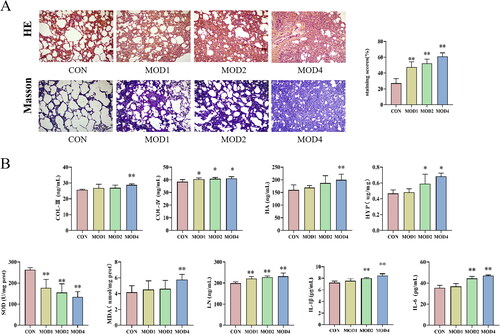
Biochemical indicators test results show each indicators changed gradually in the MOD1, MOD2 and MOD4 groups. Compared with CON group, LN (p < 0.01), COL-IV (p < 0.05) levels significantly increased and SOD (p < 0.05) activity decreased significantly in the MOD1 group; IL-6, IL-1β, LN, COL-IV and HYP levels significantly increased (p < 0.01; p < 0.05) and SOD (p < 0.05) activity decreased significantly in the MOD2 group; HYP, COL-III, IL-1β, HA, LN, IL-6, COL-III, MDA levels increased and SOD activity decreased significantly (p < 0.01; p < 0.05) in the MOD4 group ().
Assessment of progression of PF in rats based on metabonomics
Changes in the metabolic spectrum in rats with PF
UPLC-Q-TOF/MS was used to study the metabonomics of rat serum samples, which can be used to clearly observe the characteristics of change in the serum metabolic spectrum of rats with PF at different stages. Analyse 3 quality control (QC) samples before and after injection respectively, and then analyse one QC sample every 10 samples throughout the entire injection process to evaluate stability. The QC curves in the total ion flow chromatogram of QC samples under positive and negative ion modes were basically overlapped, indicating that the detection system was stable and the detection results were accurate (Figure S1). PCA showed that the separation between CON group and MOD1 group was not obvious; CON group was obviously separated from MOD2 and MOD4 group (). PLS-DA is a supervised difference discriminant analysis method, which can reflect the differences between different groups to the greatest extent. The PLS-DA scoring chart revealed that the separation of metabolites between MOD1 and CON groups was less obvious, while the separation between MOD2 and MOD4 and CON group was significant (). 3D PLS-DA score chart () could more clearly indicate the separation degree of the MOD1, MOD2 and MOD4 groups from the CON group. To further verify the separation of metabolic spectra at different evolutionary stages of PF, OPLS-DA was established. The MOD1, MOD2, MOD4 and CON groups in the OPLS-DA scoring chart () could be completely separated, and the permutation test results (Figure S2) revealed that the model was not overfitted and had good prediction ability.
Figure 2. PF progression (A) PCA score plot. (B) PLS-DA score plot. (C) 3D PLS-DA score plots. OPLS-DA score plot in rats at (D) week 1, (E) weeks 2, and (F) week 4 of PF. V-plot score plot in rats at (H) week 1, (I) weeks 2 and (G) week 4 of PF (n = 6).
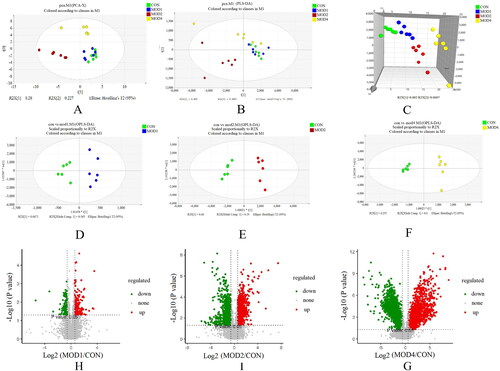
Screening of differential metabolites
Based on PLS-DA, V-plots score charts were prepared (). VIP value helps in assessing the importance of differential metabolites, and VIP > 1 and p < 0.05 are considered as the criteria to screen significantly different metabolites in each group. Compared with the CON group, 3, 30 and 25 differential metabolites, respectively, were obtained in the MOD1, MOD2 and MOD4 groups (). Next, we conducted cluster thermogram analysis on the abundance of the differential metabolites screened in the first, second and fourth weeks (). The MOD1, MOD2 and MOD4 groups were significantly separated from the CON group. Compared with the CON, the MOD1, MOD2 and MOD4 groups had 0, 11 and 3 downregulated differential metabolites and 3, 19 and 22 upregulated differential metabolites, respectively ().
Figure 3. (A) Heat map of the differential metabolites in all groups. Colour saturation indicates the amount of metabolite expression. (B) p Value heat map of the differential metabolites in all groups. Red and blue indicating a relative increase and decrease, respectively (n = 6).
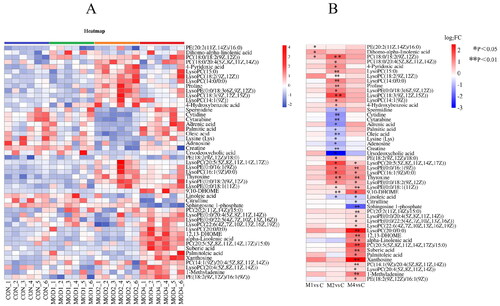
Table 1. Identification of differential metabolites at week 1 in rats with PF.
Table 2. Identification of differential metabolites at week 2 in rats with PF.
Table 3. Identification of differential metabolites at week 4 in rats with PF.
Metabolic pathway analysis
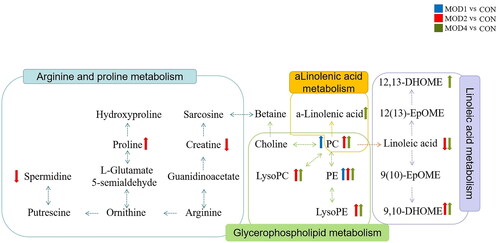
Metabolomics pathway analysis was conducted for 3, 30 and 25 differential metabolites in the MOD1 (), MOD2 () and MOD4 (Figure 4(C)) groups, respectively. According to impact > 0.1 and − Log (P) > 2, the key metabolic pathways from each week were screened. The Venn diagrams indicated overlapping and different pathways among the MOD1, MOD2 and MOD4 groups (). In the MOD1 group, glycerophospholipid metabolism pathway and two potential biomarkers participated in this pathway were screened. In the MOD2 group, three metabolic pathways, namely, glycerophospholipid metabolism, linoleic acid metabolism and arginine and proline metabolism, were screened involving 19 potential biomarkers. In the MOD4 group, three metabolic pathways including glycerophospholipid metabolism, linoleic acid metabolism and alpha-linolenic acid metabolism were screened with 18 potential biomarkers. The Venn diagram of the differential potential biomarkers in the metabolic pathways in the groups is given in . The MOD1 and MOD2 groups shared one biomarker, namely, phosphatidylcholine (PC) (18:0/18:2(9Z,12Z)). The MOD2 and MOD4 groups shared 7 biomarkers, namely, lysophosphatidylethanolamine (LysoPE) (0:0/18:2(9Z,12Z)), LysoPE (0:0/18:1(11Z)), LysoPE (0:0/16:1(9Z)), lysophosphatidylcholine (LysoPC) (20:5(5Z,8Z,11Z,14Z,17Z)), LysoPC (16:1(9Z)/0:0), linoleic acid and 9,10-DHOME. The above eight metabolites exhibited significant differences in two time periods and may be important biomarkers affecting the progression of PF. The metabolic pathway network diagram of PF () clearly demonstrated that these four metabolic pathways were interrelated. PC and phosphatidylethanolamine (PE) were significantly upregulated in the MOD1, MOD2 and MOD4 groups. LysoPE, LysoPC and 9,10-DHOME were significantly upregulated and linoleic acid was significantly downregulated in the MOD2, and MOD4 groups. Spermidine and creatine were significantly downregulated and proline was significantly upregulated only in the MOD2 group. 12,13-DHOME was significantly upregulated only in the MOD4 group.
Figure 4. Metabolic pathway analysis of the differential metabolites in the MOD1 (A), MOD2 (B) and MOD4 (C) groups. Venn diagram of (D) metabolic pathways in each group and (E) potential biomarkers in metabolic pathways in each group (n = 6).
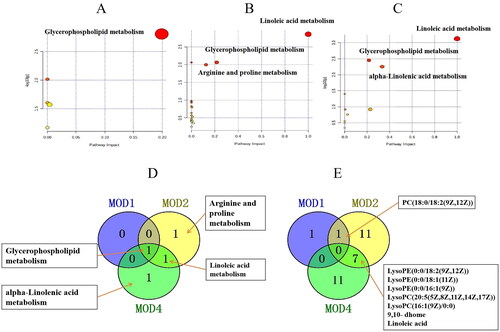
Figure 5. Network of metabolic pathways in PF.
Progression of PF in rats based on the analysis of intestinal microbiota
Evaluation of diversity of intestinal microbiota in rats with PF
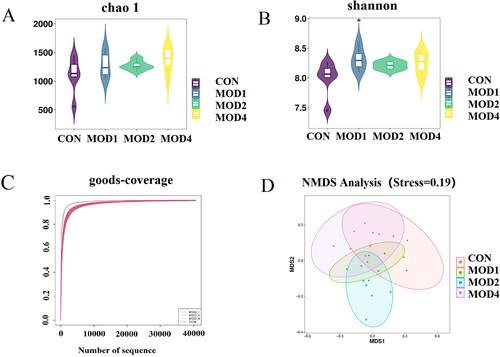
16S rRNA gene sequencing method was used to analyse the microbial composition of rat faeces and the feature data obtained were annotated at multiple levels to obtain the bacterial species and their abundance. Alpha-diversity focuses on the evenness and diversity of species. Chao1 index reflects the species richness in the sample. Shannon index reflects the species richness and evenness, and the Good’s coverage index reflects the sequencing depth of the sample. The results revealed that the Chao1 (Figure 6(A)) and Shannon () indicators of the MOD1, MOD2 and MOD4 groups increased compared with the CON group, indicating that the richness and evenness of intestinal microorganisms in model group of rats increased, the diversity increased. Good’s coverage index () was close to 1, reflecting that the sequencing depth of the sample fully covered all species in the sample. Beta-diversity can reflect the difference in the composition and distribution of microbiota between groups. Non-Metric Multi-Dimensional Scaling (NMDS) was used to evaluate the beta-diversity among groups (). The results showed that there were different degrees of separation between the MOD1, 2, 4 groups and the CON group, and the overall intestinal microbial composition of rats in each group was different.
Figure 6. Analysis of diversity of intestinal microbiota in PF. (A) Chao1 indicator, (B) Shannon indicator, (C) Good’s coverage indicator, (D) NMDS analysis of the CON, MOD1, 2, 4 groups (n = 6) *p < 0.05 vs. CON group.
Analysis of differential intestinal microbiota at phylum and genus levels
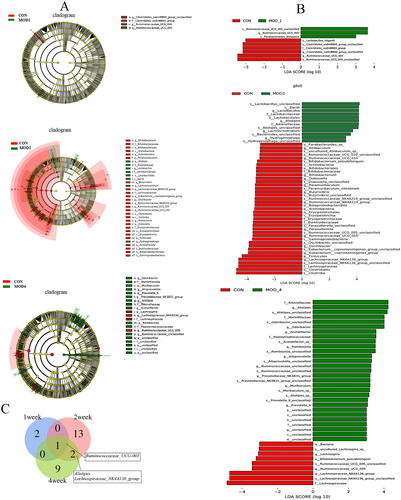
According to the species abundance and species annotation tables, the top 10 species with the highest abundance at the phylum level and top 30 species with the highest abundance at the genus level were selected to plot the bar chart of species abundance () and clustering heat map (). Firmicutes, Bacteroidetes and Proteobacteria were the dominant microbiota at the phylum level. Firmicutes_unclassified, Lachnospiraceae_NK4A136_group, Muribaculaceae_unclassified, Lachnospiraceae_unclassified and Intestinimonas were the dominant microbiota at the genus level. To distinguish the characteristics of intestinal microbiota in rats with PF more clearly at different time periods, we conducted a statistically significant and biologically relevant LDA effect size (LEfSe) analysis. The LEfSe analysis () shows the differential microbiota with LDA value > 3 and p < 0.05 in the MOD1, MOD2 and MOD4 groups, compared with CON group. PF changed the intestinal microbiota of rats, and the intestinal microbiota structure was different during different stages of PF. We found at the genus level, the abundance of Ruminococcaceae_UCG-005 significantly increased, Ruminococcaceae_UCG-004, Clostridiales_vadinBB60_group_unclassified significantly decreased in the MOD1 group,; in the MOD2 group, the abundance of Alistipes, Hydrogenophaga, Lachnoclostridium, Lactobacillus significantly increased and that of Oscillibacter, Bifidobacterium, Ruminococcaceae_NK4A214_group, Eubacterium]_coprostanoligenes_group, Butyrivibrio, Paramuribaculum, Lachnospiraceae_NK4A136_group, Dubosiella, Allobaculum, Ruminococcaceae_UCG-005, Parasutterella, Ruminococcaceae_UCG-010 significantly decreased. In the MOD4 group, the abundance of Alistipes, Odoribacter, Acetatifactor, Romboutsia, Alloprevotella, Ruminococcaceae_unclassified, Prevotellaceae_NK3B31_group, Muribaculum, Prevotella_9 significantly increased and the abundance of Lachnospiraceae_NK4A136_group, Ruminococcaceae_UCG-005, Lachnospira significantly decreased. Venn diagram () shows that 3, 16 and 12 microbial biomarkers were found at the 1, 2 and 4 weeks of PF. In addition, Ruminococcaceae_UCG-005 are common microbial biomarkers at 1, 2 and 4 weeks of PF, while Lachnospiraceae_NK4A136_group and Alistipes are common microbial biomarkers of 2 and 4 weeks.
Figure 7. Species composition and cluster analysis of intestinal flora in the course of pulmonary fibrosis in rats (A) The top 10 phylum of intestinal microbiome (B)The heat map of the top 10 phylum; (C) Species composition of the top 30 genera (D) Heatmap of the top 30 genera (n = 6).
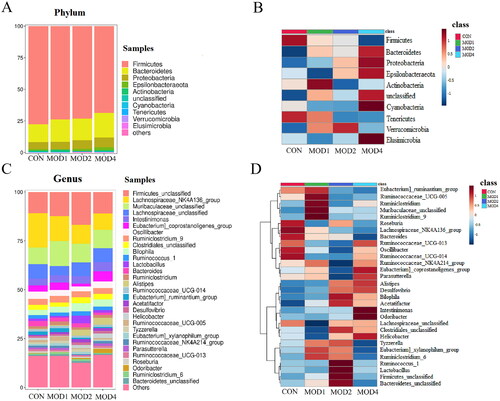
Figure 8. (A) LEfSe analysis and (B) LDA value distribution histogram of PF rats in each group; (C) Venn diagram of bacterial biomarkers in each week (n = 6).
Correlation analysis of metabonomics and intestinal microbiota in rats with PF
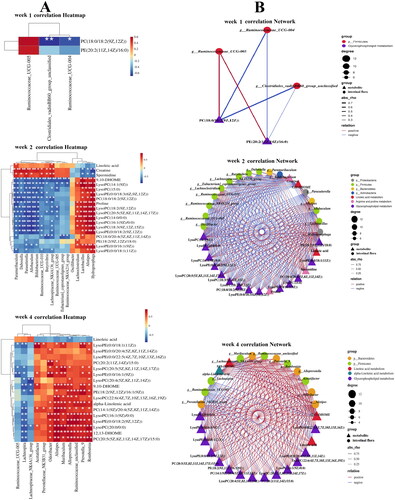
Spearman’s correlation analysis was conducted on key metabolic biomarkers and microbial biomarkers affecting PF. As shown in the , at 1 week, PC(18:0/18:2(9Z,12Z)), PE(20:2(11Z,14Z)/16:0) was negatively correlated with Ruminococcaceae_UCG-004, Clostridiales_vadinBB60_group_unclassified and positively correlated with Ruminococcaceae_UCG-005. At 2 weeks, the PF biomarkers PC, PE, LysoPE, LysoPC, proline and 9,10-DHOME, were positively correlated with Lactobacillus, Alistipes, Hydrogenophaga, Lachnoclostridium and negatively correlated with Dubosiella, Parasutterella, Allobaculum, Bifidobacterium, Butyrivibrio, Lachnospiraceae_NK4A136_group, Parasutterella, Ruminococcaceae_UCG-010, Ruminococcaceae_UCG-005, Eubacterium]_coprostanoligenes_group, Ruminococcaceae_NK4A214_group. The PF biomarkers Creatine, Spermidine andLinoleic acid were negatively correlated with Lactobacillus, Alistipes, Hydrogenophaga, Lachnoclostridium and positively correlated with Dubosiella, Parasutterella, Allobaculum, Bifidobacterium, Butyrivibrio, Lachnospiraceae_NK4A136_group, Parasutterella, Ruminococcaceae_UCG-010, Ruminococcaceae_UCG-005, Eubacterium]_coprostanoligenes_group and Ruminococcaceae_NK4A214_group. At 4 weeks of PF, Alistipes, Odoribacter, Acetatifactor, Romboutsia, Alloprevotella, Ruminococcaceae_unclassified, Prevotellaceae_NK3B31_group, Muribaculum and Prevotella_9 were positively correlated with 12,13-DHOME, 9,10-DHOME, alpha-Linolenic acid, LysoPC, LysoPE, PE, PC and negatively correlated with Linoleic acid; Ruminococcaceae_UCG-005, Lachnospiraceae_NK4A136_group, Lachnospira were positively correlated with Linoleic acid, and negatively correlated with 12,13-DHOME, 9,10-DHOME, alpha-Linolenic acid, LysoPC, LysoPE, PE and PC. The results indicated that a significant correlation existed between the significantly different metabolites and intestinal microbiota in rats with PF.
Figure 9. (A) Heat map of the relationship between key differential metabolites and key intestinal microbiota in rats with PF in each week. Red and blue indicate positive and negative correlations, respectively. (B) Correlation network of potential biomarkers in each week of PF rats (n = 6) *p < 0.05, **p < 0.01.
Discussion
PF is a complex and progressive pathological process. UPLC-Q-TOF/MS metabonomics technology and 16S rRNA intestinal microbiota detection technology can help to screen significant biomarkers. With the progression of the disease, we can observe the changes in metabolites and biomarkers of intestinal microbiota at various stages, as well as their relationships.
In the pharmacodynamics analysis, we detected the levels of HYP, COL-III, COL-IV, HA, LN, IL-1β, IL-6, MDA and SOD in various stages of PF. It is well known that PF is mainly caused by the proliferation and differentiation of pulmonary fibroblasts into myofibroblasts; this is stimulated by various inflammatory factors and profibrosis factors secreted by cells after lung injury, thus increasing the deposition of extracellular matrix mainly composed of collagen fibres, to form fibrosis [Citation25]. Collagen is the main component of collagen fibre. HYP levels can be considered to evaluate the characteristic amino acid of collagen [Citation26] and reflect the content of collagen fibre. The elevated level of COL-III is associated with the progression of PF [Citation27]. COL-IV, the main component of basement membrane, is crucial for the development of alveolar myofibroblast [Citation28]. HA is the main component of extracellular matrix and participates in biological processes such as cell matrix signal transduction, inflammation, cell proliferation and migration [Citation29]. At the early stage of bleomycin-induced PF in rats, pulmonary fibroblasts were activated, resulting in excessive accumulation of HA in the lungs [Citation30]. LN is a major protein that constitutes the extracellular matrix. During PF, LN levels increase significantly [Citation31], promoting the expression of inflammatory factors and generation of collagen fibres [Citation32]. IL-6 participates in inflammation and PF by inducing Th1 cell response [Citation33]. IL-1β activating inflammatory bodies and other pathways participate in the formation of lung fibres [Citation34]. The levels of HYP, COL-III, COL-IV, HA, LN, IL-6, MDA and IL-1β increased as the PF cycle advanced, and the content of SOD decreased with the increase of PF period. These results indicated that inflammation and fibrosis increases with the increase in time. The antioxidant capacity decreased with the increase of moulding time.
The metabonomic analysis revealed the changes in significantly different metabolites, during the occurrence and development of PF and the changes in important metabolic pathways, including glycerophospholipid metabolism, linoleic acid metabolism, arginine and proline metabolism and alpha-linolenic acid metabolism.
Glycerophospholipid is the main component of cell membrane and has an important influence on cell function [Citation35]. Important differential metabolites in the progression of PF, such as phosphatidylcholine (PC), PE, LysoPE, and LysoPC, are involved in glycerol phospholipid metabolism. LysoPC is the precursor to lysophosphatidic acid. Lysophosphatidic acid can induce PF by mediating vascular leakage and fibroblast migration and proliferation [Citation36]. PC and PE, the key lipids of pulmonary surfactant, were reported to be significantly increased in PF [Citation37, Citation38], which was consistent with our study. Glycerophospholipid metabolism is involved in the occurrence and development of PF at 1, 2 and 4 weeks.
When a cell is damaged, a large amount of arginase is released from the cell. Arginine generates a large amount of proline in the presence of ornithine aminotransferase and 5-carboxylate pyrroline reductase pathways or generates spermidine in the presence of ornithine decarboxylase [Citation39]. Proline and its metabolite HYP constitute one third of the amino acids in collagen [Citation40]. Proline participates in redox regulation and cell proliferation and differentiation and is a key regulator of various biochemical and physiological processes of cells [Citation41]. Its level is significantly increased in PF. Targeted proline synthesis can inhibit matrix production in PF [Citation42]. Spermidine can resist oxidation; inflammation; and regulate cell proliferation, differentiation and apoptosis. Some studies have reported that exogenous spermidine supplementation may have beneficial effects on the resistance to PF [Citation43]. Arginine can be methylated by guanidinoacetic acid to form creatine with antioxidant and anti-inflammatory properties [Citation44,Citation45]. Our study indicated that in theMOD2 group, proline level was significantly increased and spermidine and creatine levels were significantly decreased. They may have an important effect at 2 weeks of PF by participating in arginine and proline metabolism.
Linoleic acid, a structural component of membrane phospholipid, can maintain membrane fluidity. Linoleic acid is the precursor of arachidonic acid, which can produce prostaglandins and leukotrienes with a potential to mediate inflammation [Citation46]. Linoleic acid can be esterified to form phospholipids. When it is released from membrane phospholipids, it can generate 12,13-DHOME, 9,10-DHOME and other metabolites through various enzymatic reactions. Some studies have proved that 12,13-DHOME plays a role in inhibiting the immune system, increasing adipocyte differentiation, and cell proliferation and apoptosis [Citation47,Citation48] and is associated with an increased risk of ovarian cancer [Citation49]. Our study indicated that linoleic acid metabolism is enhanced in the MOD2 and MOD4 groups, the levels of 12,13-DHOME and 9,10-DHOME are increased. Therefore, linoleic acid metabolism is an important pathway affecting the 2 and 4 weeks of PF.
It is reported that alpha-linolenic acid protects cardiovascular nerves and has anticancer, antiosteoporosis, anti-inflammation and antioxidation effects [Citation50]. The decrease in alpha-linolenic acid level in the early stage of PF and significant increase in the late stage of PF may be due to the metabolic disorder caused by the compensatory increase in the offspring of the injured body. Therefore, alpha-linolenic acid metabolism is an important pathway affecting the 4 weeks of PF.
Our study indicated that the abundance of Lachnospiraceae_NK4A136_group was significantly reduced in the 2 and 4 weeks of PF in rats. The analysis of intestinal microbiota indicated that butyrate has anti-inflammatory capacity and can produce bacteria Lachnospiraceae_NK4A136_group [Citation51]. Lachnospiraceae_NK4A136_group is negatively correlated with intestinal permeability [Citation52]. The increase in the abundance of Lachnospiraceae_NK4A136_group was significantly correlated with the enhancement of intestinal barrier function induced by spermidine [Citation53], and the decrease of Lachnospiraceae_NK4A136_group in our study was also significantly positively associated with spermidine. Oxidative stress and inflammatory parameters were negatively correlated with Lachnospiraceae_NK4A136_group in the inflammatory reaction of the mouse liver and gut [Citation54]. Bifidobacterium is considered a probiotic because it does not produce endogenous, exogenous toxins or harmful substances and gases. In addition, Bifidobacterium also has a certain therapeutic effect on respiratory diseases [Citation55]. There is growing evidence that oral probiotics modulate the immune response of the respiratory system [Citation56]. Bifidobacterium can reshape the structure of intestinal microbiota and glycerol phospholipid metabolism [Citation57]. In our study, the abundance of Bifidobacterium decreased significantly at 2 weeks of PF in rats, which may be the cause of abnormal glycerophospholipid metabolic pathways in PF. Butyrate is the main metabolite of Butyrivibrio [Citation58]. Butyrate inhibits Th9-mediated immune response and reduces lung inflammation [Citation59]. The proportion of Clostridiales_vadinBB60_group was significantly lower in patients with inflammatory bowel disease [Citation60]. Reduced Alloprevotella levels may lead to decreased immune capacity, resulting in failure to prevent progressive PF. High levels of Lachnoclostridium may contribute to intestinal disease susceptibility or inhibit metabolic pathways associated with progressive PF, eventually leading to silicosis [Citation61]. Wan Zhai et al. found that Dubosiella, as a beneficial bacterium [Citation62], was closely related to the expression of IL-1β, IL-6, TNF-α and IL-10, which may have the effect of enhancing anti-inflammatory ability [Citation63]. The abundance of Dubosiella decreased and the abundance of Alistipes increased in the PF mouse model induced by X-ray irradiation [Citation64], which was consistent with our results. Acetatifactor may be a key microbiota that causes cholecystoic acid metabolism disorder and is associated with colon, liver and kidney injury [Citation65]. Gargi’s research found a decrease in the abundance of Ruminococcaceae, which produce butyrate, in the cystic fibrosis group [Citation66]. Ruminococcaceae NK4A214 was significantly reduced in chronic obstructive pulmonary disease periods 2–4 [Citation67]. Ruminococcaceae_UCG_005 improves chronic low-grade inflammation by affecting intestinal microbiota composition and reduces inflammation by producing high levels of faecal short-chain fatty acids [Citation68]. In our study, Ruminococcaceae_ UCG_005 increased in rats PF at 1 week and decreased significantly at 2 and 4 weeks.
Conclusion
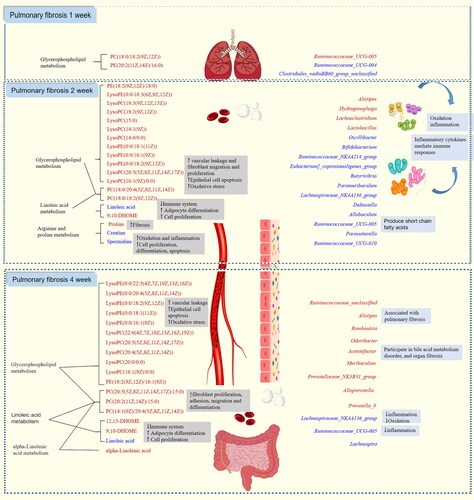
In summary, combined pharmacological and metabonomic study and analysis of intestinal microbiota revealed the characteristics of PF in each stage (). PC and PE affect the initial, middle and last stages of PF development (1, 2 and 4 weeks) by participating in glycerophospholipid metabolism pathway. LysoPE and LysoPC also belong to the glycerol phospholipid metabolism pathway, but they only participate in the development of PF in the middle and late stages. At the same time, Linoleic acid and 9,10-DHOME also affect the development of advanced PF by participating in Linoleic acid metabolism. Creatine, spermidine, proline influence the development of PF in the middle stage by participating in arginine and proline metabolism. alpha-Linolenic acid and 12,13- DHOME affect the development of advanced PF by participating in alpha-Linolenic acid metabolism and Linoleic acid metabolism, respectively. Ruminococcaceae_UCG-004, Clostridiales_vadinBB60_group_unclassified may be bacterial biomarkers for initial stage of PF. Oscillibacter, Bifidobacterium, Ruminococcaceae_NK4A214_group, Eubacterium]_coprostanoligenes_group, Butyrivibrio, Paramuribaculum, Hydrogenophaga, Lachnoclostridium, Dubosiella, Allobaculum, Ruminococcaceae_UCG-005, Parasutterella, Lactobacillus, Ruminococcaceae_UCG-010 may be bacterial biomarkers in the middle stage of PF. Lachnospiraceae_NK4A136_group, Alistipes, Odoribacter, Acetatifactor, Romboutsia, Ruminococcaceae_UCG-005, Alloprevotella, Ruminococcaceae_unclassified, Prevotellaceae_NK3B31_group, Muribaculum, Prevotella_9, Lachnospira may be bacterial biomarkers in the last stage of PF. Lachnospiraceae_NK4A136_group, Alistipes may appear as common biomarkers in the middle and last stages of PF. Ruminococcaceae_UCG-005 may be a bacterial marker throughout the development of PF. In addition, metabolic biomarkers at various stages of PF have certain correlation with bacterial biomarkers, which may influence each other and promote the development of PF. However, the detailed relationship between differential metabolites and intestinal microbiota in PF needs further experimental verification.
Figure 10. Study on the progression of pulmonary fibrosis disease based on metabolomics and intestinal flora. The red and blue characters in the figure indicate increased and decreased metabolite and intestinal flora abundance in each model group compared with the blank group, respectively.
Author contributions
Conceptualization, Jia-qi Liu, Hong-bing Zhou, Hong Chang and Song-li Shi; Data curation, Hong-bing Zhou, Jia Wang and Qian Li; Funding acquisition, Song-li Shi; Methodology, Hong-bing Zhou and Wan-fu Bai; Project administration, Song-li Shi; Writing – original draft, Jia-qi Liu, Hong Chang and Song-li Shi; Data graph making, Li-ya Fan and Jia-qi Liu; Writing – review & editing, Hong Chang, Song-li Shi, Li-ya Fan. All authors have read and agreed to the published version of the manuscript.
Institutional review board statement
The study was conducted in accordance with the Declaration of Helsinki and approved by Animal Ethics Committee of Baotou Medical College, Inner Mongolia University of Science and Technology (20170317).
Supplemental Material
Download MS Word (2.2 MB)Disclosure statement
No potential conflict of interest was reported by the authors.
Data availability statement
All data supporting the findings of this study are included in the article and its Supplementary Information files.
Additional information
Funding
References
- Richeldi L, Collard HR, Jones MG. Idiopathic pulmonary fibrosis. Lancet. 2017;389(10082):1941–1952. doi: 10.1016/S0140-6736(17)30866-8.
- Wuyts WA, Wijsenbeek M, Bondue B, et al. Idiopathic pulmonary fibrosis: best practice in monitoring and managing a relentless fibrotic disease. Respiration. 2020;99(1):73–82. doi: 10.1159/000504763.
- Vancheri C, Du Bois RM. A progression-free end-point for idiopathic pulmonary fibrosis trials: lessons from cancer. Eur Respir J. 2013;41(2):262–269. doi: 10.1183/09031936.00115112.
- Tzouvelekis A, Karampitsakos T, Gomatou G, et al. Lung cancer in patients with idiopathic pulmonary fibrosis. A retrospective multicenter study in Greece. Pulm Pharmacol Ther. 2020;60:101880. doi: 10.1016/j.pupt.2019.101880.
- Tale S, Ghosh S, Meitei SP, et al. Post-COVID-19 pneumonia pulmonary fibrosis. QJM. 2020;113(11):837–838. doi: 10.1093/qjmed/hcaa255.
- Lee JH, Koh J, Jeon YK, et al. An integrated radiologic-pathologic understanding of COVID-19 pneumonia. Radiology. 2023;306(2):e222600. doi: 10.1148/radiol.222600.
- Richeldi L, Collard HR, Jones MG. Idiopathic pulmonary fibrosis. Lancet. 2017;389:1941–1952. doi:10.1016/S0140-6736(17)30866-8
- Guidelines for the diagnosis and treatment of idiopathic pulmonary (interstitial) fibrosis (draft). Chin J Tubercu Respi Dis. 2002;07:6–8. https://kns.cnki.net/kcms2/article/abstract?v=NR7yonmY8oOF09qS-KpqZZBrH0cGFtK7doJdbH3wbe48gvZ8ePUYmliWlpyuAnSLbUhJM9YuiLIDZlC7k29bnzOqyVOeOWdSTosn8rgkuX-YXpqUurr5XKNn14uqhZUzWCPmlRFg7W0=&uniplatform=NZKPT&language=CHS
- Li H, Jiang Y, He FC. Recent development of metabonomics and its applications in clinical research. Hereditas. 2008;30(4):389–399. doi: 10.3724/SP.J.1005.2008.00389.
- Nobeli I, Thornton JM. A bioinformatician’s view of the metabolome. Bioessays. 2006;28(5):534–545. doi: 10.1002/bies.20414.
- Huang XC, Xu SL, Guo JM, et al. Application and thinking of metabonomics in some scientific problems of traditional chinese medicine. Chin Tradit Herb Drugs. 2014;45:147–153.https://kns.cnki.net/kcms2/article/abstract?v=NR7yonmY8oMdsvNInENbzi4W24eyFvv6dZQABIr8c9JVJdDGOpNeXmksYlChH8LsOSdmkf5ZtL4bt-O1EI4TxvjEEPE_uUd8gQGNZJ9mW7M4HoVSGRk7je9ISdBwla29FIHCgLYoTKI=&uniplatform=NZKPT&language=CHS.
- Bujak R, Struck-Lewicka W, Markuszewski MJ, et al. Metabolomics for laboratory diagnostics. J Pharm Biomed Anal. 2015;113:108–120. doi: 10.1016/j.jpba.2014.12.017.
- Sonnenburg JL, Bäckhed F. Diet-microbiota interactions as moderators of human metabolism. Nature. 2016;535(7610):56–64. doi: 10.1038/nature18846.
- Lin Z, Ye W, Zu X, et al. Integrative metabolic and microbial profiling on patients with spleen-yang-deficiency syndrome. Sci Rep. 2018;8(1):6619. doi: 10.1038/s41598-018-24130-7.
- Su G, Wang H, Bai J, et al. A metabonomics approach to drug toxicology in liver disease and its application in traditional chinese medicine. Curr Drug Metab. 2019;20(4):292–300. doi: 10.2174/1389200220666181231124439.
- Tan JY, Tang YC, Huang J. Gut microbiota and lung injury. Adv Exp Med Biol. 2020;1238:55–72. doi:10.1007/978-981-15-2385-4_5.
- Fei WW, Lu ZH, Huang X, et al. Research progress on the correlation of gut microbiota with and pulmonary tuber culosis based on the theory of exterior and interior of lung and large intestine. Chin J Antituberc. 2022;44:500–504. https://kns.cnki.net/kcms2/article/abstract?v=NR7yonmY8oPxZiBGpZA5atVCSB_AzHd9hv9YHqzzMrn5-NHLWDreMWU5LA4oyN7HJfxmDzOEmpPGuzBfjvt8tOIwt4okYKjawjIl8eOqBkAQqgQ7tgelbJDRVU06JubH2vSl-TkZr_nSI_ch3L-yuQ==&uniplatform=NZKPT&language=CHS
- Li L, Yang L. Research advance of microbial communities of lung and intestinal in asthma. China Med. Her. 2022;19:42–45. https://kns.cnki.net/kcms2/article/abstract?v=NR7yonmY8oP3H-j1t4nPpZtClzy1kLDi_rdrl_YLxeh_T2acAHb7fXv6uFrC4RPyX8dTZvVm8jNQv-cH1yIL6pRdHipUp3WEooBA_gITJ82dAszY9OeU-aDIgewlEcYpJJQhVi6JQ1LYbfl-pZmOxg==&uniplatform=NZKPT&language=CHS.
- Konjevod M, Nikolac-Perkovic M, Sáiz J, et al. Metabolomics analysis of microbiota-gut-brain axis in neurodegenerative and psychiatric diseases. J Pharm Biomed Anal. 2021;194:113681. doi: 10.1016/j.jpba.2020.113681.
- Wang Z, Zhao Y. Gut microbiota derived metabolites in cardiovascular health and disease. Protein Cell. 2018;9(5):416–431. doi: 10.1007/s13238-018-0549-0.
- Feng YL, Cao G, Chen DQ, et al. Microbiome-metabolomics reveals gut microbiota associated with glycine-conjugated metabolites and polyamine metabolism in chronic kidney disease. Cell Mol Life Sci. 2019;76(24):4961–4978. doi: 10.1007/s00018-019-03155-9.
- Zhao F, An R, Wang L, et al. Specific gut microbiome and serum metabolome changes in lung cancer patients. Front Cell Infect Microbiol. 2021;11:725284. doi: 10.3389/fcimb.2021.725284.
- Williamson JD, Sadofsky LR, Hart SP. The pathogenesis of bleomycin-induced lung injury in animals and its applicability to human idiopathic pulmonary fibrosis. Exp Lung Res. 2015;41(2):57–73. doi: 10.3109/01902148.2014.979516.
- Della-Latta V, Cecchettini A, Del-Ry S, et al. Bleomycin in the setting of lung fibrosis induction: from biological mechanisms to counteractions. Pharmacol Res. 2015;97:122–130. doi: 10.1016/j.phrs.2015.04.012.
- Wynn TA. Integrating mechanisms of pulmonary fibrosis. J Exp Med. 2011;208(7):1339–1350. doi: 10.1084/jem.20110551.
- Hofman K, Hall B, Cleaver H, et al. High-throughput quantification of hydroxyproline for determination of collagen. Anal Biochem. 2011;417(2):289–291. doi: 10.1016/j.ab.2011.06.019.
- Organ LA, Duggan AR, Oballa E, et al. Biomarkers of collagen synthesis predict progression in the PROFILE idiopathic pulmonary fibrosis cohort. Respir Res. 2019;20(1):148. doi: 10.1186/s12931-019-1118-7.
- Loscertales M, Nicolaou F, Jeanne M, et al. Type IV collagen drives alveolar epithelial-endothelial association and the morphogenetic movements of septation. BMC Biol. 2016;14(1):59. doi: 10.1186/s12915-016-0281-2.
- Garantziotis S, Brezina M, Castelnuovo P, et al. The role of hyaluronan in the pathobiology and treatment of respiratory disease. Am J Physiol Lung Cell Mol Physiol. 2016;310(9):L785–L795. doi: 10.1152/ajplung.00168.2015.
- Zhao HW, Lü CJ, Yu RJ, et al. An increase in hyaluronan by lung fibroblasts: a biomarker for intensity and activity of interstitial pulmonary fibrosis? Respirology. 1999;4(2):131–138. doi: 10.1046/j.1440-1843.1999.00164.x.
- Singer II, Kawka DW, McNally SM, et al. Extensive laminin and basement membrane accumulation occurs at the onset of bleomycin-induced rodent pulmonary fibrosis. Am J Pathol. 1986;125(2):258–268. https://pm.yuntsg.com/details.html?pmid=2431622&key=Extensive%20laminin%20and%20basement%20membrane%20accumulation%20occurs%20at%20the%20onset%20of%20bleomycin-induced%20rodent%20pulmonary%20fibrosis.
- Ren W, Chen Y, Wang Y, et al. Inhibitory effect of pirfenidone on pulmonary fibrosis in patients with acute paraquat poisoning. Am J Transl Res. 2021;13:13192–13199. https://pm.yuntsg.com/details.html?pmid=34956540&key=Inhibitory%20effect%20of%20pirfenidone%20on%20pulmonary%20fibrosis%20in%20patients%20with%20acute%20paraquat%20poisoning.
- Fielding CA, Jones GW, McLoughlin RM, et al. Interleukin-6 signaling drives fibrosis in unresolved inflammation. Immunity. 2014;40(1):40–50. doi: 10.1016/j.immuni.2013.10.022.
- Zhang WJ, Chen SJ, Zhou SC, et al. Inflammasomes and fibrosis. Front Immunol. 2021;12:643149. doi: 10.3389/fimmu.2021.643149.
- Huang C, Freter C. Lipid metabolism, apoptosis and cancer therapy. Int J Mol Sci. 2015;16(1):924–949. doi: 10.3390/ijms16010924.
- Tager AM, LaCamera P, Shea BS, et al. The lysophosphatidic acid receptor LPA1 links pulmonary fibrosis to lung injury by mediating fibroblast recruitm ent and vascular leak. Nat Med. 2008;14(1):45–54. doi: 10.1038/nm1685.
- Agudelo CW, Samaha G, Garcia-Arcos I. Alveolar lipids in pulmonary dis ease. A review. Lipids Health Dis. 2020;19(1):122. doi: 10.1186/s12944-020-01278-8.
- Srivastava PK, Misra UK. Phosphatidylcholine metabolism in lung microso mes and lung surfactant of rats exposed intratracheally to coal fly ash. Toxicol Environ Health. 1986;18(3):471–481. doi: 10.1080/15287398609530886.
- Wu G, Bazer FW, Davis TA, et al. Arginine metabolism and nutrition in growth, health and disease. Amino Acids. 2009;37(1):153–168. doi: 10.1007/s00726-008-0210-y.
- Krane SM. The importance of proline residues in the structure, stability and susceptibility to proteolytic degradation of collagens. Amino Acids. 2008;35(4):703–710. doi: 10.1007/s00726-008-0073-2.
- Wu G, Bazer FW, Burghardt RC, et al. Proline and hydroxyproline metabolism: implications for animal and human nutrition. Amino Acids. 2011;40(4):1053–1063. doi: 10.1007/s00726-010-0715-z.
- Guzy R, Redente EF. Kindlin for the fire: targeting proline synthesis to extinguish matrix production in pulmonary fibrosis. Am J Respir Cell Mol Biol. 2021;65(1):4–5. doi: 10.1165/rcmb.2021-0137ED.
- Baek AR, Hong J, Song KS, et al. Spermidine attenuates bleomycin-induced lung fibrosis by inducing autophagy and inhibiting endoplasmic reticulum stress (ERS)-induced cell death in mice. Exp Mol Med. 2020;52(12):2034–2045. doi: 10.1038/s12276-020-00545-z.
- Bassit RA, Curi R, Costa-Rosa LF. Creatine supplementation reduces plasma levels of pro-inflammatory cytokines and PGE2 after a half-ironman competition. Amino Acids. 2008;35(2):425–431. doi: 10.1007/s00726-007-0582-4.
- Fang YZ, Yang S, Wu G. Free radicals, antioxidants, and nutrition. Nutrition. 2002;18(10):872–879. doi: 10.1016/s0899-9007(02)00916-4.
- Whelan J, Fritsche K. Linoleic acid. Adv Nutr. 2013;4(3):311–312. doi: 10.3945/an.113.003772.
- Lynes MD, Leiria LO, Lundh M, et al. The cold-induced lipokine 12,13-diHOME promotes fatty acid transport into brown adipose tissue. Nat Med. 2017;23(5):631–637. doi: 10.1038/nm.4297.
- Moran JH, Weise R, Schnellmann RG, et al. Cytotoxicity of linoleic acid diols to renal proximal tubular cells. Toxicol Appl Pharmacol. 1997;146(1):53–59. doi: 10.1006/taap.1997.8197.
- Hada M, Edin ML, Hartge P, et al. Prediagnostic serum levels of fatty acid metabolites and risk of ovarian cancer in the prostate, lung, colorectal, and ovarian (PLCO) cancer screening trial. Cancer Epidemiol Biomarkers Prev. 2019;28(1):189–197. doi: 10.1158/1055-9965.EPI-18-0392.
- Kim KB, Nam YA, Kim HS, et al. α-linolenic acid: nutraceutical, pharm 19 acological and toxicological evaluation. Food Chem Toxicol. 2014;70:163–178. doi: 10.1016/j.fct.2014.05.009.
- Hamer HM, Jonkers D, Venema K, et al. Review article: the role of butyrate on colonic function. Aliment Pharmacol Ther. 2008;27(2):104–119. doi: 10.1111/j.1365-2036.2007.03562.x.
- Hu S, Wang J, Xu Y, et al. Anti-inflammation effects of fucosylated chondroitin sulphate from acaudina molpadioides by altering gut microbiota in obese mice. Food Funct. 2019;10(3):1736–1746. doi: 10.1039/c8fo02364f.
- Ma L, Ni Y, Wang Z, et al. Spermidine improves gut barrier integrity and gut microbiota function in diet-induced obese mice. Gut Microbes. 2020;12(1):1–19. doi: 10.1080/19490976.2020.1832857.
- Xia T, Duan W, Zhang Z, et al. Polyphenol-rich vinegar extract regulates intestinal microbiota and immunity and prevents alcohol-induced inflammation in mice. Food Res Int. 2021;140:110064. doi: 10.1016/j.foodres.2020.110064.
- Akay HK, Bahar-Tokman H, Hatipoglu N, et al. The relationship between bifidobacteria and allergic asthma and/or allergic dermatitis: a prospective study of 0-3 years-old children in Turkey. Anaerobe. 2014;28:98–103. doi: 10.1016/j.anaerobe.2014.05.006.
- Mortaz E, Adcock IM, Folkerts G, et al. Probiotics in the management of lung diseases. Mediators Inflamm. 2013;2013:751068. doi: 10.1155/2013/751068.
- Wu T, Sun M, Liu R, et al. Bifidobacterium longum subsp. longum remodeled roseburia and phosphatidylserine levels and ameliorated intestinal disorders and liver metabolic abnormalities induced by high-Fat diet. J Agric Food Chem. 2020;68(16):4632–4640. doi: 10.1021/acs.jafc.0c00717.
- Moon CD, Pacheco DM, Kelly WJ, et al. Reclassification of Clostridium proteoclasticum as Butyrivibrio proteoclasticus comb. nov., a butyrate-producing ruminal bacterium. Int J Syst Evol Microbiol. 2008;58(Pt 9):2041–2045. doi: 10.1099/ijs.0.65845-0.
- Vieira RS, Castoldi A, Basso PJ, et al. Butyrate attenuates lung inflammation by negatively modulating Th9 cells. Front Immunol. 2019;10:67. doi: 10.3389/fimmu.2019.00067.
- Wang L, Wang R, Wei GY, et al. Dihydrotanshinone attenuates chemotherapy-induced intestinal mucositis and alters fecal microbiota in mice. Biomed Pharmacother. 2020;128:110262. doi: 10.1016/j.biopha.2020.110262.
- Zhou Y, Chen L, Sun G, et al. Alterations in the gut microbiota of patients with silica-induced pulmonary fibrosis. J Occup Med Toxicol. 2019;14(1):5. doi: 10.1186/s12995-019-0225-1.
- Zhai Z, Zhang F, Cao R, et al. Cecropin a alleviates inflammation through modulating the gut microbiota of C57BL/6 mice with DSS-induced IBD. Front Microbiol. 2019;10:1595. doi: 10.3389/fmicb.2019.01595.
- Wan F, Han H, Zhong R, et al. Dihydroquercetin supplement alleviates colonic inflammation potentially through improved gut microbiota community in mice. Food Funct. 2021;12(22):11420–11434. doi: 10.1039/d1fo01422f.
- Li W, Lu L, Liu B, et al. Effects of phycocyanin on pulmonary and gut microbiota in a radiation-induced pulmonary fibrosis model. Biomed Pharmacother. 2020;132:110826. doi: 10.1016/j.biopha.2020.110826.
- Xu X, Shan Q, Ding R, et al. Integrated gut microbiota and serum metabolomics reveal the protective effect of oleanolic acid on liver and kidney-injured rats induced by euphorbia pekinensis. Phytother Res. 2022 Nov 25. doi: 10.1002/ptr.7673.
- Dayama G, Priya S, Niccum DE, et al. Interactions between the gut microbiome and host gene regulation in cystic fibrosis. Genome Med. 2020;12(1):12. doi: 10.1186/s13073-020-0710-2.
- Chiu YC, Lee SW, Liu CW, et al. Comprehensive profiling of the gut microbiota in patients with chronic obstructive pulmonary disease of varying severity. PLoS One. 2021;16(4):e0249944. doi: 10.1371/journal.pone.0249944.
- Chen R, Wu P, Cai Z, et al. Puerariae lobatae radix with chuanxiong rhizoma for treatment of cerebral ischemic stroke by remodeling gut microbiota to regulate the brain-gut barriers. J Nutr Biol Chem. 2019;65:101–114. doi: 10.1016/j.jnutbio.2018.12.004.