
 ?Mathematical formulae have been encoded as MathML and are displayed in this HTML version using MathJax in order to improve their display. Uncheck the box to turn MathJax off. This feature requires Javascript. Click on a formula to zoom.
Abstract
Background: Obesity changes body composition including fat free mass (FFM), regarded as the “pharmacologically active mass”. Scaling drug doses to obese patients by total body mass (TBM) results in overdose. We aimed to determine the success rate of inducing anaesthesia in normal, overweight and obese patients with propofol, using an adjusted body mass scalar (ABM), which embodies the increased FFM of obese patients.
Methods: Ninety-six patients were divided into three groups according to body mass index (BMI): normal, overweight and obese. Propofol 2 mg/kg ABM was administered according to the equation: ABM = IBM + 0.4(TBM – IBM), where IBM = ideal body mass. Induction success was assessed clinically and by electroencephalographic spectral entropy.
Results: The groups were similar regarding gender, age, height and IBM. One patient was morbidly obese (BMI = 44). State entropy (SE) decreased to < 60 in 33/33, 28/29 and 33/34 patients in the normal-weight, overweight and obese groups respectively, an overall success rate of 97.5% (95% confidence interval 92.7% to 99.4%). Median lowest achieved SE values and median times that SE remained < 60 did not differ between groups, however the individual values ranged widely in all three groups. Induction failed in the two patients whose SE did not decrease to < 60 (one overweight and one obese).
Conclusions: The ABM-based propofol induction dose has a high success rate in normal, overweight and obese patients. Further studies are required to determine the feasibility among morbidly obese patients.
Introduction
Obesity alters body composition and physiology.Citation1,Citation2 Forbes and Welle demonstrated that as much as 40% of the excess mass of obese individuals results from increased fat free mass (FFM).Citation3
Intravenous drug doses scaled according to total body mass (TBM) can result in overdosing obese individuals. Considering that FFM can be regarded as the “pharmacologically active mass”Citation4 an adjusted body mass scalar (ABM) has been proposed that accounts for the increased FFM of obese individuals by adding 40% of excess body mass to ideal body mass (IBM), thus:(1)
(1)
Our primary aim was to determine whether propofol bolus doses scaled according to ABM, would reliably induce anaesthesia in normal, overweight, and obese patients, as measured clinically and by electroencephalographic spectral entropy. We hypothesised that the proportions of patients in whom induction was successful would not differ significantly between normal, overweight, and obese patients.
Methods
The institutional ethics review board approved this prospective observational study set in a central teaching hospital (Project number 197/2012). Informed consent was obtained from participants who were American Society of Anesthesiologists (ASA) Physical Status Classification grade I or II, aged 18-70 years and scheduled for elective surgery. Exclusion criteria were propofol allergy, compromised airway, hypotension, unstable cardiovascular disease, and chronic sedative medication. Patients were allocated to three different BMI categories: Group N (22 to <25 kg/m2); Group OW (25 to < 30 kg/m2); Group O (> 30 kg/m2).
No premedication was prescribed. Spectral entropy electrodes (GE medical, Instrumentarium, Helsinki, Finland) were applied to participants’ foreheads according to manufacturer instructions. Response entropy (RE) and state entropy (SE) were recorded whilst awake (RE1 and SE1). Ringer lactate solution 15 ml/kg ABM was infused during 10 minutes. After preoxygenation, propofol 2 mg/kg ABM was administered over approximately 45 seconds. After loss of consciousness, ventilation was maintained manually using an 80% inspiratory oxygen concentration. IBM in Equation 1 was calculated as follows:(2)
(2)
(3)
(3)
Lowest values for response entropy (RE2) and state entropy (SE2) were recorded. An SE of < 60 has been shown to indicate meaningful hypnosis and low probability of consciousness.Citation5,Citation6 If SE decreased to < 60, the time to return to > 60 was recorded. At SE2, the success of induction of anaesthesia was assessed clinically, by recording responses to name calling, touch and instructions to open the eyes.Citation7 After SE had returned to > 60, the planned maintenance anaesthesia was administered. If SE failed to decrease to < 60 but the patient was clinically unconscious, anaesthesia was continued as above. If SE did not decrease to < 60 and the patient was responsive or confused, additional propofol was titrated to effect using 20 mg boluses. Heart rate (HR) and mean arterial blood pressure (BPM) were recorded before induction (HR1 and BPM1) and approximately coinciding with RE2 and SE2 (HR2 and BPM2). All inductions and assessments were performed by the same investigator (FXJ).
Statistical considerations
Sample size
An expected linearly decreasing trend regarding the proportions of successful inductions of 0.125 between groups (0.95, 0.825, 0.70) was regarded as clinically important. Employing a one-sided chi-squared test for trend at a significance level of 0.05 requires a sample size of 32 per group (nQuery Version 8.2.1.0, Statistical Solutions, Boston, MA).
Data analysis
Statistical analysis was conducted using Stata ii software (StataCorp LLC, TX, USA). A one-sided chi-squared test was used to test for a trend regarding successful inductions between groups. Considering that most variables were not normally distributed, continuous data were analysed using the Kruskal- Wallis non-parametric analysis of variance test, followed post-hoc by Dunn’s all-pairwise comparisons. Associations were investigated using the Spearman rank correlations test.
Results
Complete data were obtained from 96 of 98 recruited patients; 33, 29 and 34 in Group N, Group OW and Group O respectively. Summary statistics are presented in Tables 1, 2 and 3.
Group O’s BMI ranged from 30 to 44 kg/m2. Only one patient was morbidly obese. Groups were similar regarding gender, age, height and IBM (). Median ABM and FFMCitation8 differed significantly between Group N and Group O (N < O), but not between Group N and Group OW and not between Group OW and Group O (, ).
Figure 1: Relationship (over Groups N, OW and O) between BMI and total TBM, ABM, FFM (according to formulae by Janmahasatian et al.Citation8), TBM Total body mass; ABM adjusted body mass; Fat free mass; Mass of fat = TBM – FFM
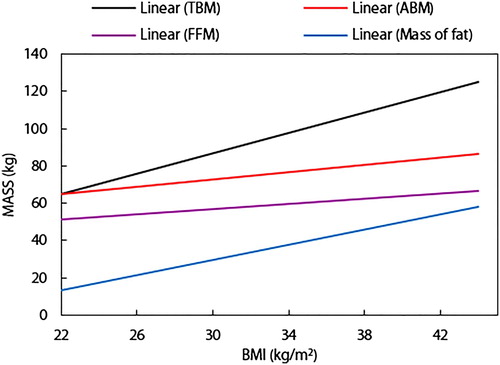
Table 1: Biographical variables
The median administered propofol doses differed significantly between Groups N and O, but not between Groups N and OW and not between Groups OW and O. Median doses per TBM differed significantly between groups with Group N > OW > O (, ).
Figure 2: Propofol dose per total body mass. TBM Total body mass; 1 = Group N, 2 = Group OW, and 3 = Group O. Groups differed significantly (p < 0.0001).
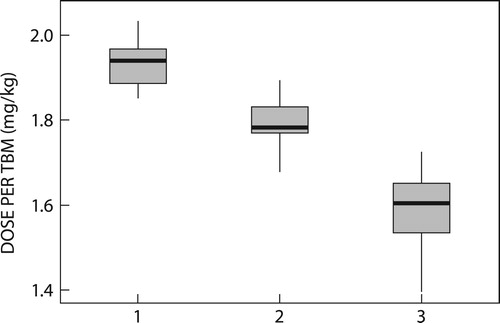
Table 2: Propofol dose per total body mass (mg/kg) and entropy
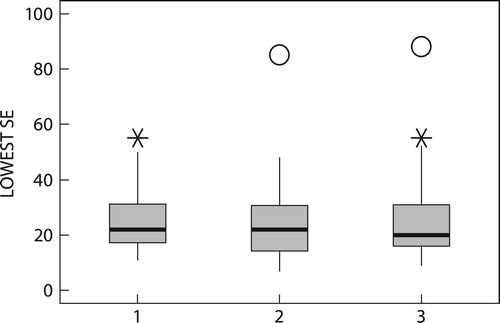
Median RE and SE did not differ between groups; neither before, nor after induction of anaesthesia (). SE decreased to <60 in 33/33, 28/29 and 33/34 patients in Groups N, OW and O respectively (p = 0.6), all of whom lost consciousness. Induction failed clinically in two patients, one each in Groups OW (RE2 = 91; SE2 = 85) and O (RE2 = 97; SE2 = 88), ). The overall success rate was 97.5% (95% confidence interval 92.7% to 99.4%).
Figure 3: Lowest SE after induction. 1 Group N, 2 Group OW, and 3 Group O Groups did not differ significantly (p = 0.6480). ‘*’ are extreme values and ‘o’ are probably outliers.
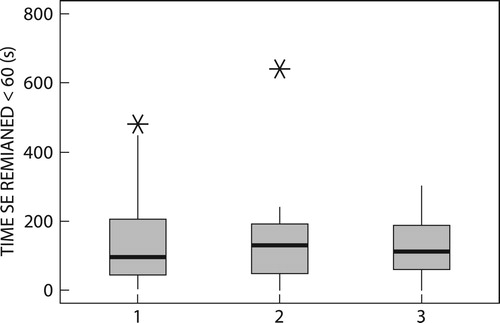
The median times that SE remained < 60 did not differ between groups (p > 0.9) (, ). These times ranged from 3 to 480, 0 to 640 and 0 to 302 seconds in Groups N, OW and O respectively. The SE2 values of the two Group N patients who had SE < 60 for only 3 seconds were 55 and 50.
Figure 4: Duration of SE2 < 60. 1 Group N, 2 Group OW, and 3 Group O. Groups did not differ significantly (p = 1.0). ‘*’ are extreme values.
Haemodynamic data are presented in . Median HR1 was significantly higher in Group O than in Group N (p = 0.02), but HR2 did not differ significantly between groups (p = 0.2). The median changes in HR differed significantly between groups (p = 0.02); groups N and OW and groups OW and O did not differ significantly, but changed significantly more in Group N than in Group O. Neither BPM1 (p = 0.7), BPM2 (p = 0.8) nor the change of BPM (p = 0.6) differed significantly between groups.
Table 3: Blood pressure and heart rate
SE2 values ranged widely (7 to 88). Considering that patients were not premedicated, the possibility of stress-induced sympathetic nervous system activity and an increased resting cardiac output influencing the success of induction was considered. The rate pressure product (RPP) has been used as an indicator of sympathetic activity.Citation9 We calculated the RPP (SBP × HR) before induction (RPP1). We could not demonstrate an association between RRP1 and SE2 and between the times that SE2 was less than 60.
Discussion
The results confirm our hypothesis that the proportion of patients in the three BMI groups who underwent successful induction of anaesthesia, would not differ. Furthermore, the overall success rate exceeded 95% with a small confidence interval. The dose range per TBM among all subjects ranged from 1.4 mg/kg to 2.0 mg/kg. If we had scaled our doses according to TBM, the two patients in whom induction failed, would have received 10 mg more (136 mg instead of 126 mg) and 26 mg more (164 mg instead of 138 mg) propofol, respectively. We can only speculate whether induction would have succeeded had they received the small additional amounts.
Cardiac output is distributed mainly to the FFM which has been described as the “pharmacologic active mass”. As TBW increases with increasing obesity, so does FFM, but this does not happen in parallel. depicts how (over Groups N, OW and O) TBM, mass of fat and FFM increased as BMI increases. FFM increases at a slower rate than mass of fat, therefore doses scaled according to TBM are likely to overdose obese patients. Conversely, ABM increases in parallel with FFM, therefore it can be reasoned that ABM is an appropriate dosing scalar for obese patients. The graph also shows that dose-scaling according to FFM may work equally well but would require a different dose/kg multiplier. Ingrande et al. titrated propofol until loss of consciousness to normal-weight patients and to morbidly obese patients.Citation10 The mean propofol dose per TBW of the normal-mass patients (2.57 mg/kg) was similar to the mean dose per FFM of the morbidly obese patients (2.76 mg/kg). A weakness of our study is that only one patient was morbidly obese (BMI ≥ 40 kg/m2). Therefore it is unknown whether bolus dose-scaling according to ABM is generally applicable to morbidly obese patients, in spite of successful induction of anaesthesia in this single patient. Considering that the ABM parallels increasing FFM in the morbidly obese, we speculate that dose-scaling according to ABM may also be applicable to otherwise healthy non-sarcopaenic morbidly obese patients.
Dose scaling according to ABM should be applied with caution to patients with sarcopaenic obesity who have increased fat mass and decreased muscle mass. They may be elderly individuals with comorbidities, including cardiac failureCitation11 and Cushing syndrome. Indiscriminate ABM-dosing may result in overdose. Conversely, muscular individuals have increased FFM and low-fat mass, thus ABM-dosing may result in unsuccessful induction of anaesthesia.
As far as we know, our study is the first in which the ABM equation of Forbes and WelleCitation3 has been applied to propofol bolus dosing. The ABM has previously been applied to dose-scaling of propofol infusion rates administered to obese patients by manual controlCitation12 and by target controlCitation13,Citation14 with varying degrees of success. However, with regard to propofol infusions, allometric scaling of pharmacokinetic parameters has recently proved to be superior.Citation15
Drug concentration-time profiles during the first few minutes that follow rapid intravenous injection cannot be described by the multicompartment, mammillary pharmacokinetic models that are successfully employed in target-controlled infusion pumps.Citation16 Several shortcomings include the assumption that the central apparent volume of distribution is a “well stirred” compartment into which drug is instantaneously distributed upon injection. In reality, the events are more complex.Citation17,Citation18
During the first few minutes drug is progressively diluted as it flows within the venous system and is mixed within the central circulation, from which it exits in the arterial blood. The arterial system distributes drug to various organs which take up drug to varying extent (including the targeted organ, e.g. brain). Thereafter drug is recirculated via the venous system. The central circulation may include elements that delay the passage of drugs by temporarily retaining and releasing drug (e.g. the lungs). The study of these early events is known as “front-end kinetics”Citation19 and the concentration-time profiles are similar in appearance to those obtained during measurement of cardiac output by dye-dilution. These phenomena have been successfully modelled by “hybrid” pharmacokinetic models that incorporate into multicompartment models, physiological elements such as cardiac output and recirculation.Citation18,Citation20
Similar to measurement of cardiac output by dye-dilution, peak arterial drug concentrations and areas under concentration-time curves following bolus dosing are diminished by increased cardiac output and vice versa during low cardiac output states. Obesity is associated with increasing resting cardiac output.Citation21–25 For example, cardiac output is increased by approximately 1.4 l/min by a BMI increase from 22 to 40 kg/m2.Citation26 Considering that cardiac output is mainly distributed to the FFM, it is likely that the ABM-scaling equation compensates for the increased cardiac output of overweight and obese patients. We surmised that certain of our unpremedicated patients could have been anxious with high pre-induction sympathetic activity, which would partially explain the wide-ranging SE data. However, there was no association between RPP and SE findings. This is unsurprising considering that that RPP is not a reliable indicator of sympathetic activity.Citation27–29
Injection rates prominently influence early drug concentration-time profiles and dose requirements.Citation30–34 Rapid rates result in high peak arterial concentrations, increased duration of effect and vice versa. Unfortunately, we did not strictly standardize administration rate of propofol, and this may have been partly responsible for the wide-ranging SE data. Anaesthesiologists’ abilities to estimate the times during which they administer induction doses are remarkably inaccurate.Citation30 We surmise that in clinical practice there are few anaesthesiologists who routinely time their propofol induction doses. Thus, it is likely that ABM- scaling has a high success rate as practised clinically.
Levels of hypnosis can be assessed clinically by assessing responsiveness and by interpreting the processed EEG. We employed clinical assessment (request to keep the eyes open) and spectral entropy (SE). SE has been validated to monitor the degree of hypnosis caused by intravenous anaesthetic agents and by volatile anaesthetic agents.Citation5,Citation35–39 A SE < 60 depicts meaningful hypnosis.Citation40,Citation41 Induction was clinically successful in all our patients whose SE decreased to < 60. An SE < 87 indicates progressive sedation with propofol,Citation42 and emergence from anaesthesia usually occurs when SE > 90. Vakkuri et al. observed recovery of consciousness at SE 73 (95% CI 67.4 to 78.6) after induction with propofol 2 mg/kg administered during 20 seconds.Citation5 We chose a SE threshold of 60 as an indication of adequate hypnosis since this is the level that is generally accepted as being appropriate to perform surgery.5,6 The interquartile ranges during which SE remained < 60 in Groups N, OW and O were 43 to 207 seconds, 45 to 194 seconds, and 58 to 190 seconds, respectively. These times were sufficient to conduct uncomplicated airway management. Times for SE to return to > 73 would be even longer and would still probably ensure amnesia if airway management required more time than usual. Taking these factors into account, we are of the opinion that reliable induction was achieved in all, except two patients.
HR and BPM changes were mild in all three groups and the median differences were clinically unimportant. The changes were recorded at the time of SE2. It has been shown that following propofol induction, maximum blood pressure declines follow some minutes after the EEG nadir.Citation43 It is unknown whether our recorded changes were the greatest that our patients experienced.
We conclude that scaling propofol induction doses according to the ABM of Forbes and Welle had a high success rate in normal-mass, overweight and obese, ASA I and II patients. We did not detect significant differences in median duration of unconsciousness or maximum electroencephalographic depression. Further research is required to establish whether ABM-scaling can be applied to morbidly obese patients.
Declaration
We hereby declare that we conducted and completed this research. The study has not been submitted for publication in any journal. The study was presented at the South African Society of Anaesthesiologists Congress in 2014.
Additional information
Funding
References
- Alpert MA, Lavie CJ, Agrawal H, Aggraval KB, Kumar SA. Obesity and heart failure: epidemiology, pathophysiology, clinical manifestations, and management. Translational Research. 2014;164(4):345-56. doi: 10.1016/j.trsl.2014.04.010
- Poirier P, Giles TD, Bray GA, Hong Y, Stern JS, Pi-Sunyer FX, Eckel RH. Obesity and cardiovascular disease: pathophysiology, evaluation, and effect of weight loss. Arterioscler Thromb Vasc Biol. 2006;26(5):968-76. doi: 10.1161/01.ATV.0000216787.85457.f3
- Forbes GB, Welle SL. Lean body mass in obesity. Int J Obes. 1983;7(2):99-107.
- Wulfsohn NL, Joshi CW. Thiopentone dosage based on lean body mass. Br J Anaesth. 1969;41(6):516-21. doi: 10.1093/bja/41.6.516
- Vakkuri A, Yli-Hankala A, Talja P, Mustola S, Tolvanen-Laakso H, Sampson T, et al. Time-frequency balanced spectral entropy as a measure of anesthetic drug effect in central nervous system during sevoflurane, propofol, and thiopental anesthesia. Acta Anaesthesiol Scand. 2004;48:145-53. doi: 10.1111/j.0001-5172.2004.00323.x
- Vakkuri A, Yli-Hankala A, Sandin R, Mustola S, Hoymork S, Nyblom S, et al. Spectral entropy monitoring is associated with reduced propofol use and faster emergence in propofol-nitrous oxide-alfentanil anesthesia. Anesthesiology. Aug 2005;103(2):274-9. doi: 10.1097/00000542-200508000-00010
- Vanluchene AL, Struys MM, Heyse BE, Mortier EP. Spectral entropy measurement of patient responsiveness during propofol and remifentanil. A comparison with the bispectral index. Br J Anaesth. Nov 2004;93(5):645-54. doi: 10.1093/bja/aeh251
- Janmahasatian S, Duffull SB, Ash S, Ward LC, Byrne NM, Green B: Quantification of lean bodyweight. Clin Pharmacokinet. 2005;44:1051-65. doi: 10.2165/00003088-200544100-00004
- Krakoff LR, Dziedzic S, Mann SJ, Felton K, Yeager K. Plasma epinephrine concentration in healthy men: correlation with systolic pressure and rate-pressure product. J Am Coll Cardiol. Feb 1985;5(2 Pt 1):352-6. doi: 10.1016/S0735-1097(85)80058-9
- Ingrande J, Brodsky JB, Lemmens HJ. Lean body weight scalar for the anesthetic induction dose of propofol in morbidly obese subjects. Anesth Analg. Jul 2011;113(1):57-62. doi: 10.1213/ANE.0b013e3181f6d9c0
- Alpert MA, Karthikeyan K, Abdullah O, Ghadban R. Obesity and Cardiac Remodeling in Adults: Mechanisms and Clinical Implications. Progress in cardiovascular diseases. Jul - Aug 2018;61(2):114-23. doi: 10.1016/j.pcad.2018.07.012
- Servin S, Farinotti R, Desmonds JM. Propofol infusion for maintenance of anaesthesia in morbidly obese patients receiving nitrous oxide. Anesthesiology. 1993;78(4):657-65. doi: 10.1097/00000542-199304000-00008
- Albertin A, Poli D, La Colla L, Gonfalini M, Turi S, Pasculli N, et al. Predictive performance of ‘Servin’s formula’ during BIS(R)-guided propofol-remifentanil target-controlled infusion in morbidly obese patients. Br J Anaesth. 2006;98(1):66-75. doi: 10.1093/bja/ael321
- La Colla L, Albertin A, La Colla G, Ceriani V, Lodi T, Porta A, et al. No adjustment vs. adjustment formula as input weight for propofol target-controlled infusion in morbidly obese patients. Eur J Anaesthesiol. 2009;26(5):362-9. doi: 10.1097/EJA.0b013e328326f7d0
- Eleveld DJ, Colin P, Absalom AR, Struys M. Pharmacokinetic-pharmacodynamic model for propofol for broad application in anaesthesia and sedation. Br J Anaesth. 2018 May;120(5):942-59. doi: 10.1016/j.bja.2018.01.018
- Avram MJ, Krejcie TC. Using front-end kinetics to optimize target-controlled drug infusions. Anesthesiology. 2003;99(5):1078-86. doi: 10.1097/00000542-200311000-00013
- Upton RN. The two-compartment recirculatory pharmacokinetic model--an introduction to recirculatory pharmacokinetic concepts. Br J Anaesth. 2004;92(4):475-84. doi: 10.1093/bja/aeh089
- Upton RN, Ludbrook G. A physiologically based, recirculatory model of the kinetics and dynamics of propofol in man. Anesthesiology. 2005;103(2):344-52. doi: 10.1097/00000542-200508000-00018
- Krejcie TC, Avram MJ. What determines anesthetic induction dose? It’s the front-end kinetics, doctor! Anesth Analg. 1999;89(3):541-4.
- Upton RN, Ludbrook GL. A physiological model of induction of anaesthesia with propofol in sheep. 1. Structure and estimation of variables. Br J Anaesth. 1997;79(4):497-504. doi: 10.1093/bja/79.4.497
- Alexander JK. Obesity and cardiac performance. American J Cardiol. 1964 Dec;14:860-5. doi: 10.1016/0002-9149(64)90014-1
- Alexander JK, Dennis EW, Smith WG, Amad KH, Duncan WC, Austin RC. Blood volume, cardiac output, and distribution of systemic blood flow in extreme obesity. Cardiovasc Res Cent Bull. 1962 Winter;1:39-44.
- de Divitiis O, Fazio S, Petitto M, Maddalena G, Contaldo F, Mancini M. Obesity and cardiac function. Circulation. 1981;64(3):477-82. doi: 10.1161/01.CIR.64.3.477
- Poirier P, Giles TD, Bray GA, Hong Y, Stern JS, Pi-Sunyer FX, et al. Obesity and cardiovascular disease: pathophysiology, evaluation, and effect of weight loss: an update of the 1997 American Heart Association Scientific Statement on Obesity and Heart Disease from the Obesity Committee of the Council on Nutrition, Physical Activity, and Metabolism. Circulation. 2006;113(6):898-918. doi: 10.1161/CIRCULATIONAHA.106.171016
- Stelfox HT, Ahmed SB, Ribeiro RA, Gettings EM, Pomerantsev E, Schmidt U. Hemodynamic monitoring in obese patients: the impact of body mass index on cardiac output and stroke volume. Crit Care Med. 2006;34(4):1243-6. doi: 10.1097/01.CCM.0000208358.27005.F4
- Collis T, Devereux RB, Roman MJ, de Simone G, Yeh J, Howard BV, et al. Relations of stroke volume and cardiac output to body composition: The strong heart study. Circulation. 13 Feb 2001;103(6):820-5. doi: 10.1161/01.CIR.103.6.820
- Barash PG, Kopriva CJ. The rate-pressure product in clinical anesthesia: boon or bane? Anesth Analg. 1980;59(4):229-31. doi: 10.1213/00000539-198004000-00001
- Hui SC, Jackson AS, Wier LT. Development of normative values for resting and exercise rate pressure product. Medicine and science in sports and exercise. 2000;32(8):1520-7. doi: 10.1097/00005768-200008000-00023
- Krakoff LR, Dziedzic S, Mann SJ, Felton K, Yeager K. Plasma epinephrine concentration in healthy men: correlation with systolic pressure and rate-pressure product. J Am Coll Cardiol. 1985;5(2 Pt 1):352-6. doi: 10.1016/S0735-1097(85)80058-9
- Goodman NW, Black AM. Rate of injection of propofol for induction of anesthesia. Anesth Analg. 1992;74(6):938-9. doi: 10.1213/00000539-199206000-00042
- Ludbrook GL, Upton RN, Grant C, Martinez A. The effect of rate of administration on brain concentrations of propofol in sheep. Anesth Analg. 1998;86(6):1301-6.
- Stokes DN, Hutton P. Rate-dependent induction phenomena with propofol: implications for the relative potency of intravenous anesthetics. Anesth Analg. 1991;72(5):578-83. doi: 10.1213/00000539-199105000-00002
- Zheng D, Upton RN, Martinez AM, Grant C, Ludbrook GL. The influence of the bolus injection rate of propofol on its cardiovascular effects and peak blood concentrations in sheep. Anesth Analg. 1998;86(5):1109-15. doi: 10.1213/00000539-199805000-00039
- Kazama T, Ikeda K, Morita K, Kikura M, Ikeda T, Kurita T, et al. Investigation of effective anesthesia induction doses using a wide range of infusion rates with undiluted and diluted propofol. Anesthesiology. 2000;92(4):1017-28. doi: 10.1097/00000542-200004000-00019
- Bartel PR, Smith FJ, Becker PJ. A comparison of EEG spectral entropy with conventional quantitative EEG at varying depths of sevoflurane anaesthesia. Southern African Journal of Anaesthesia and Analgesia. 2005;11(3):89-93. doi: 10.1080/22201173.2005.10872405
- Ellerkmann RK, Liermann VM, Alves TM, Wenningmann I, Kreuer S, Wilhelm W, et al. Spectral entropy and bispectral index as measures of the electroencephalographic effects of sevoflurane. Anesthesiology. 2004;101(6):1275-82. doi: 10.1097/00000542-200412000-00006
- Ellerkmann RK, Soehle M, Alves TM, Liermann VM, Wenningmann I, Roepcke H, et al. Spectral entropy and bispectral index as measures of the electroencephalographic effects of propofol. Anesth Analg. 2006;102(5):1456-62. doi: 10.1213/01.ane.0000204289.47792.56
- Liu N, Le Guen M, Benabbes-Lambert F, Chazot T, Trillat B, Sessler DI, et al. Feasibility of closed-loop titration of propofol and remifentanil guided by the spectral M-Entropy monitor. Anesthesiology. 2012;116(2):286-95. doi: 10.1097/ALN.0b013e318242ad4f
- Schmidt GN, Bischoff P, Standl T, Hellstern A, Teuber O, Schulte Esch J. Comparative evaluation of the Datex-Ohmeda S/5 Entropy Module and the Bispectral Index monitor during propofol-remifentanil anesthesia. Anesthesiology. Dec 2004;101(6):1283-90. doi: 10.1097/00000542-200412000-00007
- Bein B. Entropy. Best Pract Res Clin Anaesthesiol. 2006;20(1):101-9. doi: 10.1016/j.bpa.2005.07.009
- Gruenewald M, Zhou J, Schloemerkemper N, Meybohm P, Weiler N, Tonner PH, et al. M-Entropy guidance vs standard practice during propofol-remifentanil anaesthesia: a randomised controlled trial. Anaesthesia. 2007;62(12):1224-9. doi: 10.1111/j.1365-2044.2007.05252.x
- Mahon P, Kowalski RG, Fitzgerald AP, Lynch EM, Boylan GB, McNamara B, et al. Spectral entropy as a monitor of depth of propofol induced sedation. J Clin Monit Comput. 2008;22(2):87-93. doi: 10.1007/s10877-008-9109-0
- Kazama T, Ikeda K, Morita K, Kikura M, Doi M, Ikeda T, et al. Comparison of the effect-site k(eO)s of propofol for blood pressure and EEG bispectral index in elderly and younger patients. Anesthesiology. 1999;90(6):1517-27. doi: 10.1097/00000542-199906000-00004