
 ?Mathematical formulae have been encoded as MathML and are displayed in this HTML version using MathJax in order to improve their display. Uncheck the box to turn MathJax off. This feature requires Javascript. Click on a formula to zoom.
Abstract
Background: Body mass is commonly used to determine medication dosages and equipment size. In emergency situations (including cases necessitating surgery) weighing paediatric patients can be impractical. Clinicians may use any of several body mass estimation techniques to surmount this obstacle. This study's aim was to compare the actual body mass of children with estimated mass as predicted by several commonly used estimation methods.
Methods: This diagnostic cross-sectional study recorded data from patients between one and five years of age in the Tshwane district. Measurement procedures were standardised to ensure consistency.
Results: The relationship between anthropometric and demographic variables were determined and applied to different estimation models to assess the models’ applicability to the Tshwane district population. The APLS (Advanced Paediatric Life Support) formula (Body mass (kg) = (Age + 4) × 2) proved the most appropriate. This formula gave a mean underestimation of 0.51 kg. Age proved to be the variable with the strongest correlation to body mass. A formula was developed specifically for the selected population, adding mid upper arm circumference as a second variable. This formula is more complex and offers only a marginal improvement in accuracy of weight estimation.
Conclusion: The APLS formula is a reasonable tool to use when estimating the body mass in children between one and five years old in the Tshwane district population. It is a well-known and simple formula, making it well suited to this purpose.
Introduction
When children present for surgery and anaesthesia, body mass is the variable most commonly used to guide therapeutic interventions.Citation1,Citation2 However, weighing children before initiating therapy may not be possible in acute medical, trauma or surgical emergencies.Citation2,Citation3 These scenarios necessitate the estimation of a child's body mass using one of various published methods.Citation4 The estimated body mass should be as close to actual mass as possible, since underestimation can result in suboptimal drug dosing and under-resuscitation. Overestimating body mass, on the other hand, can result in overdosing.Citation2
Methods of body mass estimation include age-based formulas (APLS, Luscombe and Owens, Theron, Best Guess, Leffler, Shann), length-based techniques (Broselow tape) and reading the estimated mass from a growth chart using the child's age (CDC [Centre for Disease Control] 2000 and WHO [World Health Organization] 2006 growth charts []).Citation1,Citation2
Table 1: Mass estimation techniques.
The most popular body mass estimation tools in children are the Broselow tape and the Advanced Paediatric Life Support (APLS) formula.Citation2,Citation4 While length-based estimation techniques have been described as being superior, their usage unfortunately poses some problems in the emergency department and operating theatre.Citation7,Citation13 They might not be readily available and can be impractical to use in the injured child.Citation2,Citation4 Further, length-based estimation techniques are seldom used by anaesthetists and cannot be used to plan therapy when anticipating a child's arrival.Citation2,Citation14
The use of age-based formulas as an alternative resolves these problems. The most widely recommended are the APLS and Luscombe and Owens formulas.Citation2 It is important to note that these formulas have been derived using data from developed countries.Citation2,Citation4 Their applicability to the South African population with its ethnic and socioeconomic diversity is therefore unclear.Citation1 Centile charts can also estimate body mass, though they are more complex to use.Citation4,Citation15
The aim of this study was to compare the actual body mass of children with estimated body mass as predicted by body mass estimation methods. The second objective was the development of a specific model for the Tshwane district population.
Methods
Ethical approval was obtained from the institutional Research Ethics Committee. Written consent was obtained from parents at enrolment. Strict patient confidentiality was maintained; data were stored electronically and password protected.
The study was designed as a diagnostic cross-sectional study comparing four body mass estimation methods with actual patient mass. Actual body mass was compared with mass estimated by the APLS formula, the Luscombe and Owens formula, the CDC 2000 and WHO 2006 charts. We focused on the relationship between mass and age for children of both sexes between one and five years of age.
A convenience sample of patients was enrolled, stratifying children in groups of one-year age intervals, starting at one year up to and including five years of age. A minimum sample size of 25 children per year interval, and 121 children in total, were enrolled. Body mass, height, mid upper arm circumference and head circumference were recorded on a data collection form. Measurements were carried out in an anthropometrically correct manner.
Children for any elective surgery, with a physical status ASA 1 from Steve Biko Academic Hospital and the Oral and Dental Hospital, were included (Tshwane district). Children with conditions known to be associated with impaired growth (i.e. cardiac conditions) or a physical status of ASA II and more were excluded.
Statistical analysis
Data summary by sex and age used descriptive statistics: mean, standard deviation, median, range (IQ) and 95% confidence intervals. The collected data were used in various combinations to create multivariable regression models. These models were evaluated to determine whether it will be feasible to develop a specific model for the Tshwane district population.
This Tshwane district model was then compared with the models from the literature (APLS formula, Luscombe and Owens formula, CDC 2000 charts, WHO 2006 charts using 50th centile) utilising Bland and Altman methodology as well as the intra-class-correlation coefficient.
The Tshwane district model was also used to develop a formula utilising age in months and mid upper arm circumference as variables. The validity of the Tshwane district model was assessed using several statistical parameters. All testing was done at the 0.05 level of significance.
Results
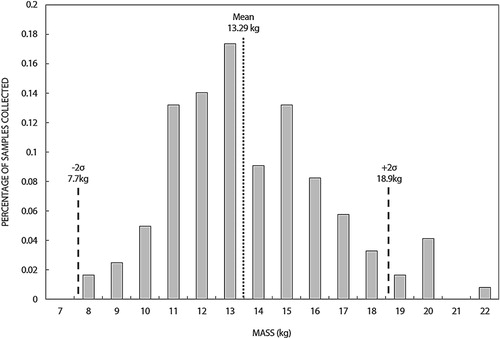
Data were collected from 121 children ranging from 1 year to 4 years and 11 months of age. The majority of patients were male, comprising 66% of patients. Some 80% of patients were black African and 14% white, with the rest comprising coloured, Indian and other races. Distributions of age and body mass of the participants are represented in and .
Figure 1: Histogram of participant age.
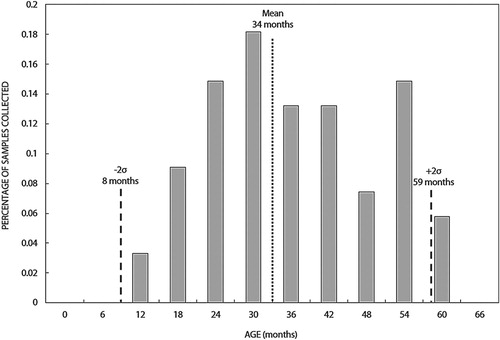
Figure 2: Histogram of participant body mass.
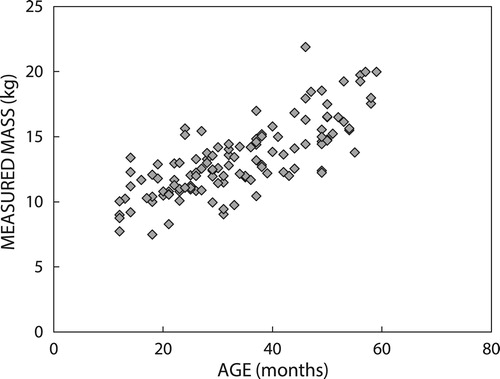
and present the measured data per age groups (body mass).
Figure 3: Study results—complete data set (years).
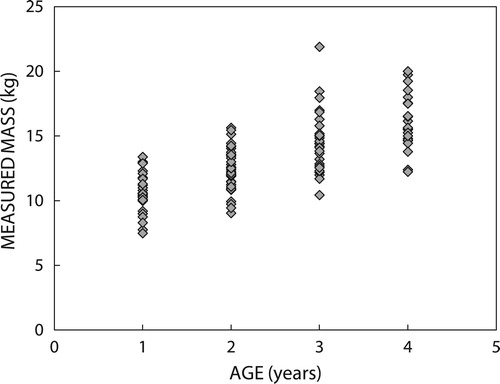
Figure 4: Study results—complete data set (months).
shows a comparison of measured data with the predicted body mass using the APLS and Luscombe and Owens formulas.
Figure 5: Comparison—measured versus predicted body mass (regression lines).
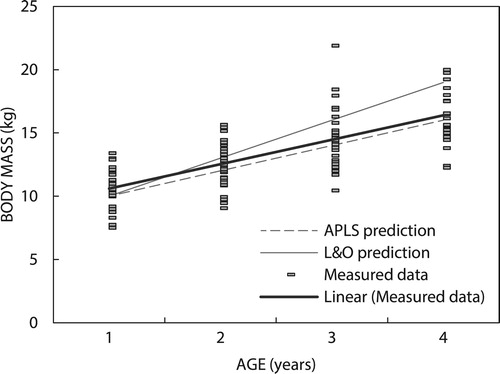
Compared with the Tshwane District population, the APLS equation consistently gave a lower estimated mass than actual body mass. This underestimation was constant throughout the group with a mean value of 0.51 kg lower. This finding was validated using results from a previous study done in the district's clinics.Citation16
The Luscombe and Owens equation generally overestimated the actual body mass in this population, with a slight underestimation in patients less than or equal to two years; this overestimation became more pronounced with increasing age.
A Bland–Altman plot was subsequently constructed to investigate the difference between actual and estimated body mass using the APLS formula ().
Figure 6: Bland–Altman plot—APLS prediction versus measured results.
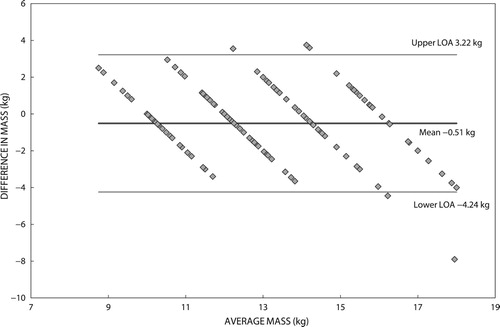
The APLS formula underestimated mass by a mean value of 0.51 kg. When considering inter-individual variation in the population, predicted values can give an overestimation up to 3.22 kg or an underestimation of as much as 4.24 kg. These values were derived by calculating two standard deviations from the mean, our limits of agreement.
The data were validated by comparing these findings with the aforementioned retrospective study conducted in Tshwane district clinics as our data set is similar to this larger collected set ().Citation16
Table 2: Comparison of modelled and measured body mass
When comparing both data sets with estimated values by the APLS formula, the mean underestimation is slightly less. The APLS formula underestimated weight in this study's patients by a mean of 3.8% compared with 5.4% in the validation data. The maximum underestimated value was also slightly less.
In the Western Cape the mean error was a 3.3% underestimation.Citation1 This is similar to what was found in the Tshwane district population. Notably, in all the South African data sets, the estimated mass as predicted by the APLS formula was within 10% of mean actual body mass. Therefore the APLS formula can be considered a reasonable tool for weight estimation in both the Western Cape and the Tshwane district population.
There was a poor correlation to any single percentile line when comparing our data with the CDC 2000 charts. In addition, various children from the study had body masses that fell outside of the 5° and 95° percentiles. This precludes its use as an effective mass estimation tool in our population. To further complicate matters in terms of practicality, the low resolution of charts for 2- to 20-year-olds makes it difficult to read an estimated mass from these charts.
When comparing data with the WHO 2006 charts, the range of values in the data set seemed more readily confined within the limits of the 3° and 97°. There was, however, still no constant relation between the data and a single centile line. The WHO 2006 charts, like the CDC 2000 charts, therefore proved poor predictors of body mass in our population.
The second objective of the study was the development of a specific model for the Tshwane district population. For the development of such a model, the following variables were considered:
Age (years);
Age (months);
Mid upper arm circumference (cm);
Sex (female/male);
Body mass (kg).
The data sets were used as source data to develop potential models. Each developed model used a unique combination of the available variables to predict mass (e.g. age vs. mass, arm circumference vs. mass, age and arm circumference vs. mass etc.). Various combinations of the above-mentioned variables were used to develop 15 potential models. Statistical assessment determined whether the model was a good representation of the given data. Every model was then evaluated using a set of statistical parameters. A holistic comparison of the individual results was made in order to select a model for further evaluation.
The results indicated that a multi-variable regression model based on age in months and arm circumference provided the most statistically relevant representation of body mass. Importantly, the results showed no significant statistical improvement when differentiating between male and female data sets. The regression model based on the female data set also showed a marginal difference when using the year or months based age variables. Considering the fact that sex seems statistically inconsequential in the prediction of mass, a multi-regression model based on pooled data was subsequently selected for further investigation.
The formula for the newly developed Tshwane district population specific model is:The formula was used to predict the body mass of the entire collected data set. presents a Bland–Altman plot of the results.
Figure 7: Bland–Altman plot—multi-variable model versus measured results.
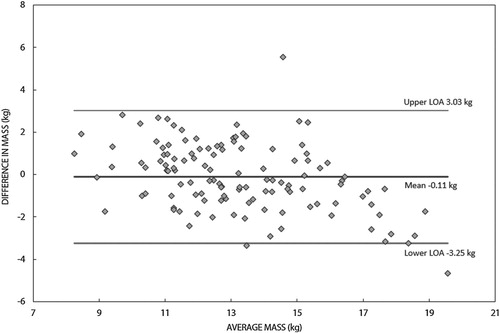
Inspection of shows that the new model was more accurate in predicting the mass of the specific population.
Discussion
The group of children weighed had a male preponderance. This might be attributed to the fact that urological procedures, including circumcisions and hypospadia repairs, comprised a large portion of the surgery performed on ASA I children at Steve Biko Tertiary Hospital. Body mass estimation formulas, such as the APLS and Luscombe and Owens formulas, do not, however, distinguish between the different sexes.
When comparing the two estimation formulas with the actual body masses, the APLS formula underestimated body mass while the Luscombe and Owens formula generally overestimated mass. The APLS formula, however, proved superior by giving a constant relation to actual body mass across the group with a smaller mean error. The mean underestimation by the APLS formula was 0.51 kg. Comparison with the Luscombe and Owens formula showed a different pattern. In younger children there was an underestimation of body mass. By two years of age, however, this formula overestimated weight with an increase in error as the children grew older.
It is important to note that both the APLS and the Luscombe and Owens equations gave estimated values that fell within the range of actual masses recorded. Depending on the individual child, the use of either of these formulas could therefore theoretically give a value closer to the actual body mass. The APLS formula estimated values that had a more constant and predictable relation to the mean body mass, at all ages, in the selected population.
Our comparison of age-based estimation formulas with actual body mass correlates well with results from a previous study done in clinics around Tshwane district, as well as with results from the Western Cape. In both studies the APLS formula was the most accurate body mass estimation formula.Citation1,Citation16 From these results it might be possible that, despite South Africa's very diverse population and the effect on body mass, there could be a strong correlation between children in different provinces. Nevertheless, there is a remarkable difference between our results and findings in Australia, Korea, Ireland and the USA.Citation2,Citation4,Citation8,Citation17
The CDC 2000 growth charts proved to be a poor tool in the prediction of body mass based on age. Poor correlation to a single centile line and the fact that measured values were poorly confined within the centile ranges makes the CDC 2000 charts unreliable in the prediction of body mass. WHO 2006 charts did not offer a significant improvement in terms of weight estimation when compared with CDC 2000 charts, nor could they outperform age-based formulas.
In a clinical setting there are some drawbacks with the use of these growth charts for weight estimation. They are not freely available in the emergency room or operating theatre and their use is prone to human error. In this study neither the CDC 2000 charts nor the WHO 2006 charts gave a more accurate estimation of body mass in children than the APLS formula. The APLS formula is therefore a more convenient and accurate tool in the estimation of body mass in our population.
The secondary objective of this study was to develop a model that predicts body mass in our population using different anthropometric variables. Regarding the data for other anthropometric variables, mid upper arm circumference was added to age in months in the development of a formula. This formula provided a mean underestimation of 0.11 kg. Additional data sets will be required for further evaluation and validation before any definitive conclusions can be made. Although slightly more accurate in predicting body mass, it is more complicated than existing formulas. Using a child's age in months increases resolution, but likely increases the chance for human error in miscalculation. The formula also requires measurement of the child's mid upper arm circumference, something not routinely done and impractical in emergency situations. This significantly limits its practical application. Assuming that the multi-regression model is more accurate, a future challenge would be to determine whether the marginally improved accuracy warrants the significant increase in model complexity.
Conclusion
When estimating body mass in children between one and five years of age in the Tshwane district, the APLS formula is a sufficient tool. This simple, well-known formula, though slightly underestimating body mass, has a good correlation with actual values. It is a more accurate tool than the Luscombe and Owens formula in this population. Compared with the CDC 2000 and WHO 2006 growth charts it is easier to use and correlates better with actual body mass.
Using the formula specially developed for this population will probably not be of significant benefit to healthcare practitioners. It is slightly more accurate at the expense of adding complexity. Considering that a new formula would also only be able to give an estimation (and weighing a child is the only sure way to determine body mass) the current APLS formula should still be considered an adequate estimation tool.
Acknowledgements
The authors would like to thank Prof. PJ Becker, biostatistician at the University of Pretoria, and Dr W Booysen for statistical analysis of the data.
Disclosure statement
No potential conflict of interest was reported by the authors.
References
- Geduld H, Hodkinson P, Wallis L. Validation of weight estimation by age and length based methods in the Western Cape, South Africa population. Emerg Med J. 2011;28:856–860. doi: 10.1136/emj.2010.098640
- Ackwerh RF, Lehrian LD, Nafiu OO. Assessing the accuracy of common pediatric age-based weight estimation formulae. Anesth Analg. 2014;118(5):1027–1033. doi: 10.1213/ANE.0000000000000163
- Erker CG, Santamaria M, Moellmann M. Size does matter – age-related weight estimation in “tall n’ thin” and “tiny n’ thick” children and a new habitus-adapted alternative to the EPLS-formula. Resuscitation. 2014;85(9):1174–1178. doi: 10.1016/j.resuscitation.2014.04.032
- Skrobo D, Kelleher G. CORKSCREW 2013 CORK study of children’s realistic estimation of weight. Emerg Med J. 2015;32(1):32–35. doi: 10.1136/emermed-2013-203352
- Hamill PV, Drizd TA, Johnson CL. NCHS growth curves for children birth - 18 years: United States. Vital Health Stat. 1977;1–4(165):1–74.
- Luscombe M, Owens B. Weight estimation in resuscitation: is the current formula still valid? Arch Dis Child. 2007;92(5):412–5. doi: 10.1136/adc.2006.107284
- Young KD, Korotzer NC. Weight estimation methods in children: a systematic review. Ann Emerg Med. 2016;68(4):441–451.e10. doi: 10.1016/j.annemergmed.2016.02.043
- Park J, Kwak YH, Kim DK, et al. A new age-based formula for estimating weight of Korean children. Resuscitation. 2012;83(9):1129–1134. doi: 10.1016/j.resuscitation.2012.01.023
- Cattermole GN, Leung M, Mak P, et al. Children’s weights correlate more strongly with mid-arm circumference (MAC) than with age, height or foot-length. J Emerg Med. 2009;37(2):228–229. doi: 10.1016/j.jemermed.2009.06.051
- Kuczmarski RJ, Kuczmarski MF, Roche AF. 2000 CDC growth charts. Top Clin Nutr. 2002;17(2):15–26. doi: 10.1097/00008486-200203000-00006
- De Onis M, Garza C, editors. Comparison of the WHO child growth standards and the CDC 2000 growth charts. A new 21st-century international growth standards for infants and young children; April 2 2006. San Francisco CA: The Journal of Nutrition; 2007.
- A health professional’s guide for using the new WHO growth charts. Paediatr Child Health. 2010;15(2):84–90. doi: 10.1093/pch/15.2.84
- Hofer CK, Ganter M, Tucci M, et al. How reliable is length-based determination of body weight and tracheal tube size in the paediatric age group? The Broselow tape reconsidered. BJA. 2002;88(2):283–285. doi: 10.1093/bja/88.2.283
- Flannigan C, Bourke TW, Sproule A, et al. Are APLS formulae for estimating weight appropriate for use in children admitted to PICU? Resuscitation. 2014;85(7):927–931. doi: 10.1016/j.resuscitation.2014.03.313
- Sandell JM, Charman SC. Can age-based estimates of weight be safely used when resuscitating children? Emerg Med J. 2009;26(1):43–7. doi: 10.1136/emj.2008.061119
- Mafisa M. Validation of three weight estimation formulae in children attending the Tshwane district health services clinics [dissertation]. Pretoria: University of Pretoria; 2014.
- Marikar D, Varshneya K, Wahid A, et al. Just too many things to remember? A survey of paediatric trainees’ recall of Advanced Paediatric Life Support (APLS) weight estimation formulae. Arch Dis Child. 2013;98(11):921. doi: 10.1136/archdischild-2013-304360