
 ?Mathematical formulae have been encoded as MathML and are displayed in this HTML version using MathJax in order to improve their display. Uncheck the box to turn MathJax off. This feature requires Javascript. Click on a formula to zoom.
ABSTRACT
In Greenland, traditional marine foods are increasingly being replaced by sucrose- and starch-rich foods. A knock-out c.273_274delAG variant in the sucrase-isomaltase (SI) gene is relatively common in Greenland, with homozygous carriers being unable to digest sucrose and some starch. The variant is associated with a healthier metabolic phenotype in Greenlanders, which is confirmed by SI-knockout mice. We aim to assess if the healthy phenotype is explained by metabolic and microbial differences and if food and taste preferences differ between SI-genotypes. This paper describes the protocol for a randomised cross-over trial conducted in Greenland in 2022 with two dietary interventions of three days; a traditional meat- and fish-rich diet and a starch-rich Western diet with 11 energy% sucrose. The power calculation showed that 22 homozygous SI-carriers and 22 non-carriers were sufficient to detect a 0.5 mmol/L difference in glycaemic variability (80% power, α=0.05). We enrolled 18 carriers and 20 non-carriers. We examined food preferences at baseline and collected samples before and after each intervention for metabolic, metabolome, and microbiome profiling. Analyses of samples have not been completed yet. The Ethics Committee of Greenland approved the study. Results will be disseminated in international peer-reviewed journals and to the general Greenlandic population. NCT05375656.
Background
The burden of metabolic diseases like type-2-diabetes (T2D) has increased dramatically in Greenland during the past decades [Citation1–3]. To a great concern, intakes of imported foods rich in refined sugar (sucrose) and carbohydrates are also increasing at the expense of the traditional foods, e.g. fish and marine mammals [Citation4]. Studies have found that diets high in fast digesting carbohydrates and sugars are associated with risk of T2D [Citation5,Citation6], and it has been hypothesised that the dietary transition in Greenland is partly responsible for the increasing burden of metabolic diseases, though studies of the indigenous Arctic populations have shown conflicting results [Citation7–9].
Sucrase-isomaltase (SI) is a key enzyme in digestion of sucrose and some starch components [Citation10,Citation11]. However, a genetic variant in the SI gene (rs781470490) resulting in complete loss of SI function is relatively common in Arctic populations; the minor allele frequency is 14.2% in Greenland, while being very rare in non-Arctic populations [Citation12]. Recent results showed that the 2.1% who inherited the SI risk allele from both parents, i.e. the homozygous (HO) carriers, in the Greenlandic population survey had a healthier adult metabolic profile compared to those who inherited the variant from one parent, i.e. heterozygous (HE), and the non-carriers, i.e. wild type (WT) individuals. This healthier metabolic profile included a lower BMI (−2.0 kg/m2, p = 3.1x10⁻⁵), fat percentage (−3.3%, p = 3.7x10⁻⁴), body weight (−4.8 kg, p = 5.1x10⁻⁴), and lipid levels (for triglyceride levels: −0.27 mmol/L, p = 2.3 x10⁻⁶), which were not explained by the reported lower intake of sucrose in dietary interview. Interestingly, a study of a knockout mouse model has confirmed the healthy phenotype [Citation12]. Furthermore, there was an indication of a lower risk of some cardiovascular diseases in adult Greenlanders [Citation12].
The differences in the above-mentioned measures might be explained by increased fermentation of undigested carbohydrates by the gut microbiota, since the Greenlandic HO carriers had increased circulating levels of acetate [Citation12]. Acetate is produced by bacterial fermentation of carbohydrates and circulating levels increase after microbial fermentation [Citation13]. Decreased SI activity has also been associated with lower abundance in the human gut of Parabacteroides [Citation14], a bacterial genus that has been associated with higher body weight and fat mass in rats [Citation15].
Intriguingly, when fed with three diets, both the SI HO and the WT mice preferred the high-sucrose-high-fat diet. The HO mice consumed some chow and very limited high-sucrose diet, while the WT mice consumed some high-sucrose diet and limited chow. Despite similar energy intakes, the HO mice had a lower body weight and a lower fraction of body fat. In humans, however, no evidence exists on food preferences among SI deficient individuals.
With a high frequency in Greenland of a variant that results in complete loss of SI function, we can obtain knowledge on the consequences of SI deficiency in humans, as well as define the underlying mechanisms. Moreover, with increasing intake of carbohydrate and especially sucrose [Citation4] in the Greenlandic population, the effects of the variant become highly relevant to address and the metabolic and microbial effects of the current dietary changes with a diet higher in carbohydrates, might be less harmful in HO carriers of the SI-variant compared to others.
This paper presents the protocol of a dietary intervention assessing the effects of the SI variant. The data collection was completed in 2022. The analyses of biological samples as well as data processing have not been completed yet.
Hypotheses and aims
In this study, we aimed to quantify effects of the SI knockout variant on metabolism, dietary habits, and food preferences. The study is the first assessing the effect of a complete loss of SI function, which mainly exists in Arctic populations.
We suspect differences between HO and WT individuals to be large on a Western diet high in carbohydrate and small on a traditional Greenlandic diet high in protein and fat. We will address the following hypotheses:
Primary hypothesis we will quantify
The difference in glycaemic variability between the Western diet and the Greenlandic diet is larger for WT individuals than for HO carriers.
Secondary hypotheses we will explore
On their habitual diet, the glycaemic variability is lower for HO carriers than for WT individuals.
For other metabolic markers, the effect of the Western diet differs between HO carriers and WT individuals.
For other metabolic markers, the effect of the Greenlandic diet is similar for HO carriers and WT individuals.
HO carriers and WT individuals have different food preferences:
HO carriers consume less high-sugar-low-fat foods than WT individuals.
HO carriers consume the same amount of high-sugar-high-fat foods as WT individuals.
HO carriers have a lower preference and acceptance for sweet taste and sweet foods compared to WT individuals.
HO carriers have a higher preference for savoury foods compared to WT individuals.
HO carriers have a higher preference for high-fat sweet foods than for low-fat sweet foods.
WT individuals and HO carriers have different sensory perceptions:
HO carriers can differentiate between a solution of sucrose and a solution of fructose+glucose and WT individuals cannot.
HO carriers perceive sucrose sweetness as more intense than WT individuals.
HO carriers and WT individuals perceive the sweetness intensity similarly for fructose and glucose.
HO carriers rate liking of sucrose lower than for fructose and glucose, while WT individuals rate the liking of the sugars similarly.
WT individuals and HO carriers have different microbiota on some diets:
Diversity and amount of starch-fermenting bacteria are higher in HO carriers than in WT individuals.
On a Western diet, the amount of starch-fermenting bacteria as well as faecal and circulating levels of short chain fatty acids increase more in HO carriers than in WT individuals.
A Greenlandic diet alters the microbiota similarly for HO carriers and WT individuals.
Materials and methods
Study design
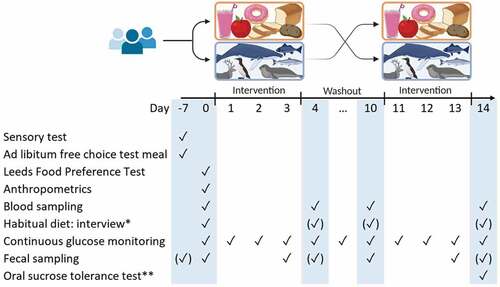
The study was conducted in Maniitsoq and Nuuk in 2022. First, we collected observational data at baseline to assess food- and taste preferences in HO SI-carriers vs. WT individuals in Greenland. Secondly, we performed a crossover interventional study to assess metabolic and microbial effects of two different diets (). Participants followed each of the diets for three days, which is considered sufficient to observe an effect on continuous blood glucose levels and faecal microbial composition [Citation16].
Figure 1. Study outline: Two 3-day diet intervention periods separated by one 7-day wash-out period. Participants had five visit days (blue). ✓ marks the main days a measurement or sample was taken, i.e. for most participants, and (✓) marks days the measurement/sample was taken, if not possible on the main day. *Dietary interview performed on one of the marked visits. **Oral sucrose tolerance test performed before day −7 for participants recruited by symptoms (unknown genotype).
Intervention diets
We conducted a user-involvement study in 2021–2022 before the intervention study in order to plan an optimal dietary intervention that would be acceptable in a modern Greenlandic society and would induce an effect without causing severe symptoms. HO carriers as well as WT individuals were interviewed using a semi-structured interview guide about their experiences with eating foods containing sucrose and starch as well as their opinion on research in Greenland on diet and Genetics. The methods and results from this study will be published separately, but the information resulted in the following two different diets being provided to participants:
Western diet: high in starch mostly from bread and pasta. The diet had a relatively high content of sucrose from fruit yoghurt, fruits, orange juice, and biscuits. Dinner meals were frozen convenience meals, i.e. pasta dishes and pizza, supplied by extra vegetables. The nutrient composition expressed in percentage of total energy derived from each macronutrient, i.e. energy% (E%), was:
Sucrose 11%
Other carbohydrates: 47–49 E%
Protein: 14 E%
Fat: 25 E%
Traditional Greenlandic diet: high content of fish, both raw and dried, reindeer meat, dried whale meat, and eggs, as well as blueberries, an arctic berry which do not contain sucrose. The majority of the foods were provided frozen and participants prepared dinner meals. The nutrient composition was:
Sucrose: 0 E%
Other carbohydrate: 5 E%
Protein: 36 E%
Fat: 57 E%
The participants were provided enough food to cover the energy requirement of most households in order to increase compliance, i.e. 34,500 kJ/day/household (8,246 kcal/day/household). All dairy products were lactose-free. They received a dietary chart with instructions for every meal and were instructed to mark in the chart which foods they consumed and to note if they consumed other foods than those we provided, though this was advised against (Supplementary File 1 and 2). The charts were used to compare compliance between the groups.
Randomisation and blinding
Randomisation of which order the participants received the two intervention diets was performed on a demographically matching pair of one HO carrier and one WT individual. Either the HO carrier or WT individual threw the dice, and both received the diets in the same order to achieve two similar groups, as the sample size was relatively small.
Blinding of participants and personnel conducting the study was not possible, due to the nature of the intervention.
Participants and recruitment
We aimed to include 22 healthy HO carriers and 22 WT individuals (≥18 y). We recruited participants from Maniitsoq and Nuuk, where 31 HO SI-carriers have been identified in previous population surveys [Citation12]. In total, we enrolled 18 HO carriers and 20 WT individuals (27 women and 11 men, mean age = 51 years), of which 17 HO carriers and 16 WT individuals completed the whole intervention study.
Potential participants were invited by letter and/or contacted by phone or visited at their home. In Nuuk, we recruited additional HO SI-carriers by inviting individuals via social media, the local newspaper, and posters. Specifically, in the ads we asked individuals who were interested in participating to contact us if they experience stomach aches, bloating, and/or diarrhoea when eating foods with sugar. Individuals meeting the other criteria described below were subsequently screened for inclusion by performing an oral sucrose tolerance test after an overnight fast to confirm sucrose intolerance. For this, we used 25 g sucrose dissolved in 250 g water, measuring blood glucose using finger-prick device (FreeStyle Lite) at fasting, 30 minutes, 60 minutes, and 120 minutes after ingestion. Participants whose blood glucose levels increased less than 10% at any timepoint post ingestion, were included and genotyped afterwards. Participants recruited from the population survey completed the oral sucrose tolerance test at the end of the study, to confirm the inability or ability to digest sucrose, by using the continuous glucose monitoring device already attached to them.
WT individuals were all recruited from the population surveys. We included one WT individual as control for each SI HO carrier to achieve a balanced study. To achieve two groups with similar demographics, each WT individual was recruited to roughly match the HO carriers on gender, age, BMI at timepoint of the population survey, and Inuit/European genetic admixture. These characteristics were all available from the population surveys, hence, genetic admixture was not available for HO carriers from the open recruitment, for which we assumed a genetic admixture similar to the known HO carriers from the population surveys.
Inclusion criteria
HO group: HO carriers of the SI knock-out variant.
HO group: <10% increase in blood glucose in an oral sucrose tolerance test.
WT group: non-carriers of the SI knock-out variant.
WT group: >10% increase in blood glucose in an oral sucrose tolerance test.
Exclusion criteria for both groups
Severe gastrointestinal disorders, e.g. inflammatory bowel disease, gastrointestinal cancer, and ulcer.
Known diabetes.
HO carriers of the TBC1D4 variant, a T2D high-risk variant [Citation17].
When a WT participant dropped out, we recruited a new WT participant when possible, matching the HO carrier of the original match. As all known HO carriers at the two study sites were invited as well as all screening-detected HO individuals, it was not possible to recruit new HO individuals in case of a drop-out.
Outcomes and measurements
All interviews as well as oral and written instructions were conducted in either Greenlandic or Danish depending on the preference of the participant. The questionnaires presented in the supplementary files have been translated to English only for publication purpose.
Continuous glucose monitoring (primary outcome)
during the intervention and wash-out (habitual diet), participants had their blood glucose monitored using the 14-day Freestyle Libre Pro system. The device was inserted on the back of the upper left or right arm and was replaced as soon as possible at the study facility or the participant’s home in case it got detached. Glycaemic variability is the primary outcome, measured as mean amplitude of glucose excursion (MAGE).
Leeds Food Preference Questionnaire (LFPQ)
The test was performed on a computer and gave an implicit measure of wanting for different foods by measuring reaction time in a forced-choice procedure as well as explicit measure of liking for different foods using visual analogue scales [Citation18]. Pictures of 16 foods (four types) were used, representing four combined food categories: high-fat savoury foods, low-fat savoury foods, high-fat sweet foods, and low-fat sweet and were chosen to suit Greenlandic users [Citation18] (Supplementary Figure S1–S4). In the forced choice procedure, participants were forced to choose as fast as possible between two foods from different food categories, presented at the same time with a total of 96 combinations. In the other part of the test, participants rated their explicit liking for each food on a visual analogue scale, matching the participant’s perception in that given moment. Before the test, participants were introduced to all food images to ensure they recognised the foods and instructed in the task verbally and in writing in the preferred language.
Sensory test
The test was performed after an overnight fast and consisted of two parts. First, in a two-alternative forced choice test, the participants were given 1) a sucrose solution (4.76% of total weight (wt%)) and 2) a glucose+fructose solution (3.78 wt% and 1.79 wt% resp.) that were iso-intense in sweetness. They chose the sample that appeared most sweet as well as the one they liked the most. This was repeated with a new pair of samples with the same two solutions. Next, the participants completed a hedonic rating for 1) sucrose (4.76 wt%), 2) fructose (4.03 wt%), 3) glucose (8.09 wt%), and 4) glucose+fructose (3.78 wt% and 1.79 wt% resp.), rating each sample on a 10 cm visual analogue scale in terms of sweetness, going from “not sweet at all” to “very sweet”, and liking, going from “not at all” to “neutral” to “like it a lot”. The participants were instructed to mark the continuous line in whatever place that reflected their perception.
The sugars were dissolved Nuuk Imeq® water, which has a content of total dissolved solids of <0.5 mg/mL. Approximately 20 mL of each sample were served in a randomised order at room temperature. Participants were also provided with water for mouth rinsing between each tasting as well as an empty cup in case the participant wished to spit the sample out after tasting. Each HO and WT pair received the samples in the same order. Participants were instructed orally in the test as well as given a questionnaire with instructions (Supplementary File 3).
Ad libitum test meal
After an overnight fast and the sensory test, each participant was given 20 minutes to eat from a buffet with different foods to assess preferences for sweet-taste and content of sucrose and fat. Foods in the test meal included: digestive biscuits, maria biscuit, crispbread, salty cracker, hardtack, strawberry jam, sweet hazelnut cocoa spread, butter, raisins, dried apricots, small cinnamon rolls, ham, salami, dried whale meat, chocolate, mixed gummies and liquorice, milk, bread rolls, pears, oranges, sugar, honey, orange juice, coffee, tea. See Supplemental Table S1 for a brand-specific list. Each plate from the buffet was weighed before and after the 20 minutes to estimate the intake of each food for the participant. In case the participant did not finish eating and/or drinking before the 20 minutes, we weighed the leftover food and/or drinks and subtracted the amount from the amount taken from the buffet.
Diet
We assessed habitual diet in an interview using an expanded version of the semi-quantitative food frequency questionnaire (FFQ) used in the Greenlandic population survey [Citation19], asking the participants about the frequency and portion size of 81 different foods, food groups, and beverages.
Blood samples after an overnight fasting
Blood samples were drawn at four visits in total for biochemical analyses of the parameters in . In the sucrose tolerance test, a blood sample was drawn 2 hours post ingestion to measure short chain fatty acids as an indication of microbial fermentation.
Table 1. Overview of fasting blood samples collected from each participant. All samples were collected at baseline. * Triglycerides, VLDL-, LDL-, HDL-, total and remnant cholesterol. ** At screening for participants from the open recruitment.
Blood samples were drawn from the antecubital vein after an overnight fast. Whole blood was allowed to clot. Samples for biochemical analysis of plasma glucose were collected in sodium-fluoride coated tubes, and samples for lipodomics, lipids, metabolomics, proteomics, free short chain fatty acids, and biobank plasma were from blood sampled in chilled EDTA coated tubes. Samples for plasma C-reactive protein and lipids were collected in lithium-heparin coated tubes. Both were put on ice immediately following sampling. Samples were centrifuged shortly after collection for 10 minutes at 1680 G at room temperature, except for samples used for analysis of HbA1c and serum insulin concentrations. Samples for analysis of serum insulin concentration were centrifuged 30 minutes after collection.
Blood samples were stored at −20°C at the study site. Samples from Maniitsoq were shipped to Nuuk at −20°C, where they were stored at <-20°C. All samples were shipped together to Denmark at −20°C and subsequently stored at −80°C upon arrival.
Plasma glucose and lipids were analysed by an enzymatic method (Siemens Atellica CH 930, Germany) and LDL-cholesterol was estimated using the equation: LDL-cholesterol = total cholesterol – (HDL-cholesterol + triglycerides ∙ 0.45). Serum insulin was analysed using an enzyme-linked sandwich immunoassay (Siemens Atellica IM Analyser, Germany). C-reactive protein was measured by Latex-enhanced immunturbidimetry (Siemens Atellica CH 930, Germany). HbA1c was measured immediately after blood sampling using a monoclonal antibody agglutination reaction (DCA Vantage ®, Siemens Healthineers).
Samples have been stored for analyses of lipidomics, metabolomics, and proteomics by The Novo Nordisk Foundation Center for Basic Metabolic Research, University of Copenhagen. The exact analysis method will be decided when samples are to be analysed.
Faecal samples
Participants collected faecal samples at home before each dietary intervention and on the last day of the intervention or the subsequent day. The participants were instructed to put the samples in their freezer as soon as they were collected, and they received a sampling kit as well as a cooling bag with 1–2 freezing elements for transporting the samples to the study cite. Following every faecal sample, participants were asked to fill out a short questionnaire, giving information on date and time for passing the sample, use of antibiotics during the previous 3 months, type of stool using the Bristol scale [Citation20], and stool frequency during 2–3 days prior to sampling including the sampling day (Supplementary File 4). The latter two questions served to address gastrointestinal effects of the two intervention diets.
Faecal samples were stored at −20°C at the study site. Samples from Maniitsoq were shipped to Nuuk at −20°C, were they were stored at <-20°C. All samples were shipped together to Denmark at −20°C and subsequently stored at −80°C upon arrival at the Novo Nordisk Foundation Center for Basic Metabolic Research, University of Copenhagen, for later analyses of the content of carbohydrate, short chain fatty acids, pH (indication of fermentation [Citation21]), and microbiota.
Anthropometric assessment
Weight and bioimpedance were measured on a leg-to-leg Tanita Body Composition Analyser (SC-330, Tanita Corporation, Tokyo, Japan). Height was measured to the nearest 0.5 cm using a Tanita Leicester portable height measure, and waist- and hip circumference were measured to the nearest 0.5 cm using a measuring tape with a button allowing fixation for easy measurement. The participant was wearing light underwear and the same devices were used on all participants.
Sample size
Glycaemic variability has not yet been assessed in individuals with SI deficiency. In a child with SI deficiency, the maximum increase in blood glucose during 4 h was found to be 50% lower in response to a starch load than in response to a glucose load [Citation22]. As we compare adult individuals with complete lack of SI with adult individuals with normal SI function, we would expect a large effect on glycaemic variability of the starch/sucrose rich diet. Assuming the WT group has an average MAGE of ≈1.7 mmol/L (SD≈0.6 mmol/L) as found in studies of healthy adults [Citation23–25], and that MAGE would be 30% lower in HO carriers on the carbohydrate-rich diet, i.e. a difference of 0.5, requires a sample size of 22 HO and 22 WT individuals when using a 5% significance level to obtain a power of 80%. Sample size calculation was performed in R software [Citation26] using the equation: , where n1 and n2 are the required sample size of each group, σ the standard deviation, and d the smallest relevant difference between the groups [Citation27]. Very limited research has been conducted with SI deficient individuals, and no dietary interventions, hence, there is currently no data to support assumptions regarding effect sizes for all the outcomes.
Data management and statistical analyses
Analyses will be performed as complete-case analyses, i.e. data will not be imputed in case of missing observations, and the drop-out reasons will be evaluated. We will exclude observations from participants who substituted ≥3 of the main meals during the 3 intervention days of a diet, i.e. breakfast, lunch, and/or dinner, with foods with a different macronutrient composition. The primary hypothesis will be assessed using a linar regression model to compare HO carriers and WT individuals on the difference in MAGE between the Western diet and the Iniut diet (∆MAGE). To assess the impact of covariates, a linear mixed effects model will also be fitted using age, sex, BMI, and admixture (0–1) as fixed effects, and study site as a random effect.We will assess if residuals are normally distributed before fitting the models. If not, we will transform the variables to another scale, e.g. log-scale, to meet the model assumptions.Secondary hypotheses will be explored using descriptive statistics and the effects of SI-genotype will be assessed for some of these in secondary analyses. Data management and analyses will be performed using R software [Citation26], except for LFPQ files, which will be processed using the E-Prime software before the analyses.
Discussion
This study assesses the effects of complete loss of SI function on metabolism, microbiota composition, dietary habits, and food preferences in an adult Greenlandic population. Moreover, the study address some of the consequences of the rapidly increasing westernisation of the Greenlandic lifestyle and how this affects individuals depending on their SI genotype. This is highly relevant with increasing intakes of carbohydrate and especially sucrose in the Greenlandic population. The metabolic and microbial effects of the dietary changes might be less harmful in HO carriers of the SI-variant. Interactions between environment and genetics have rarely been found so far [Citation28]. However, in a unique isolated population like the Greenlandic, interactions are possible to identify due to a high number of functional variants, which are more likely to affect a phenotype, and the occurrence of genetic variants with both relatively high prevalence and effect size [Citation29–31]. Furthermore, the SI enzyme might prove a useful treatment target for prevention of cardiometabolic diseases, and it is possible to study the effects of complete lack of SI function in humans only in the Arctic due to the relative high prevalence of the SI-variant.
A major strength of the study is the aim to give a nuanced profiling of the HO carriers by addressing a variety of effects of the variant, i.e. both food and taste preferences, and how the effects of two diets depend on the genotype with respect to gut microbiota, glycaemic variability and other cardiometabolic markers. The short intervention period has likely increased both participation rate and compliance. Furthermore, the fact that more than 100% of the participants’ energy requirements were provided of the interventional diets ensured an optimal compliance, especially as the household were able to follow the same diets. Another major strength is the cross-over design, which increases the power of the study and matching the groups on different parameters to achieve a higher degree of similarity. Randomising the order of the diets removed the risk of a systematic carry-over effect of the first diet. Including two different study locations is a strength when assessing diet-related hypotheses, as there are dietary differences between locations in Greenland [Citation32]. Another major strength was having a local research assistant, who was responsible for interviewing and communicating with participants in either Greenlandic or Danish, depending on the participant’s preference. This helped to avoid measurement errors. Close contact with the participants during the whole study period also likely increased compliance. The fact that the principal investigator was involved in all steps and field work at both study sites have likely reduced the variation in measurements and variation between study sites. Finally, conducting a user involvement study prior to the intervention is a major strength, as this ensured an intervention acceptable to the participants as well as confirmed that the population supports the research.
There are some limitations to the study. General side effects of the intervention diets were not systematically recorded, though frequency of bowel movement and stool type were recorded. Hence, there might be unknown side effects to the diets. Moreover, we did not systematically ask participants about unrelated illness during the study period, like a common cold, and the participants informed us themselves. This can potentially affect dietary intake and sensory evaluation, though it should not bias the results, assuming the groups are equally likely to get ill. Finally, the number of participants was limited by the number of HO carriers, and despite a high participation rate of these, we did not achieve the number of participants needed according to the power calculation. There were HO carriers identified in the population surveys in other towns in Greenland, however, there were few living individuals at each location, and recruiting participants from or in different towns in Greenland is in general difficult and expensive due to long distances and a need for transportation by boat or airplane. It was therefore not possible to recruit more carriers in this study. An option for open recruitment and screening in Maniitsoq, like in Nuuk, could potentially have increased the number of HO carriers in the study, and is recommended for future research involving HO carriers. Since some HO carriers were retrieved from an open recruitment and all WT individuals were retrieved from the population surveys, it is possible that the carrier group was more motivated for participating as well as healthier compared to the WT group. We would expect a difference in motivation as a consequence of their sucrose intolerance as well, which is not possible to control. However, there is also a selection bias in the population surveys and only some of the invited WT individuals were interested in participating, thus minimising the differences in motivation and general health between the groups. Furthermore, we attempted to balance the groups using e.g. BMI.
It is essential that research conducted in indigenous populations is considered important and ethically sound to the population involved. In a recent Sharing Circle study, previous participants from the 2018 Greenlandic population survey supported genetic research in diabetes and considered it important. However, they also requested an ongoing debate about the topic and expressed that “when you do research, it is also important that you come back, and that is something we are missing” [Citation33]. We therefore consider it highly important to communicate the results to the Greenlandic population as well as the implications. We plan to do this through e.g. the Greenlandic public media and local citizen meetings, as well as to discuss the results and the public health potentials with relevant institutions like the Greenlandic Nutrition Council.
Ethics
The Ethics Committee of Greenland (KVUG 2021–19) approved the study. Participants were informed about the study objectives, procedures, and their rights both verbally and in writing and signed a written consent for 1) participation, 2) storage of biobank samples in Greenland for future analyses within metabolism in either Greenland or Denmark, 3) whether they wish to receive information on blood measures outside normal range as well as inherited sucrose intolerance (SI-genotype), and for individuals enrolled through open screening: 4) genome sequencing in order to estimate admixture and SI-genotype. The participants received no remuneration, however, all foods provided during the study were free of charge.
Feedback to participants
Upon completion of the study, each participant who wish so received information on their SI genotype. To each HO carrier, we explained how and why the SI-variant affect them in layman’s terms and gave them advise on how to avoid or better control gastrointestinal problems. We also handed out or send the information explaining the effects of the SI-variant (Supplementary Figure S5) as well as a list showing the sucrose content of selected foods (Supplementary Table S2), so they knew which foods to avoid. Participants received results on HbA1c and lipid levels, and in case any were outside the normal range, they were encouraged to contact the local healthcare centre or hospital.
Risk and side effects of the intervention
Short-term side-effects of the intervention are anticipated to be bloating, diarrhoea, stomach aches, constipation, and other similar gastrointestinal problems. This is in line with reported side effects by the HO carriers, where some reported increased bowel movements and bloating on the western diet. Symptoms disappeared after completion of the three days intervention, and we anticipate that there are no long-term side effects of the intervention diets.
The only invasive examinations were the blood sampling. We minimised the number of planned blood samples by using the Freestyle Libre Pro sensor during the oral sucrose tolerance test, thereby avoiding drawing three blood samples. For individuals that were screened with an oral sucrose tolerance test before enrolment, we uses a finger-prick device.
Supplemental Material
Download Zip (3.3 MB)Disclosure statement
MEJ has received research grants from Boehringer Ingelheim, Novo Nordisk AS, and Sanofi Aventis. MEJ holds shares in Novo Nordisk AS. The remaining authors report there are no competing interests to declare.
Supplementary material
Supplemental data for this article can be accessed online at https://doi.org/10.1080/22423982.2023.2178067
Additional information
Funding
References
- Sagild U, Littauer JØ, Jespersen CS, Andersen S. Epidemiological studies in Greenland 1962-1964. I. Diabetes mellitus in Eskimos. Acta Med Scand. 1966;179(1):29–10.
- Kromann N, Green A. Epidemiological studies in the Upernavik district, Greenland - - Incidence of some chronic diseases 1950-1974. Acta Med Scand. 1980;208(5):401–406.
- Jørgensen ME, Borch‐Johnsen K, Witte DR, Bjerregaard P. Diabetes in Greenland and its relationship with urbanization. Diabetic Med. 2012;29(6):755–760.
- Jeppesen C, Bjerregaard P. Consumption of traditional food and adherence to nutrition recommendations in Greenland. Scand J Public Health. 2012;40(5):475–481.
- Hu FB, Manson JE, Stampfer MJ, et al. Diet, lifestyle, and the risk of type 2 diabetes mellitus in women. N Engl J Med. 2001;345(11):790–797.
- Sluijs I, Van Der Schouw YT, Van Der ADL, et al. Carbohydrate quantity and quality and risk of type 2 diabetes in the European Prospective Investigation into Cancer and Nutrition-Netherlands (EPIC-NL) study. Am J Clin Nutr. 2010;92(4):905–911.
- Adler AI, Boyko EJ, Schraer CD, et al. Lower prevalence of impaired glucose tolerance and diabetes associated with daily seal oil or salmon consumption among Alaska Natives. Diabetes Care. 1994;17(12):1498–1501.
- Bjerregaard P, Pedersen HS, Mulvad G. The associations of a marine diet with plasma lipids, blood glucose, blood pressure and obesity among the Inuit in Greenland. Eur J Clin Nutr. 2000;54(9):732–737.
- Jeppesen C, Bjerregaard P, Jørgensen ME. Dietary patterns in Greenland and their relationship with type 2 diabetes mellitus and glucose intolerance. Public Health Nutr. 2014;17(2):462–470.
- Amiri M, Naim HY. Posttranslational processing and function of mucosal maltases. J Pediatr Gastroenterol Nutr. 2018;66(Suppl 3):S18–s23.
- Gericke B, Amiri M, Naim HY. The multiple roles of sucrase-isomaltase in the intestinal physiology. Mol Cell Pediatr. 2016;3(1):2.
- Andersen MK, Skotte L, Jørsboe E, et al. Loss of sucrase-isomaltase function increases acetate levels and improves metabolic health in greenlandic cohorts. Gastroenterology. 2022;162(4):1171–1182.e3.
- Pomare EW, Branch WJ, Cummings JH. Carbohydrate fermentation in the human colon and its relation to acetate concentrations in venous blood. J Clin Invest. 1985;75(5):1448–1454.
- Henström M, Diekmann L, Bonfiglio F, et al. Functional variants in the sucrase-isomaltase gene associate with increased risk of irritable bowel syndrome. Gut. 2018;67(2):263–270.
- Lecomte V, Kaakoush NO, Maloney CA, et al. Changes in gut microbiota in rats fed a high fat diet correlate with obesity-associated metabolic parameters. PLoS One. 2015;10(5):e0126931.
- Sonnenburg JL, Bäckhed F. Diet-microbiota interactions as moderators of human metabolism. Nature. 2016;535(7610):56–64.
- Moltke I, Grarup N, Jørgensen ME, et al. A common Greenlandic TBC1D4 variant confers muscle insulin resistance and type 2 diabetes. Nature. 2014;512(7513):190–+.
- Finlayson G, King N, Blundell J. The role of implicit wanting in relation to explicit liking and wanting for food: implications for appetite control. Appetite. 2008;50(1):120–127.
- Jeppesen C, Jorgensen ME, Bjerregaard P. Assessment of consumption of marine food in Greenland by a food frequency questionnaire and biomarkers. Int J Circumpolar Health. 2012;71. DOI:10.3402/ijch.v71i0.18361.
- Lewis SJ, Heaton KW. Stool form scale as a useful guide to intestinal transit time. Scand J Gastroenterol. 1997;32(9):920–924.
- Zhao L, Zhang F, Ding X, et al. Gut bacteria selectively promoted by dietary fibers alleviate type 2 diabetes. Science. 2018;359(6380):1151–1156.
- Burgess EA, Levin B, Mahalanabis D, Tonge RE. Hereditary sucrose intolerance: levels of sucrase activity in jejunal mucosa. Arch Dis Child. 1964;39(207):431–443.
- Hanefeld M, Sulk S, Helbig M, et al. Differences in glycemic variability between normoglycemic and prediabetic subjects. J Diabetes Sci Technol. 2014;8(2):286–290.
- Ma CM, Yin FZ, Wang R, et al. Glycemic variability in abdominally obese men with normal glucose tolerance as assessed by continuous glucose monitoring system. Obesity. 2011;19(8):1616–1622.
- Wang YM, Zhao LH, Su JB, et al. Glycemic variability in normal glucose tolerance women with the previous gestational diabetes mellitus. Diabetol Metab Syndr. 2015;7:82.
- R Core Team. R: a language and environment for statistical computing. Vienna Austria: R Foundation for Statistical Computing; 2017.
- Riffenburgh RH. Statistics in medicine. San Diego: Elsevier Science & Technology; 2012.
- Aschard H. A perspective on interaction effects in genetic association studies. Genet Epidemiol. 2016;40(8):678–688.
- Andersen MK, Hansen T. Genetics of metabolic traits in Greenlanders: lessons from an isolated population. J Intern Med. 2018;284(5):464–477.
- Schnurr TM, Jørsboe E, Chadt A, et al. Physical activity attenuates postprandial hyperglycaemia in homozygous TBC1D4 loss-of-function mutation carriers. Diabetologia. 2021.
- Senftleber N, Jørgensen ME, Jørsboe E, et al. Genetic study of the Arctic CPT1A variant suggests that its effect on fatty acid levels is modulated by traditional Inuit diet. Eur J Hum Genet. 2020;28(11):1592–1601.
- Bjerregaard P, Jeppesen C. Inuit dietary patterns in modern Greenland. Int J Circumpolar Health. 2010;69(1):13–24.
- Olesen I, Hansen NL, Jørgensen ME, et al. Perspektiver på genetiske undersøgelser af diabetes, belyst gennem Sharing Circles. En kvalitativ undersøgelse i Qasigiannguit. [Perspectives on genetic investigations of diabetes, described in Sharing Circles. A qualitative study in Qasigiannguit. In Danish.]. Denmark: National Institute of Public Health, Univeristy of Southern Denmark; 2020. https://www.sdu.dk/da/sif/rapporter/2020/sharing_circle_dk.