
ABSTRACT
Circadian rhythms influence the immune response. Its disruption can therefore alter the immune response of the host to pathogens. This study was designed to investigate the effects of two circadian disruptors, sleep-deprivation (SD) and daylight-restriction (DLR), on the immune response to septicemia which was induced using low-dose Escherichia coli (0.1 mL i.p.) (ECIS). Forty-eight Wistar rats (150–180 g) were grouped into six (n = 8): I(control), II(control+ECIS), III(SD12hrs+ECIS), IV(SD96hrs+ECIS), V(DLR12hrs+ECIS), and VI(DLR96hrs+ECIS) respectively. Following either SD or DLR in experimental groups, ECIS was induced and systemic immune response was evaluated after 7 days. Innate (leucocytes, eosinophils, IFN-γ and TNF-α) and adaptive (immunoglobulin -G and -M) immune responses was altered in short and long-term sleep deprived ECIS groups while only innate immune responses were impaired in the short-term daylight-restricted group. Spleen histology exhibited pathologies that worsened with increasing durations of SD and DLR. In conclusion, the immune response in Wistar rats to systemic infection is weakened to a greater extent by sleep-deprivation than by daylight-restriction.
Introduction
Circadian rhythms are endogenous, entrainable biological oscillations, including physical, mental, and behavioral rhythms, of about 24 hours and are driven by the circadian clock [Citation1]. They have major adaptive significance to an organism as they help synchronize the organism to periodic fluctuations in the external environment and also facilitate integration of the organisms’ internal milieu [Citation2]. The secretion of many enzymes and hormones that are essential to life have been reported to follow a circadian secretory pattern that more often than not, aligns with the photoperiod [Citation3]. Furthermore, various systems in the body have also been observed to follow a circadian rhythm in ensuring homeostasis. Circadian clocks that drive these rhythms may be considered as an internal time-keeping system found essentially within all eukaryotic cells [Citation1]. Studies have reported that sleep, light, the circadian system, and the immune system are often integrated to anticipate environmental changes and optimize adaptations of the organism to such changes [Citation4]. Alterations in the normal 24-hour circadian rhythm have been reported to exert physiological and behavioral impacts in the body [Citation2]. This phenomenon, often termed circadian rhythm disruption [Citation5], has been linked with various chronic health conditions such as sleep disorders [Citation6], obesity, diabetes [Citation7], depression, bipolar disorder, seasonal affective disorder [Citation8], heart attacks, atherosclerotic plaques [Citation9], and increased susceptibility to infections and allergies [Citation10]. It has been suggested that one of the most common health consequence of circadian rhythm disruption, may be the dysregulation of the immune system [Citation11].
Sleep is a recurrent physiological and behavioral state of bodily rest and reduced consciousness that serves multiple functions including the consolidation of memory and enhancement in immune defense [Citation12]. It is a state of immobility, resulting from the decreased ability to respond to external stimuli, which is rapidly reversible [Citation13]. Sleep deprivation (SD) can be described as a consequence of societal pressure experienced by individuals, with repercussions for autonomic function, the neuro-endocrine system and the immune system [Citation14]. Alterations of the sleep/wake cycle affect the number of circulating lymphocytes, NK cells, and Ab titers in humans and rodents as well as increased inflammatory cytokines such as IL-6, C-reactive protein, and TNF-α [Citation15]. When a challenge to the immune system is presented, the effects of these changes translate into impaired immune function [Citation11].
Light provides the main input to the master clock in the hypothalamic suprachiasmatic nucleus (SCN) that coordinates the sleep-wake world [Citation16]. In mammals, environmental light is the main input that synchronizes the master circadian clock in the hypothalamic suprachiasmatic nucleus (SCN) to the outside world [Citation17]. A well-timed light exposure can entrain the circadian system, which is important for positively affecting an individual’s sleep quality, mood, cognitive abilities and health. Daylight is the natural cue (zeitgeber) for synchronization of the circadian rhythm and the sleep-wake cycle. Exposure to constant dim light or total darkness results in de-synchrony of circadian rhythms. Hence, work-hours that displace sleep to the daytime and work to the nighttime have been reported to interfere with the circadian and homeostatic regulation of sleep [Citation17]. This working hours-induced disruption of normal light exposure and sleep/wake cycle has been suggested to constitute a health problem resulting in cardiovascular diseases, accidents, and cancer [Citation18].
In a previous report that investigated the circadian rhythm disruptive effect of sleep deprivation and daylight restriction on immune response indices [Citation19], it was observed that the onset of anti-immune and oxidative stress effects of daylight-restriction is more sudden than that of sleep-deprivation in male Swiss mice. In this study, acute and chronic effects of sleep-deprivation (SD) and daylight-restriction (DLR) on the systemic immune response to low-dose Escherichia coli-induced septicemia (ECIS) – an inflammatory response to bacteria model, was investigated.
Materials and methods
Animals and experimental design
Forty-eight rats of Wistar strain (150–180 g) were housed and acclimatized for 14 days, prior to experimental procedures, in well-aerated cages, maintained on standard rat chow with free access to drinking water ad libitum, and exposed to natural alternating day and night cycles. All experimental procedures were carried out in accordance with the Guide for the Care and Use of Laboratory Animals [Citation20], published by National Academy Press, 2101 Constitution Ave. NW, Washington, DC 20055, USA. After acclimatization, animals were randomly divided into six groups (n = 8) as follows. Group I was control and were not exposed to sleep deprivation (SD), daylight restriction (DL) or Escherichia coli-induced septicemia (ECIS). Animals in group II were exposed to ECIS only but not SD or DL, while animals in groups III and IV were exposed to SD for 12 and 96 hours and thereafter ECIS, respectively. Animals in groups V and VI were exposed to DL for 12 and 96 hours and thereafter ECIS, respectively.
Procedure for sleep deprivation
Sleep deprivation was induced using the multiple platform method [Citation21]. Briefly, the sleep deprivation chamber was made up of large acrylic tanks (69 × 69 × 31 cm) with 16 elevated platforms measuring 6 cm in diameter and 10 cm high pedestal (covered with wire gauze) surrounded by water to about 1 cm below the platform surface. The top of the compartment was closed with a perforated lid. Perforated plates which had the feed attached to them were clipped to the lid. Water bottles containing drinking water were also inserted through the perforated lid overhead. The design of the feeding plates and water bottles was such that the rat had to stand with its head face upwards while feeding. While residing on the platform, a rat can obtain some level of non-rapid eye movement (non-REM) sleep but upon entering rapid eye movement (REM) sleep, muscle tone becomes lost and this causes the rat to either make partial contact with the water or completely fall into the water resulting in the animal being awakened and having to climb back up to the platform with the aid of wire gauze wrapped around the elevated pedestal. Under these conditions’ experimental animals in group III and IV were exposed to sleep deprivation for 12 hours (6:30am to 6:30pm) and 96 uninterrupted hours (4 days) starting from 6:30am in the morning, respectively.
Procedure for daylight-restriction
Daylight restriction was induced in experimental animals in groups V and VI as previously described [Citation19]. Briefly, animals were transported, while still in their cages, to a ventilated dark room that was restricted from daylight. The experimental animals in group V–VI were fed, had access to water and kept in this dark room for 12 hours (6:30am – 6:30pm) and 96 uninterrupted hours (4 days) also starting from 6:30am in the morning, respectively.
Procedure for induction of systemic inflammation
Systemic inflammation was induced using low-dose Escherichia coli [ATCC 25922) induced septicemia as described by Citation22. Briefly, experimental mice received an intraperitoneal dose (0.1 mL] of 2 to 5 × 10⁷ CFU of freshly cultured E. coli (ATCC 25229) diluted with saline. Animals were thereafter transferred to their laboratory cages and 7 days later blood samples were collected for biochemical analysis.
Blood collection and biochemical analysis
After exposure to ECIS for 7 days, blood samples from each animal per group were obtained from the retro-orbital sinus using a heparinized capillary tube, after light diethyl ether anesthesia into plain and ethylenediaminetetraacetic acid (EDTA) lined sample bottles. Blood collected in the EDTA-lined sample bottles were analyzed for total and differential white blood cell (neutrophils, eosinophil, monocytes, lymphocytes) counts (hemocytometer and Wright’s staining method respectively). Blood samples collected in the plain bottles were allowed to stand at room temperature for 10 minutes and then centrifuged for 10 mins at 3500 rpm. The clear serum obtained was analyzed for interferon gamma (IFN-γ) (BioLegend, UK), tumor necrosis factor-alpha (TNF-α) (BioLegend, UK), and immunoglobulin -G and -M (Abcam, UK) using commercially available ELISA kits, respectively. The spleen of animals in each group were subsequently excised and analyzed for histological differences using Hematoxylin and Eosin stains, respectively.
Statistical analysis
Data obtained are expressed as mean ± SEM. Statistical significance within and between experimental groups was taken at p < 0.05 using 2-Way ANOVA and Newman Keuls’ post-hoc test.
Results
Total and differential white blood cell count in control and experimental groups
The total white blood cell count (count/μL) in groups II (the Escherichia coli-induced septicemia (ECIS) only) IV (sleep deprivation (96 hours)+ECIS) and V (daylight restricted (12 hours)+ECIS) were decreased (p < 0.05) compared to group I (controls) while values in groups III (sleep deprivation (12 hours)+ECIS) and VI (daylight restricted (96 hours)+ECIS) were increased (p < 0.05) compared to group II ().
Figure 1. Total White blood cell count in control and experimental groups.
Neutrophil count was increased (p < 0.05) in group II (ECIS only) (28.0 ± 0.8) compared to control (21.4 ± 1.7%). However, values obtained in groups III (20.0 ± 0.6%), IV (21.2 ± 0.4%), V (23.8 ± 0.5%) and VI (18.6 ± 0.7%) were comparable to control but significantly reduced compared to group II. Lymphocyte count did not differ significantly between control and all other experimental groups. However, compared to controls, eosinophils were decreased in groups II–VI, while compared to group II, eosinophil values were decreased in groups IV, V and VI respectively. Monocyte values compared to control (1.4 ± 0.2%), were increased (p < 0.05) in groups IV (2.2 ± 0.2%) and VI (2.2 ± 0.2%) while in III (2.0 ± 0.3%) and V (1.4 ± 0.3%) values obtained were not significantly different from controls and groups II (1.8 ± 0.4%), respectively ().
Table 1. Differential white blood cell count in control and experimental groups.
Interferon-γ (IFN-γ) level and tumor necrosis factor-α (TNF-α) levels in control and experimental groups
Interferon-γ levels (pg/mL) in the group III (8.73 ± 0.24) and IV (8.95 ± 0.33) was significantly increased compared to controls (7.21 ± 0.17) and ECIS only group (6.34 ± 0.30). Values obtained in groups V (7.00 ± 0.23) and VI (7.38 ± 0.31) were not significantly different from controls and ECIS only (). Tumor necrosis factor-α levels (pg/mL) in groups III (42.70 ± 1.36), IV (46.83 ± 0.67) and VI (43.42 ± 1.52) were significantly increased compared to control (21.5%, 33.7% and 23.56%, respectively) and ECIS only (30.0%, 42.5% and 32.1%, respectively). Values obtained in controls, ECIS only, and group V were not significantly different from each other ().
Figure 2. Interferon gamma levels in control and experimental groups.
Figure 3. Tumor necrosis factor alpha (TNF-α) levels in control and experimental groups.
Immunoglobulin G and M levels in control and experimental groups
The immunoglobulin-G (IgG) values (mg/dL) obtained in the groups II (2.48 ± 0.08), III (2.66 ± 0.08), IV (2.64 ± 0.09) and VI (2.33 ± 0.10) were significantly (p < 0.05) increased compared to controls (1.40 ± 0.10). However, values obtained in group V were 23.7% reduced (p < 0.05) compared to group II, the ECIS only group. The differences in IgG values between control and group V was observed to be statistically insignificant (p > 0.05) (). Immunoglobulin-M (IgM) values (mg/dL) in group II increased by 20.5% compared to control while values obtained in groups III, IV and VI were 22.7%, 33.4% and 34.4% reduced compared to group II (ECIS only), respectively. The IgM values obtained groups IV and VI were also significantly reduced (p < 0.05) compared to control, respectively ().
Figure 4. Immunoglobulin G levels in control and experimental groups. Data is Mean ± SEM n = 8, * indicates values that are significantly different compared to group II (p < 0.05); # indicates values that are significantly different compared to Group I (p < 0.05). I = Control, II = Control + ECIS, III = SD12 + ECIS, IV = SD96 + ECIS, V = DLR 12 + ECIS; VI = DLR96 + ECIS.
Figure 5. Immunoglobulin M levels in control and experimental groups. Data is Mean ± SEM n = 8, * indicates values that are significantly different compared to group II (p < 0.05); # indicates values that are significantly different compared to Group I (p < 0.05). I = Control, II = Control + ECIS, III = SD12 + ECIS, IV = SD96 + ECIS, V = DLR 12 + ECIS; VI = DLR96 + ECIS.
Histological evaluation of the spleen in control and experimental groups
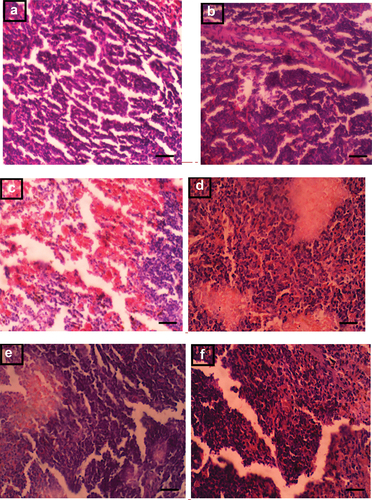
An assessment of spleen samples is shown in (A-F). Samples in group I, the control group, showed spleen with normal architecture that had normal white pulp with no observable lesions (A). Spleen samples from animals in group II (ECIS only) exhibited follicular lymphoid hyperplasia (B) while samples in group III (Sleep deprived (12 hours) + ECIS) showed congestion of the vascular spaces and moderate melanomacrophage hyperplasia (C). In group IV (Sleep deprived (96 hours) + ECIS), spleen samples exhibited moderate follicular lymphoid hyperplasia with tingible body macrophages (D). Spleen samples in group V (Daylight restricted (12 hours) + ECIS) showed moderate follicular lymphoid depletion (E) while samples in group VI (Daylight restricted (96 hours) + ECIS) exhibited moderate follicular lymphoid and melanomacrophage hyperplasia as well as numerous tingible body macrophages (F).
Figure 6. (A-F). Photomicrograph of the spleen in control and experimental groups (x400, Scale bar 50 μm).
Discussion and conclusion
The disruption of circadian rhythms in the body has been associated with the development of diverse health conditions [Citation19,Citation23–25]. A previous study on the effect of sleep deprivation and daylight restriction on the immune system [Citation19], described early onset of anti-immune and oxidative stress effects of daylight restriction compared to sleep deprivation in Swiss mice. This study investigated the effect of these circadian rhythm disruptors on the immune response to systemic inflammation caused by low-dose Escherichia coli-induced septicemia (ECIS), more so that Escherichia coli is the most reported isolated gram-negative organism in adult patients with bacteremia [Citation26], and severe cases may lead to death [Citation27]. The presence of E. coli in the bloodstream often results in the induction of a vigorous host inflammatory response that triggers both leukocytosis and leukopenia resulting eventually in sepsis [Citation28]. It is likely that the reduced total white blood cell and eosinophil counts observed in the ECIS-only group may be attributed to bacteria-induced systemic inflammation resulting in impeded bone marrow function and increased leukocyte–platelet interaction as has been reported in blood septicemia [Citation29,Citation30]. Furthermore, the increase in neutrophil and monocyte counts observed in the ECIS group may be ascribed to bone marrow response to the presence of bacterial infection in the peripheral circulation [Citation31–33].
However, interferon-γ (INF-γ) and tumor necrosis factor-alpha (TNF-α), which are both proinflammatory cytokines [Citation34], were not elevated in the ECIS group. This suggests that the induced septicemia in this group may not have activated chronic proinflammation cytokines at the time of sample collection (7 days post exposure). The consequent lymphoid hyperplasia noted in this group is however associated with the presence of systemic infection [Citation35]. In addition, the elevated levels of immunoglobulin G, an antibody that protects against and controls infection, and immunoglobulin M that serve as the first line of host defense against infection and play important roles in immune regulation and tolerance [Citation36], in the ECIS group suggested activation of immune response.
The alterations in the innate and adaptive immune parameters resulting in increased infection risk have been documented to be associated with sleep deprivation, especially when prolonged [Citation15,Citation37]. The decreased total WBC and increased monocytes () in the prolonged sleep-deprived group (SD96hrs + ECIS) but not short-term sleep-deprived group (SD12hrs + ECIS) compared to ECIS only and control appears consistent with other reports and suggests a breakdown of the host defense mechanisms against microorganisms in prolonged sleep-deprived animals [Citation37,Citation38]. Both sleep-deprived groups however exhibited a decline in neutrophils compared to ECIS only which is also consistent with previous studies [Citation12,Citation39] and hence result in likely compromise of innate immune mechanisms. Furthermore compared to ECIS only, IFN-γ, TNF-α, and IgG values (components of both the innate and adaptive immune mechanisms) were elevated in both sleep-deprived ECIS groups while IgM was reduced compared to ECIS, supporting an ongoing infection.
Mature leukocytes are reported to peak in the circulation during the resting phase (night for humans and day for rodents) and decrease during the active period [Citation40,Citation41]. This study used rodents (Wistar rats) which are largely nocturnal animals as an experimental model [Citation42]. The observed reductions in total WBC, neutrophil and eosinophil counts observed in group V compared to ECIS only may be due to the 12-hour extended active phase (darkness) of these animals. This might have been worsened by E. coli-induced systemic inflammation.
In addition to this, it has been reported that limited exposure to sunlight and or prolonged darkness reduces vitamin D levels, which may result in immunosuppression and activation of proinflammatory cytokines [Citation43,Citation44]. This may have also contributed to the decline in white cell and neutrophil counts as well as increased monocytes, immunoglobulin G levels, and spleen follicular lymphoid depletion observed in this 12-hour extended dark period group (group V). The immunoglobulin M, IFN-γ and TNF-α values respectively, did not however change when compared to both control and ECIS only suggesting that a complete compromise of the immune system was not present in this treatment group as at the time of sample collection. Interestingly, animals that had an extended period of darkness for 96 hours before systemic inflammatory challenge (group VI) exhibited reduced differential neutrophils and eosinophils, increased monocyte count, TNF-α and immunoglobulin G as well as reduced immunoglobulin M suggesting the likely presence of systemic inflammation and infection risk. However, total WBC and IFN-γ values observed in this 96-hour extended dark period group were comparable with controls. Melatonin, whose secretion increases during dark periods and is reported to enhance the innate and cellular immune system by stimulating the production of progenitor cells of granulocytes, agranulocytes and macrophages [Citation45], might play a role and be responsible for this observation.
Leukocytosis following extended dark periods in rodents has been reported and associated with cell movement from other lymphoid organs [Citation46]. It is therefore not unlikely that the WBC count in animals exposed to an extended dark period of 96 hours may have initially been suppressed as has been suggested to occur during the active phase (night for rodents) and following an extended dark period, WBC count increased as a result of mobilization from the lymphoid organ (lymphoid hyperplasia as seen in this study). Increased melatonin secretion arising from extended dark period exposure, may also have resulted in enhanced activation of innate and cellular immunity, and activation of anti-inflammatory processes. Following induction of ECIS, systemic inflammation may have then led to a decline in white cell count that perhaps may have continued if the septicemic duration had been extended beyond 7 days. However, melatonin and total WBC and other inflammatory indices values were not evaluated immediately after daylight restriction periods respectively, and thus represents a limitation in making these assumptions.
Lymphocytes, that helps the production of antibodies and direct cell-mediated killing of virus-infected and tumor cells [Citation47] were not different across groups, perhaps because, this study deals with bacterial and not viral infection [Citation48].
The report of this study with the low-dose ECIS-model of bacteria-induced systemic inflammation, after either sleep deprivation or daylight restriction, suggests that sleep deprivation, whether acute or chronic impairs the immune system such that its ability to recover from a systemic inflammatory challenge becomes compromised. Regular and adequate sleep has been reported to foster immune system activities through support to Th1 cell-mediated immunity and facilitating the mounting of an effective adaptive immune response to a microbial challenge [Citation15]. Therefore, in sleep deprivation (especially when prolonged) these mechanisms stated above would be reversed resulting in a diminished ability or breakdown of the host defense mechanism and an increase in inflammatory mechanisms.
The immune response from animals that were restricted from daylight and thereafter exposure to ECIS on the other hand, showed a response that suggests that the experimental animals may still recover from the systemic inflammatory challenge. Exposure to light has been described as being crucial to controlling circadian rhythms that regulate and influence human physiology. Immune functions, in particular, have been said to follow circadian oscillations that coincide with environmental light exposure (day and night), which allows the host immune system to anticipate and handle pathogenic threats more efficiently [Citation19,Citation25]. The precise timing of day and night cycles has been said to result in leucocyte entrainment that is directed at facilitating prompt response to pathogen attack [Citation11]. Studies have also shown that serum Vitamin D and melatonin levels, which are known to influence the potency of the immune system, free radical scavenging, anti-inflammatory, and antioxidant activities in the body, are affected by the duration of exposure to sunlight [Citation45,Citation49].
In conclusion, though alterations in environmental cues (day/night exposure periods) may trigger an immune response much faster than alterations in sleep duration and pattern [previously reported in Citation19], the response of the immune system in the presence of an inflammatory challenge is considerably much more weakened by sleep deprivation than by daylight restriction, as seen in this study. This perhaps may be due to a diminished ability or breakdown of host defense mechanisms and, an increase in inflammatory mechanisms in sleep deprivation while for daylight restriction, the actions of melatonin, which would be increased following prolonged exposure to darkness, could offer some protection through its activities to the host, while facilitating a re-entrainment of circadian rhythmic control of the immune and other systems in the host.
Disclosure statement
The authors have no relevant financial or non-financial interests to disclose.
Additional information
Funding
References
- Partch CL, Green CB, Takahashi JS. Molecular architecture of the mammalian circadian clock. Trends Cell Biol. 2014;24(2):90–99.
- McKenna HT, Reiss IK, Martin DS. The significance of circadian rhythms and dysrhythmias in critical illness. J Intensive Care Soc. 2017;18(2):121–129.
- Hastings M, O’Neill JS, Maywood ES. Circadian clocks: regulators of endocrine and metabolic rhythms. J Endocrinol. 2007;195(2):187–198.
- Potter GD, Skene DJ, Arendt J, et al. Circadian Rhythm and Sleep Disruption: causes, Metabolic Consequences, and Countermeasures. Endocr Rev. 2016;37(6):584–608.
- Brainard J, Gobel M, Scott B, et al. Health Implications of Disrupted Circadian Rhythms and the Potential for Daylight as Therapy. Anesthesiology. 2015;122:1170–1175.
- Zhu L, Zee PC. Circadian rhythm sleep disorders. Neurol Clin. 2012;30(4):1167–1191.
- Sridhar GR, Sanjana NS. Sleep, circadian dysrhythmia, obesity and diabetes. World J Diabetes. 2016;7(19):515–522.
- Vadnie CA, McClung CA. Circadian rhythm disturbances in mood disorders: insights into the role of the suprachiasmatic nucleus. Neural Plast. 2017;2017:1504507.
- Zhang ZQ, Ding JW, Wang XA, et al. Abnormal circadian rhythms are associated with plaque instability in acute coronary syndrome patients. Int J Clin Exp Pathol. 2019;12(10):3761–3771.
- Pick R, He W, Chen CS, et al. Time-of-Day-Dependent trafficking and function of leukocyte subsets. Trends Immunol. 2019;40(6):524–537.
- Comas M, Gordon CJ, Oliver BG, et al. A circadian based inflammatory response – implications for respiratory disease and treatment. Sleep Sci Pract. 1:18. 2017.
- Achie LN, Deekor B, Olorunshola KV. Sleep deprivation during night shift alters white blood cell indices. J. Dent. Med. Sci. 2015;14(2):12–15.
- Krueger JM, Frank MG, Wisor JP, et al. Sleep function: toward elucidating an enigma. Sleep Med Rev. 2016;28:46–54.
- Dimitrov S, Lange T, Tieken S, et al. Sleep associated regulation of T helper 1/T helper 2 cytokine balance in humans. Brain Behav Immun. 2004;18:341–348.
- Besedovsky L, Lange T, Born J. Sleep and immune function. Pflugers Arch. 2012;463(1):121–137.
- Fonken LK, Nelson RJ. The effects of light at night on circadian clocks and metabolism. Endoc Rev. 2014; 354: 648–670.
- Stenvers DJ, van Dorp R, Foppen E, et al. Dim light at night disturbs the daily sleep-wake cycle in the rat. Sci Rep. 2016;6:35662.
- Rüger M, Scheer FA. Effects of circadian disruption on the cardiometabolic system. Rev Endocr Metab Disord. 2009;10(4):245–260.
- Ige AO, Uzuegbu DC, Adebayo PO, et al. Comparative effect of daylight restriction and sleep deprivation on the immune and oxidative stress response of male swiss mice. Arch. Bas. App. Med. 2020;8:103–109.
- National Research Council. Guide for the care and use of laboratory animals. Washington DC: National Academy Press; 1996.
- Nunes JG, Tufik S. Validation of modified multiple platform methods (MPM) of paradoxical sleep deprivation in rats. In: Sleep research. Vol. 23. (Abstract); 1994. p. 419.
- Verweij WR, Bentala H, Huizinga-van der Vlag A, et al. Protection against an Escherichia coli-induced sepsis by alkaline phosphatase in mice. Shock. 2004;22(2):174–179.
- Evans JA, Davidson AJ. Health consequences of circadian disruption in humans and animal models. Prog Mol Biol Transl Sci. 2013;119:283–323.
- Everson CA, Toth LA. Systemic bacterial invasion induced by sleep deprivation. Am. J. Physiol. Regul. Integr. Comp. Physiol. 2000;278:R905–916.
- Ige AO, Adekanye OS, Adewoye EO. Intermittent exposure to green and white light-at-night activates hepatic glycogenolytic and gluconeogenetic activities in male Wistar rats. J Basic Clin Physiol Pharmacol. 2021;000010151520200251. 10.1515/jbcpp-2020-0251
- Mora-Rillo M, Fernández-Romero N, Navarro-San Francisco C, et al. Impact of virulence genes on sepsis severity and survival in Escherichia coli bacteremia. Virulence. 2015;6(1):93–100. Erratum in: Virulence. 2016;18;7(4):491.
- Owrangi B, Masters N, Kuballa A, et al. Invasion and translocation of uropathogenic Escherichia coli isolated from urosepsis and patients with community-acquired urinary tract infection. Eur J Clin Microbiol Infect Dis. 2018;37:833–839.
- Belok SH, Bosch NA, Klings ES, et al. Evaluation of leukopenia during sepsis as a marker of sepsis-defining organ dysfunction. PLoS One. 2021;16(6):e0252206.
- Abidi K, Khoudri I, Belayachi J, et al. Eosinopenia is a reliable marker of sepsis on admission to medical intensive care units. Crit Care. 2008;12(2):R59.
- Aird WC. The hematologic system as a marker of organ dysfunction in sepsis. Mayo Clin Proc. 2003;78(7):869–881.
- Serbina NV, Jia T, Hohl TM, et al. Monocyte-mediated defense against microbial pathogens. Annu Rev Immunol. 2008;26:421–452.
- Shen X, Cao K, Zhao Y, et al. Targeting neutrophils in sepsis: from mechanism to translation. Front Pharmacol. 2021;12:644270.
- Witter AR, Okunnu BM, Berg RE. The essential role of neutrophils during infection with the intracellular bacterial pathogen listeria monocytogenes. J. Immunol. (Baltimore, Md.:1950). 2016; 1975: 1557–1565
- Hemeda H, Jakob M, Ludwig AK, et al. Interferon-gamma and tumor necrosis factor-alpha differentially affect cytokine expression and migration properties of mesenchymal stem cells. Stem Cells Dev. 2010;19(5):693–706.
- Albuquerque A. Nodular lymphoid hyperplasia in the gastrointestinal tract in adult patients: a review. World J Gastrointest Endosc. 2014;6(11):534–540.
- Ligas JA, Kerepesi LA, Galioto AM, et al. Specificity and mechanism of immunoglobulin M (IgM)- and IgG-dependent protective immunity to larval Strongyloides stercoralis in mice. Infect Immun. 2003;71(12):6835–6843.
- Garbarino S, Lanteri P, Bragazzi NL, et al. Role of sleep deprivation in immune-related disease risk and outcomes. Commun Biol. 2021;4:1304.
- Friese RS, Bruns B, Sinton CM. Sleep deprivation after septic insult increases mortality independent of age. J Trauma. 2009;66:50–54.
- Said EA, Al-Abri MA, Al-Saidi I, et al. Sleep deprivation alters neutrophil functions and levels of Th1-related chemokines and CD4+ T cells in the blood. Sleep Breath. 2019;23(4):1331–1339.
- Dimitrov S, Benedict C, Heutling D, et al. Cortisol and epinephrine control opposing circadian rhythms in T cell subsets. Blood. 2009;113:5134–5143.
- Haus E, Smolensky MH. Biologic rhythms in the immune system. Chronobiol Int. 1999;16:581–622.
- Nunez AA, Yan L, Smale L. The cost of activity during the rest phase: animal models and theoretical perspectives. Front Endocrinol (Lausanne). 2018;7(9):72.
- Aranow C. Vitamin D and the immune system. J Investig Med. 2011;59(6):881–886.
- Palacios C, De-Regil LM, Lombardo LK, et al. Vitamin D supplementation during pregnancy: updated meta-analysis on maternal outcomes. J Steroid Biochem Mol Biol. 2016;164:148–155.
- Srinivasan V, Maestroni GJ, Cardinali DP, et al. Melatonin, immune function and aging. Immun Ageing. 2005;2:17.
- Moustafa A. Chronic exposure to continuous brightness or darkness modulates immune responses and ameliorates the antioxidant enzyme system in male rats. Front Vet Sci. 2021;8:621188.
- Larosa DF, Orange JS. 1. Lymphocytes. J Allergy Clin Immunol. 2008;121(2 Suppl):S364–9. quiz S412.
- Zhua Y, Caoa X, Taoa G, et al. Xub D The lymph index: a potential hematological parameter for viral infection. Int. J. of Infect. Dis. 2013; 177: e490–e493
- Hacışevki A, Baba B. An overview of melatonin as an antioxidant molecule: a biochemical approach. In:Drăgoi CM, Nicolae AC, editors. Melatonin - molecular biology, clinical and pharmaceutical approaches. intechopen [Internet]. London: IntechOpen; 2018 [cited 2022 Nov 30]. Available from: https://www.intechopen.com/chapters/62672 doi:10.5772/intechopen.79421