
 ?Mathematical formulae have been encoded as MathML and are displayed in this HTML version using MathJax in order to improve their display. Uncheck the box to turn MathJax off. This feature requires Javascript. Click on a formula to zoom.
ABSTRACT
We examined the cognitive processes underlying the comprehension of reduced word pronunciation variants in natives and advanced learners of French. In a passive listening visual world task, participants heard sentences containing either a reduced or a full form and saw pictures representing the target word, a phonological competitor and two neutral distractors. After each sentence they saw a picture and had to decide whether it matched the content of that sentence. Eye movements and EEG were recorded simultaneously. Because the two recordings offer complementary information about cognitive processes, we developed methods for analysing the signals in combination. We found a stronger effect of reduction on phonetic processing and semantic integration in learners than in natives, but the effects are different from the N100/N400 and P600 effects found in previous research. Time-locking EEG signals on fixation moments in the eye movements offers a window onto the time course of semantic integration.
1. Introduction
One of the most challenging aspects of using a foreign language is to understand everyday speech. Spoken words to which we are exposed in everyday life often lack sounds. For instance, the English word suppose can be realised as s'pose. This reduction phenomenon, whereby words are produced with fewer segments compared to their citation forms (from now on referred to as reduced and full forms, respectively), is highly frequent in Germanic languages, such as English (e.g. Johnson, Citation2004), Dutch (e.g. Ernestus, Citation2000) and German (e.g. Kohler, Citation1990), but also in non-Germanic languages such as French (e.g. Adda-Decker et al., Citation2005) and Finnish (Lennes et al., Citation2001). While native listeners generally understand reduced forms effortlessly, language learners often encounter problems understanding these forms (e.g. Nouveau, Citation2012; Stridfeldt, Citation2005; Wong et al., Citation2015). The first aim of this study is to obtain more insights into the cognitive processes that are involved in the comprehension of reduced speech in both natives and advanced learners. Differences in the processing of full and reduced forms in both learners and native listeners might elucidate which processes are affected most by reduction and may explain why learners suffer more from reduction than native listeners. Previous research has used EEG or eye tracking to investigate effects of several cognitive processes, such as phonetic decoding, lexical access and syntactic/semantic integration. The second aim of this paper is to investigate whether combining these two research techniques might allow us to discover effects on those processes that the individual recordings fail to bring to light.
Many theories of spoken word recognition assume the existence of some kind of mental lexicon that links phonetic representations of words with their syntactic and semantic features (see e.g. Cutler, Citation2012; ten Bosch et al., Citation2022 and the citations therein for more details). Theories agree that the activation of words' representations involves both bottom-up (acoustic-phonetic matching) and top-down (context-depending prediction). But when it comes to the specifics of the representations in the mental lexicon and the processes involved in bottom-up activation and top-down prediction there is much less agreement between competing theories. Also, there are many things that we do not really know and understand. One open question is how humans handle pronunciation variation associated with differences between speakers, speaking styles and context. One such question is whether (or to what extent) phonetic decoding of incoming speech is a prerequisite for accessing syntactic/semantic features, or whether syntactic/semantic expectations (context) facilitate phonetic decoding. With regards to reduced pronunciations the question is whether the mental lexicon comprises at least some sense of possible phonetic realizations of words, or whether there is some early process that takes care of normalisation so that all variants are mapped onto a single canonical variant.
While there are many open questions about L1 speech recognition, even less is known about the way people who acquire a second language, often in a schoolish, if not bookish manner, process and understand speech. What is certain is that the typical L2 learner only starts acquiring lexical representations and/or normalisation procedures at an age when these are already well established for the L1. Also, L2 learners are less likely to be confronted with the full range of pronunciation variations than L1 learners do. For example, Lahey and Ernestus (Citation2014) showed that infant-directed speech may contain reduced forms that miss complete syllables. The differences between real-life L1 and schoolish L2 acquisition are likely to result in weaker representations of low-frequency pronunciation variants as well as less effective procedures for phonemic normalisation. These differences may explain the problems that L2 learners experience in comprehending conversational speech. At the same time, those differences might also advance our understanding of L1 speech processing.
Previous behavioural research has shown that native listeners do not encounter great difficulties processing reduced forms in context, (e.g. Ernestus et al., Citation2002, Citation2017; van de Ven et al., Citation2011). At the same time it has been found that -even advanced- L2 listeners do experience difficulties with recognising reduced words (e.g. Brand & Ernestus, Citation2018; Ernestus et al., Citation2017; Mulder et al., Citation2015; Nouveau, Citation2012; Wong et al., Citation2015). In the present study we again use the differences between the processing of full and reduced forms in native listeners and language learners as a platform to investigate the interplay and time course of cognitive processes involved in speech comprehension. We combine EEG recordings and eye tracking techniques, because they provide different types of information about speech processing, and the data from one technique may help interpreting the data from the other.
Neuro-physiological techniques such as electroencephalography (EEG), which offer high time resolution, are commonly used to try and tear apart sub-processes related to acoustic-phonetic decoding, access to a lexicon and to the meaning of a word and syntactic and semantic integration. It has generally been found that more effortful processing corresponds to larger amplitudes in EEG signals. This holds for learners who process L2 utterances, but also for natives who process speech with a foreign accent, e.g. Song and Iverson (Citation2018). It also holds for natives who suffer from hearing impairment or who listen to speech signals that have been processed to reduce intelligibility, e.g. Erb and Obleser (Citation2013).
ERP components such as the well-studied N100, N400 and P600 have been put forward as reflecting acoustic-phonetic, lexical, and syntactic/semantic processing, respectively. The N100 has been proposed as a marker of sensory driven acoustic processing. Enhanced N100 amplitudes have been observed in the processing of degraded speech (Miettinen et al., Citation2010), signalling more effortful signal-dependent processing in order to encode the speech signal. In addition, the N100 has been put forward as an index of speech segmentation (Sanders et al., Citation2002). Sanders and Neville (Citation2003a, Citation2003b) observed larger N100 for word-initial than for word-medial syllables in natives but not in non-natives, suggesting that the non-native listeners had difficulties in segmenting the speech signal.
The magnitude, its onset and peak latency of the N400 amplitude has been shown to vary depending on different factors such as whether the stimulus is presented auditorily or visually, its frequency of occurrence, semantic category and cognitive influences (see Moreno et al., Citation2008 for an overview). With respect to differences in L1-L2 processing, studies have reported delayed and/or longer lasting N400 effects in L2 learners compared to L1 participants (e.g. Ardal et al., Citation1990; Hahne, Citation2001; Hahne & Friederici, Citation2001; Moreno & Kutas, Citation2005; Proverbio et al., Citation2002; Weber-Fox & Neville, Citation1996), suggesting more processing effort for L2 learners.
The P600 is commonly found in sentences that trigger syntactic violations, but is also assumed to reflect more general syntactic processing effort without violations and to index grammatical complexity (e.g. Moreno et al., Citation2008). Findings on P600 effects are mixed. Weber-Fox and Neville (Citation1996) observed smaller P600 amplitudes for bilinguals than for monolinguals. However, Hahne (Citation2001) observed larger P600 amplitudes for bilinguals than for monolinguals, whereas other studies failed to find P600 effects (e.g. Kotz et al., Citation2008) or only observed a difference in latency (e.g. Hahne & Friederici, Citation2001). According to Hahne (Hahne & Friederici, Citation2001, see review Moreno et al., Citation2008), ERP responses can vary depending on proficiency level in the L2 and the P600 as a result of late syntactic processes that seem to come into play with increasing proficiency.
Specific ERP effects of listening to reduced speech, the topic of the present study, are scarce, especially regarding the differences between L1 and L2 listeners. Drijvers et al. (Citation2016), who only investigated L1 speech processing, showed that native Dutch listeners processed utterances with sentence-medial reduced forms differently than utterances with the full equivalents. Mulder et al. (Citation2022) only tested L2 listeners and observed an N400 effect of reduction on cognate processing in Dutch L2 learners of English.
However, it must be pointed out that the relation between cognitive processes and EEG signals is far from straightforward. After hundreds of experiments and papers there is still substantial uncertainty about the links between features of EEG signals and cognitive processes (e.g. Kutas & Federmeier, Citation2011; Morgan-Short & Tanner, Citation2013) for the use of EEG analysis in studies on L2 processing. Assumptions about underlying cognitive processes may differ between psycholinguistic theories, and actual cognitive processing effort may depend on fluctuating attention and different strategies that participants use in individual trials. To illustrate, models of bilingual word recognition conceptualise the organisation and interaction of a bilingual's languages and the access to these items in different ways, by assuming either an integrated or separate storage of lexical representations (see Shook & Marian, Citation2013 for a discussion).
Eye tracking is often considered as a window into the mind (e.g. Just & Carpenter, Citation1980; van Gompel et al., Citation2007). Dahan et al. (Citation2007) have put forward three hypotheses about the relation between eye movements and the processing of words spoken in isolation. One interpretation is that fixations are used to help understand the spoken input. Listeners can then fixate a picture to try to match its activated representation with the speech input. A second hypothesis holds that fixations reflect the decoding of the spoken input. Finally, the third hypothesis, a fixation may reflect that a spoken word has been understood. In that case, the fixation serves merely as a confirmation of the result of the processing.
In their critical review of the visual world paradigm for the study of language processing Huettig and colleagues (Huettig et al., Citation2011) emphasise that the link between eye movements and underlying cognitive processes is indirect, even if it is strong and systematic. Moreover, that link will depend on the instruction given to the participants in an experiment. They speculate that if no specific instructions are given, participants try to create a mental representation that meaningfully links speech and visual information, most probably supported by “working memory” representations of the visual and speech information (also see Altmann & Kamide, Citation2007; Huettig et al., Citation2011). Importantly, their review found evidence for the activation of phonological representations of the names of the objects displayed on the screen, provided that the visual information is available well before the start of the corresponding word in the auditory input. Teruya and Kapatsinski (Citation2019) proposed a theory that claims that fixating a picture corresponding to a word is a decision, made when the word's activation exceeds a context-specific threshold and that subthreshold activations cannot drive saccades. However, it is questionable whether this holds in a passive listening task where eye movements may be initiated for several, unknown, goals.
A websiteFootnote1 published by SR-Research Ltd. collects papers describing research that used eye tracking published since 1997. A large majority of papers that report eye tracking measures in research on L1-L2 differences focus on syntax. Also, most of the papers that address phonetic/phonological processing use procedures that ask participants to click on one of the pictures on the screen. The most notable exception is Ito et al. (Citation2018), who asked whether L1/L2 phonological interference would affect the processing of highly predictable nouns in mid-sentence position of Japanese listeners. Although somewhat related to the study by Ito et al. (Citation2018) our differs in several aspects from Ito et al. (Citation2018), one difference being that in our experiment the target words are not predictable from the preceding context.
1.1. This study
In this paper, we use simultaneous recordings of eye movements and EEG to investigate differences in the processing of full and reduced nouns between native French listeners and advanced Dutch learners of French. We presented the full and reduced target words in mid-sentence position in a passive listening task, which better reflects situations in daily life than, for instance, the lexical decision task used by van de Ven and colleagues (van de Ven et al., Citation2011). The literature on L2 speech processing consistently reports a disadvantage in the processing in reduced forms in learners compared to natives (Ernestus et al., Citation2017; Nouveau, Citation2012; Wong et al., Citation2015), but the cause(s) of this disadvantage remain(s) unclear. A detailed analysis of differences between the processing of full and reduced forms between natives and learners that can be observed in recordings of eye movements and EEG signals might improve our understanding of which cognitive processes involved in speech understanding take most of the blame.
In our design participants were shown four line drawings of familiar objects on a computer screen, one of which corresponded to the mid-sentence target word that could be full or reduced. The four pictures appeared on the screen one second before the start of the spoken sentences, and remained there until sentence offset. Therefore, participants were in the position to activate representations (phonological, semantic,…) of the four objects well before the moment the object was named. However, the participants were not told how to use the visual information. Because they needed to understand complete sentences, they could not reduce the active lexicon to the names of the four objects on the screen. But they were able to raise the resting activations of the words corresponding to the pictures. Perhaps, learners might benefit more from what could be considered as visual priming than the natives.
The fundamental uncertainty about the relation between EEG signals and eye movements on the one hand and cognitive processes on the other alluded to above, in combination with the extra uncertainties introduced by the passive listening task will obviously complicate the processing and interpretation of the recordings. Therefore, we aim to investigate whether clever analysis of simultaneously recorded of EEG and eye movements can overcome at least some of the uncertainties.
Therefore, in this study we take an exploratory approach to shed more light on what could underlie the processing of reduced forms. Despite uncertainties about detailed relations between EEG signals and specific cognitive processes it is generally agreed that more cognitive effort corresponds to larger EEG amplitudes. Problems related to acoustic-phonetic decoding processing and to activating the appropriate lexical-semantic representation would both add to the processing time. In the EEG signal this could be represented by effects on the N100-P200 and the N400 and P600, respectively, but there might also be other effects in the amplitude of EEG and ERP signals.
Assuming that the results of the experiments conducted by e.g. Dahan et al. (Citation2007) can be generalised to the design of our experiment, the proportion of fixations on the target picture is expected to increase as the decoding of the speech input progresses compared to the proportions fixations on the competitor and neutral pictures. However, because participants may use the visual information differently or for different purposes, the effects of the visual information might be less straightforward. Taking a cue from the claim in Huettig et al. (Citation2011) about the integration of visual and speech information in working memory, we will investigate whether time-locking EEG analysis on the moment when fixations of a picture start (instead of time-locking on the start of the target word) can uncover information that facilitates the linking of eye movements and EEG signals to cognitive processes.
2. Method
To be able to combine EEG and eye tracking measurements in a setting in which participants listened to meaningful sentences, we adapted several concepts from experiments using a visual world design. Before the start of each spoken sentence participants were shown four line drawings of objects, one of which corresponded to the target word in that sentence. To be able to focus on phonetic decoding of the target words, another concept from many visual world experiments was adopted: one of the three competing pictures showed an object whose name starts with the same sound as the target word. To account for the possibility that participants needed more context to be able to recognise the reduced or full target word, the sentences ended with a word that was semantically related with the target word. After the end of each sentence a photo of a scene was displayed, and participants had to decide whether or not that scene reflected the contents of the sentence.
2.1. Participants
Thirty-eight right-handed native speakers of French, mostly undergraduate students, (mean age 22.8 years, standard deviation ; 7 males) participated in the experiment. They were all raised in the northern region of France (around Ile de France) by native speakers of French. The data of ten participants were discarded due to technical problems, which leaves us with 28 participants to analyse. Thirty-eight right-handed Dutch students of French (mean age 20.8 years,
; 3 males) also participated in the experiment. From these participants eleven had to be excluded from analysis, leaving us with 27 useful Dutch participants.Footnote2 They had all learned French in high school for six years and continued upgrading their proficiency level at university, where they were exposed daily to (formal) French. All learners were either in the final year of their bachelor program or in their masters program of French. Based on this amount of instruction in French, their proficiency level should roughly correspond to B2/C1 according to the Common European Framework of Reference for Languages (Council of Europe, Citation2011). The self-reported age of acquisition of the participants was 12 years old (
) and their mean self-rated speaking proficiency was 5.41 out of 7 (
).
All learners performed the LexTale Task (Brysbaert, Citation2013; Lemhöfer & Broersma, Citation2012), a visual lexical decision experiment that provides a measure of general lexical proficiency. This standardised task assesses the vocabulary knowledge of medium to highly proficient speakers of French as a second language. The task contains 60 trials and takes about four minutes to complete. We found a raw mean GhentScore of 7.64 for the participants on the LexTALE task, which corresponds to a percentile of about 56.5 for learners of French at universities in Belgium, where French is one of the official languages. Based on the learners' educational background, their LexTale scores, and their answers in a language background questionnaire, we characterised them as advanced learners.
All participants had normal hearing ability, no language disability or psychological or neurological impairments, and had normal or corrected-to-normal vision. The study was approved by the local ethics committee, and written consent was obtained prior to participation. Participants were paid to take part in the experiment.
Like French natives, Dutch learners are familiar with the concept of schwa reduction from their native language (e.g. Drijvers et al., Citation2016; Hanique et al., Citation2010). The Dutch word gekocht “bought”, for example, has the citation form /ϰəkɔϰt/, but the word-initial schwa may be very short, and occasionally absent, as in /ϰkɔϰt/.
2.2. Auditory stimuli
We selected 54 French bisyllabic nouns with a schwa in the first syllable and stress on the second syllable (e.g. requin /rəkε˜/ “shark”). The schwa in those words is especially often absent in casual speech, but it can also be absent if the words are produced in isolation and in a formal situation (e.g. Bürki et al., Citation2010). This makes it even more likely that all participants are familiar with this reduction phenomenon. The absence of schwa is often complete, leaving no traces in the acoustic signal (e.g. Bürki et al., Citation2007). In order not to draw participants' attention to the experimental target words, we added 58 filler nouns: one four-syllable word (aéroport “airport”), 11 three-syllable words (e.g. boulanger “baker”), 31 two-syllable words (e.g. coiffeur “hairdresser”) and 16 one-syllable words (e.g. pont “bridge”). Finally, we selected three nouns (one bisyllabic noun and two three-syllable nouns) for the practice trials.
For the target words, the frequency counts lemFreqFilm in the Lexique database (New et al., Citation2004) vary between 0.1 and 739.12 (mean = 50.14, ). For the filler words, the frequency counts lemFreqFilm vary between 0.06 and 255.28 (mean = 25.41,
). The first percentile of all forms in lemFreqFilm is 0; the 99th percentile is 728.67; the average frequency count is 55.1. Thus, some of the target nouns belong to the top most frequent words in French; another part can be characterised as low-frequency words. The average count of the target words is very close to the overall average in Lexique. Although the frequency of the target words span a large range, the words were not selected for their frequency. Therefore, we decided to use frequency as a control variable, but not to discuss it as a factor in its own right.
All words were concrete nouns that could be depicted in line drawings. All target words were embedded in a sentence, in mid-sentence position. The sentences were structured as follows: subject + verb form (+ que “that”) + target / filler noun (+ verb form) + prepositional phrase / noun (e.g. J'ai appris que le requin vit dans l'océan “I have learned that the shark lives in the ocean”). To avoid predictability effects, we kept the semantic context as neutral as possible up until the first noun. In contrast, the noun in the prepositional phrase was always semantically related to the preceding experimental target or filler noun. Note that this sentences structure prevents the emergence of a higher anticipatory activation (Altmann & Kamide, Citation2007) of the target picture (and its mental representations) than of the three competing pictures. The sentences containing the target nouns are listed in Appendix A.
The sentences were recorded by a female native speaker of French from the north of France. The target sentences were recorded with three different instructions: 1. with no specific on how to produce the noun (i.e., spontaneous production); 2. to produce the noun with its full realisation; and 3. to produce the noun without the schwa in the first syllable. The reduced and full nouns and their preceding article were then spliced from their original sentences and pasted into the sentences recorded without giving the speaker any instructions. This was done to ensure that the sentences with reduced and full target nouns only differed with respect to the realisation of the schwa in the noun, and that possible effects in EEG and eye-tracking could not be attributed to a difference in the context. The sentences' average intensities were scaled to the same level in PRAAT (Boersma & Weenink, Citation2019). The average durations of the sentences containing the full and reduced target were 2560 ms () and 2471 ms (
), respectively.
We analysed the target nouns using the speech analysis software package PRAAT. The spliced reduced forms had a mean schwa duration of 5.3 ms, whereas the spliced full forms had a mean schwa duration of 69.0 ms. The mean durations of the entire target words were 370.5 ms () for the reduced forms and 460.4 ms (
) for the full forms. The target words occurred, on average, 832 ms after sentence onset (
).
For the visual world paradigm, the 54 target nouns, the 58 filler nouns, and the three practice trial nouns (i.e. the 115 experimental words) were each paired with three distractor nouns, such that 115 quadruplets were created. We ensured that all distractors were semantically unrelated to the experimental words and to each other. In addition, we made sure that all words of a quadruplet had the same grammatical gender. The three distractors for a target noun included a phonological distractor and two neutral distractors. The onset of the phonological distractor (e.g. fourchette /furʃεt/ “fork”) overlapped with that of the target noun (e.g. fenêtre /fənεtr/ “window”). The amount of onset overlap with the phonological competitor was equally large for the full and reduced forms of the target (only the first segment). The neutral distractors did not overlap in onset phonemes (e.g. cocinnelle /kɔksɪnεl/ “ladybird” and montre /mɔ̃tr/ “watch” for fenêtre /fənεtr/).
In order to prevent listeners from only considering pictures of the objects that showed overlap in their onsets, we created different distractor combinations for the filler nouns. We presented 38 filler target words together with three neutral distractors of which two shared their onset phonemes (e.g. /trɔ̃pεt/ trompette, /tɔmat/ tomate, and /muʃ/ mouche for the filler /dɑ̃/ dent), and 20 filler targets word with three distractors whose onsets showed no phonological overlap (e.g. /priz/ prise, /tɑ̃t/ tente and /salad/ salade for the filler noun /balεn/ baleine).
2.3. Visual stimuli
For every experimental word and for each of its distractor nouns, the participants saw a picture on the screen. The coloured line drawings for 264 of our 460 pictures were taken from Rossion and Pourtois (Citation2004), which were based on the original 260 black-and-white pictures produced by Snodgrass and Vanderwart (Citation1980) and are freely available. We chose to use these coloured versions because some of the original black-and-white drawings were of poor quality, and because Rossion and Pourtois have shown that basic-level object recognition is facilitated by the presence of colour information. Nine of the objects depicted by Rossion and Pourtois were duplicated, so the resulting pictures represented plural nouns. For the 218 words for which no pictures were available in the Rossion and Pourtois (Citation2004) set, new drawings were created by a semi-professional graphics artist. Like the pictures of Rossion and Pourtois, these pictures were digitised at a high spatial resolution (600 dpi), resized, cropped, reduced to a resolution of 72 dpi (screen resolution), and centred on a rectangle of 281 by 197 pixels. Coloring and texture processing were mainly carried out with the graphic tools (e.g. pen, paintbrush) available in Photoshop CS6. Fifteen of the objects depicted by the semi-professional graphics artist were duplicated to represent plural nouns.
To test the entire picture set for clarity, eight native speakers of Dutch were asked to participate in a self-paced naming task. Each participant saw a random combination of half of the pictures, and typed their names in French. If participants did not know the object depicted by an image, they were asked to type pas clair “unclear”. The grand mean accuracy score was 87.17% (SD: , range: 79.05–93.28%), while the average accuracy score per item was 87.13% (SD: 23.42%, range 0–100%). Ten pictures that were never named correctly were replaced by new pictures that were correctly named by all participants. The final set consisted of 460 pictures. The results of the naming task implies that if participants created a mental representation of the sets of pictures shown on the screen during the presentation of the stimuli, the phonological representations of the names of the objects shown in the pictures most likely corresponded to the actual words used in the stimulus sentences.
Finally, for each of the 115 trials (112 experimental trials and three practice trials), we selected a photo that did or did not depict the situation described by the auditorily presented sentence. A matching sentence-photo pair is, for instance, the sentence L'enfant a posé la cerise au sommet du gâteau (“The child has put the cherry on top of the cake”) followed by a photo of a cherry on top of a cake. A non-matching sentence-photo pair is the sentence Elle a pris la tenaille pour enlever le clou (“She has taken the pincers to pull out the nail”), followed by a picture of someone holding a hammer above a nail. We varied the non-matching elements in the non-matching condition with the purpose not to attract attention to the target of the sentence (i.e. by changing the scenery instead of the object). We took 55 photos with a Canon EOS 450 D camera. In addition, 60 right-free photos were selected from the internet. All photos were resized to pixels and had a resolution of 72 dpi.
2.4. Lists
Every participant heard and saw stimuli from one experimental list. We first created 30 lists on the basis of the materials. The two versions of each noun (i.e. one full and one reduced form) were counterbalanced across lists in such a way that each participant heard only one version of the noun. Each of the 30 lists contained a different random combination of 27 reduced nouns and 27 full nouns. In addition, we created 30 complementary lists by replacing the reduced and full forms of the target words in every list by the corresponding full and reduced forms, respectively. The fillers were the same in all lists and all lists started with the same practice trials. For each participant, the order of the trials in the list was pseudo-randomised in such a way that no more than three target trials occurred in a row. Each list was divided in two blocks of equal size.
The positions of target, phonological competitor, and distractor pictures within a visual display were counterbalanced so that each positional combination was represented equally often in the total trial set. In addition, the positional combinations within a trial were randomised per participant to avoid that for a given trial the target always occurred in one position. presents an example of a visual display.
Figure 1. Example of a visual display containing a target, phonological competitor and two neutral distractors. In this display, the target word is fenêtre “window”, the phonological competitor is fourchette “fork” and the neutral distractors are coccinelle “ladybird” and montre “watch”.

2.5. Procedure
The French natives were tested individually in a sound-attenuated cabin in the Laboratoire Charles Bruneau of the Institut de Linguistique et Phonétique Générales et Appliquées (ILPGA) in Paris. The Dutch participants were tested individually in sound-attenuated booths either at the Max Planck Institute for Psycholinguistics in Nijmegen, at Leiden University, at Utrecht University, or at the University of Amsterdam. Three out of the five labs were dedicated EEG labs. The set up and placement of the eye-tracker, EEG system, and testing computer were kept the same as much as possible in all locations. To avoid any differences between participants due to different technical sources, we brought our own equipment to all labs. We ensured that the participants were seated at approximately 60 cm distance from a cm LCD computer screen. They wore the same elastic caps for measuring EEG, and the same Sennheiser HD215 headphones.
Eye movements were recorded at a sample rate of 500 Hz with an SR Research Ltd. Eyelink 1000 eye tracker. Data points from the eye tracker were coded as fixations, saccades, or blinks using the Eyelink algorithm. Fixations were assumed to have a minimum duration of 100 ms (e.g. Manor & Gordon, Citation2003). The timing of a fixation was established relative to the onset of the target word in the spoken sentence. Gaze position was categorised by object quadrant. Fixations were coded as directed to the experimental target object, to the phonological competitor, or to the neutral distractors.
Participants wore an elastic cap (Acticap) with 64 active electrodes to measure EEG. Electrode positions were a subset of the international 10-20 system, consisting of eight midline electrodes and 50 lateral electrodes. Moreover, we placed an electrode on each of the mastoids and each electrode was referenced online to the left mastoid. The electro-oculogram (EOG) was recorded by two vertical electrodes placed above and below the right eye and by two horizontal electrodes with a right to left canthal montage. We kept the electrode impedance below 15 kΩ. The EEG and EOG signals were amplified (band pass = 0.02–100 Hz), and digitised online with a sampling frequency of 500 Hz. Before data analysis, the signal was re-referenced to the average of the left and right mastoids and digitally filtered with a low pass filter with cut-off frequency 30 Hz. Stimulus markers were sent to the EEG and eye tracker systems via Presentation version 16.5 (www.neurobs.com). To ensure temporal synchronisation of the simultaneously recorded EEG and eye data within Presentation, an eye-tracking extension was developed in-house especially for this purpose.
The participants were asked to listen carefully to the spoken sentences they heard, and not to take their eyes off the screen (e.g. Huettig & Altmann, Citation2005). Before each trial, a fixation cross was presented at the centre of the screen for 500 ms, to which the participants were asked to fixate. Each trial started with a one second preview of the pictures for the experimental word and for the three distractors (see ), followed by the spoken sentence presented binaurally over the Sennheiser HD215 headphones. The visual display remained on the screen until the end of the sentence. Then, a blank white screen was presented for 500 ms. Finally, a photo was displayed that showed a scene that corresponded to the contents of the sentence in half of the stimuli. Participants pressed a yes-button or a no-button to determine whether the scene depicted by the image matched the scene described in the auditory sentence. The trial ended with a 500 ms empty white screen. Eye movements and EEG were recorded simultaneously throughout the experiment. The experiment lasted approximately 17 min.
3. Fixations as an index of lexical competition
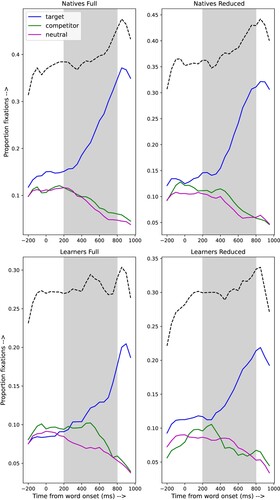
The mean accuracy score on the sentence-photo matching task was 86.0% (SD: 0.35) for the French natives and 82.0% (SD: 0.38) for the advanced Dutch learners. We computed the average proportions of fixations to the four pictures (target, phonological competitor, two neutral distractors) for time bins of 10 ms. Note that all experimental trials were considered in the calculations of these proportions, regardless of whether they were responded to accurately in the sentence-photo matching task. Importantly, this task that occurs at the end of the trial will not influence the processing of the auditory sentence and four pictures, as the decision comes long after the sentence and pictures. Actually, the main goal of the decision task was to stimulate the participants to listen carefully and try to understand the sentences.
The fixation proportions can be defined in different ways. One definition is the quotient of the number of fixations to one of the three picture types in a given time bin and the number of trials in which there was a fixation in that bin. Another definition is the quotient of the number of fixations to a specific picture type in a bin and the total number of trials. We prefer the second definition for two reasons. First, and most important, the quotient of the number of fixations and the total number of trials shows the proportion of trials in which there was indeed a fixation. In addition, the second definition yields smoother curves for the target and competitor, because it is not affected by changes in the number of fixations to the neutral pictures in which we are not interested. The proportions of fixations for the two neutral distractors were averaged.
The results are shown in . The top row shows the results for the natives, the bottom row for the learners. The left-hand column shows the results for the full and the right-hand column for the reduced stimuli. The y-axis represents the proportion of fixations ( ms); the x-axis represents the time from target word onset. The grey box marks the analysis window (200–800 ms post target word onset). This time window was chosen to capture any effects of lexical competition that could arise during the acoustic analysis and lexical-semantic activation of the target word. The dashed black lines represent the sum of the fixation proportions to any picture. It can be seen that fewer than half of the trials obtained an explicit fixation on one of the pictures. Note that, similar to Huettig and McQueen (Citation2007), we did not ask the participants to perform an explicit task, which may explain why the total number of explicit fixations is small. Given the 200 ms generally assumed necessary for programming and initiating an eye movement (e.g. Allopenna et al., Citation1998; Altmann & Kamide, Citation2004; Dahan, Magnuson, Tanenhaus, & Hogan, Citation2001; Matin et al., Citation1993), it is not surprising that only 200 ms after target word onset, the curves representing the targets start to rise steeply.
Figure 2. Natives' (upper panel) and learners' (lower panel) proportions of fixations to the different lexical candidates for the sentences with full forms (left panel) and reduced forms (right panel). The dashed black lines show the total proportions fixations in each bin.
We used growth curve analysis (GCA) (Mirman, Citation2014) to analyse the proportion of the fixations to the different lexical candidates in the combined data set of natives and learners. This multilevel regression technique uses orthogonal polynomials to capture changes in fixation patterns over time. Orthogonal polynomials are transformations of natural polynomials that make the individual time (e.g. linear, quadratic, cubic, etc.) terms independent. This allows for a more precise evaluation of differences in dynamics of processing (see Mirman & Magnuson, Citation2009).
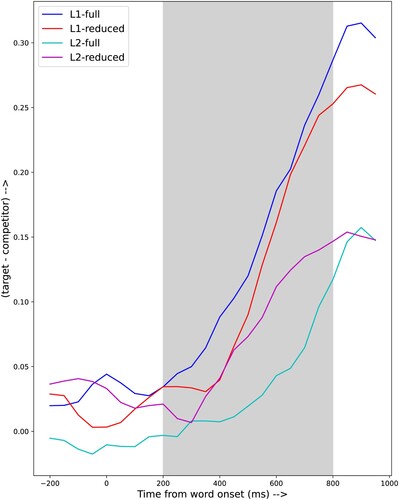
To assess whether participants suffer more from lexical competition from the phonological competitor (the most important competitor) when listening to reduced forms compared to full forms, we computed the difference between the proportion of fixation to the target and the proportion of fixations to the phonological competitor (e.g. Thothathiri & Snedeker, Citation2008). shows the raw difference scores for the full and reduced target words for the native listeners and learners. Note that a small difference score reflects a large amount of competition and a big difference score indicates that, proportionally, there are more looks to the target than to the competitor.
Figure 3. Differences between fixation proportions on the target and fixation proportions on the phonological competitor.
Importantly, Mirman et al. (Citation2008) emphasise that GCA is a model of the observational data obtained in an experiment, and not a model of the cognitive processes that generated those observations. Still, it may be possible to suggest links between the results of a GCA and cognitive processes. In their paper Mirman et al. suggest links between proportions fixations and polynomials; in our GCA we need to link differences in proportions fixations to the polynomials. The difference scores were analysed with up to fourth order polynomials and fixed effects of group (natives or learners) and reduction (reduced or full form). As could be expected from the fairly smooth curves in , higher order polynomials did not improve the model fit very much. All analyses were carried out in R version 4.1.2 using the lme4 package (built under R version 4.1.3).
shows the fixed effect parameter estimates and their standard errors along with p-values. The lack of significance of the intercept reflects the fact that all difference curves start around zero, as should be expected, given the absence of a preference for any picture before the start of the target word. The predictor poly1 models the almost linear increase of the difference scores as function of time that starts between 200 and 400 ms after the onset of the target word. The highly significant interaction poly1:group models the fact the difference score increases much more rapidly for the natives. This reflects the fact that the phonological competitor had (almost) no effect on the native listeners. The significant interaction poly1:reduction shows that the reduction status of the target words does affect the speed with which the competitor looses out against the target. The predictor poly2 models the curvilinear component of the curves, probably most importantly the times at which the curves start to rise, i.e. the point in time when the target starts to gain advantage over the competitor. The marginally significant interaction poly2:group suggests that this time point differs between natives and learners. Intriguingly, the interaction poly2:reduction is not significant, despite the fact that the times at which the difference curves start to rise differ between the full and reduced stimuli. For the natives the rise for the reduced words comes at a delay of 200 ms, while this rise is about 100 ms earlier for the learners. Most probably part of these differences is already accounted for by poly1, which as a much larger effect size. Further, the model shows that both main factors of group and reduction are highly significant, and that the interaction group:reduction is also highly significant. This reflects the fact that for the natives the difference scores for the full and reduced stimuli are close from 400 ms after the start of the target word; the scores for the learners differ substantially, and they are higher for the reduced than for the full stimuli.
Table 1. Fixed effects from the growth curve analysis.
There is no agreement in the field about the preferred dependent variable in Growth Curve analysis. Some, (e.g. Cohen et al., Citation2023; Thothathiri & Snedeker, Citation2008) prefer the difference between target and competitor, while others (e.g. Teruya & Kapatsinski, Citation2019) prefer the difference in proportions of fixations of competitor and neutral pictures. Appendix B shows the results of a Growth Curve Analysis of the difference between competitor and neutral pictures, which essentially confirms the conclusions of the analysis of the difference between target and competitor.
3.1. A closer look at the eye movements
The distance to the screen was such that the four pictures could be identified without the need for fixations. Therefore, fixations only provide a part of the potentially relevant information about eye movements. To more fully characterise the eye movements we defined five additional features that are easy to compute from the eye movement tracks. These features combine information about fixations with information about saccades: (1) the total distance travelled by the eyes in the time interval, (2) the number of saccades in a given time interval, (3) the number of pictures fixated in the time interval, (4) the total time the eyes are in the Region of Interest (RoI) of any picture during that time interval, (5) the area of the screen covered by the eyes in a time interval, defined as the area of the ellipse with radii equal to the standard deviation of the X- and Y-coordinates. We computed the value of the eye feature for each trial in two one-second time intervals: the preview period, and a time interval starting 250 ms before the onset of the target word. The results are summarised in .
Table 2. Average values of the individual eye features during the preview and target windows.
We used t-tests for independent samples to compare the feature values for the natives and learners in both intervals. From it can be seen that learners and natives had the same number of saccades during the preview interval. However, in the time window that covers the target word the number of saccades is higher for natives. The total time spent by the eyes in some RoI does not differ between the groups in the target window. It can also be seen that the learners fixated fewer pictures than the natives in both time windows. Perhaps most revealing is the combination of the features Distance and Fixation Area. The eyes of the learners travelled over a much larger distance, but in a smaller area (i.e. around the centre of the screen) than the natives. This gives the impression that the learners frantically searched for visual information, whereas the natives used the visual information much more targeted.
3.2. Discussion
Although substantial caution is needed in interpreting the result from a non-random subset of the data, i.e. only the trials that contained an explicit fixation on one of the pictures, it is still safe to conclude that the native listeners use the visual information differently than the learners. The dotted lines in show that the proportions of trials that do have a fixation in any 10 ms bin are larger for the natives than for the learners. However, it is quite possible that because of the 1000 ms preview of the picture display, participants in both groups did activate phonological representations of the names of the four objects on the screen, and that these representations did play a role in processing the sentences, also in the trials that lacked a fixation.
For the native listeners there is no indication of an effect of the phonological competitor in the full stimuli. However, there is some indication of that effect in the reduced stimuli for the native listeners: the rise in the difference between the proportions of fixations to the target and the competitor only starts about 400 ms after the onset of the target word, while that rise appears to start already 200 ms after target word onset in the full stimuli. Although it could be argued that this is in line with the findings of e.g. Brouwer et al. (Citation2012), this finding is still surprising. In the debriefings after the end of the experiment none of the native listeners mentioned the presence of reduced pronunciation variants. For the learners, visual inspection of the curves in seems to show that the phonological competitors of reduced stimuli are considered for a longer period than for full stimuli. This suggests that, for learners more so than for native listeners, reduced stimulus words are more difficult to process than full stimuli. Interestingly, the phonological competitor is still being considered long after word offset, raising the question whether this fixation pattern actually reflects phonetic decoding of the speech signal or rather later processes related to lexical selection.
The difference scores shown in do not allow a straightforward interpretation with respect to the effects of the competition between target and phonological competitor on phonetic decoding and/or lexical-semantic activation. Firstly, the difference between the proportions of fixations to target and phonological competitor remain for the full and reduced forms, both for the natives and the learners, up to almost 400 ms after the onset of the target word. Since the average duration of the reduced target words is 370.5 ms, this means that there is no difference between target and competitor before the end of the word. If the difference between the proportion of fixations is indicative of word comprehension, it can be argued that the native listeners understand the full forms somewhat faster than the reduced counterparts, but about 500 ms after the onset of the word the difference between processing full and reduced forms has disappeared. For the learners the preference for the “correct” picture over the one corresponding to the phonological competitor never exceeds 0.15, and the preference for the target is larger for the reduced than for the full forms. This might imply that the proportions of fixations indicate that the learners -be it only occasionally- use the pictures to help them understand the reduced word, rather than indicate that the word has been understood. The fact that the difference scores for both stimulus types and both groups become equal at about 850 ms after the start of the target words and then start to decline might mean that the processing of the target word is complete at that point in time and that the visual information is not relevant for understanding the words that immediately follow the target word.
In conclusion, differences in fixations of target and phonological competitor indicate that there were differences between natives and learners, as well as between full and reduced stimuli. For the native listeners reduction seems to affect phonetic decoding; in the learners reduction mainly affects lexical-semantic access or integration. However, more than half of the trials do not have a fixation in the time interval analysed. This raises the question whether there are differences between trials with and without a fixation. Moreover, the data in suggest that the natives scan the visual display in a strategic manner, while the learners appear to search the display in the form of a random walk. This raises the question whether cognitive processes associated with fixations differ between the groups.
4. EEG analysis with time-lock on target word onset
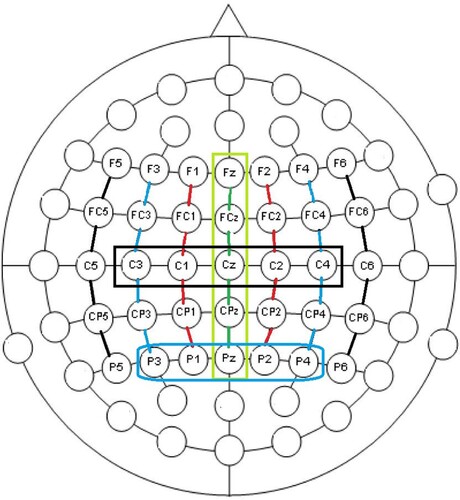
We analysed the EEG recordings with the aim to determine whether there is an effect of reduction in the processing of the target words, and if so, whether this effect is different for the natives and the learners. We limited the set of EEG channels under analysis to the 35 channels that are minimally affected by eye movements. The locations of these channels on the scalp are shown in .
Figure 4. The 35 EEG channels used in the analyses, and the three sets of five sensors analysed.
4.1. Method
We used the FieldTrip procedure ft_preprocessing (Oostenveld et al., Citation2011) to downtrend, low pass filter (with cut-off frequency 35 Hz) and segment the continuous EEG signals into epochs with a duration of five seconds, starting 240 ms before sentence onset. The epochs were downsampled to 100 Hz before further analysis. Next, we used the runica procedure ft_componentanalysis to remove the most obvious artifacts (Makeig et al., Citation1996). This interactive cleaning was followed by further automatic cleaning of the EEG signals by means of the procedure nt_inpaint in the NoiseTools package (de Cheveigné & Arzounian, Citation2018). Finally, we applied the artifact detection criteria fused in BrainVision to flag remaining (unrepairable) signals in the subset of the signals that we intended to analyse, see . Stimuli that contained one or more unrepairable signals were discarded. This operation discarded two full and three reduced stimuli with target items from the Dutch participants; 14 full and 13 reduced stimuli from the French participants were discarded (most of which came from one participant).
4.1.1. Baseline correction
When time-locking at a moment somewhere in the middle of auditory stimuli, it is still reasonable to assume that the EEG activity related to the processes under analysis is reflected by differences relative to the average amplitude in a short preceding time interval. We decided to follow the procedure proposed by Alday (Citation2019), in which the amplitude in a short time interval preceding the time-lock moment is used as an additional predictor in a regression model, instead of subtracting that value from all signal samples in the time window under analysis.
4.1.2. Removing exogenous excitation
While stimuli are playing, EEG signals reflect a combination of exogenous (the sensory input) and endogenous processes. It is safe to assume that the exogenous process is only dependent on the acoustic stimulus per sé, and not on the type of stimulus (full/reduced). To remove the exogenous component from the EEG signals, we estimated that component using Multivariate Temporal Response Functions (mTRF) (Crosse et al., Citation2016; Mulder & Boves, Citation2018) and subtracted it from the raw EEG signals. See Appendix C for a technical explanation of the procedure.
4.1.3. The effects of eye movement
It might be argued that EEG signals that are recorded simultaneously with eye movements that might be of interest are fundamentally corrupted because of the interference caused by those eye movements. However, we are confident that this is not the case and that it is fully justified to analyse EEG signals, even if they coincide with events (saccades) in the eye movements. First of all, the extensive preprocessing described above has removed potentially detrimental interference from eye movements or resulted in discarding trials that could not be cleaned. Second, if we time-lock EEG signals on the start of a fixation, we can be sure that there is a substantial time interval in which the eyes do not move. Third, as explained below, we focussed our analysis on those EEG channels that are known to be least affected by eye movement. Fourth, and perhaps most importantly, we verified the integrity of the EEG signals used in the analysis by subjecting them to the same mTRF-based “cleaning” as used with the auditory exogenous stimulation. Analyses of EEG signals after this additional cleaning yielded the same results as the original signals. See Appendix C.1 for more detail.
4.1.4. The case for using linear mixed effects models
Because restricting the analysis to classical ERP components such as the N400 or P600 might result in missing relevant details about the time course of cognitive processes in a somewhat unconventional task, we took recourse to the overlapping time window approach described in Nijveld and Ernestus (Citation2019). This approach is similar to the approach followed in Winsler et al. (Citation2018), who investigated changes over time by means of linear mixed-effects models LME in nine non-overlapping time windows of 100 ms duration.
Starting at the time-lock moment, we shifted an analysis window with a duration (analysis length) of 100 ms along the time axis through the EEG signal with a step size of 50 ms. The left hand border of the first window considered was at the time-lock moment; the left hand border of the last window was at 1000 ms beyond time-lock. This results in 20 windows for each analysis. For the time course analyses we aligned the t-values obtained from lme4 (Bates et al., Citation2015) analyses to the midpoint of these windows. In the analysis of the EEG data we are especially interested in possible effects of the factors reduction and group (natives vs. learners). We included word frequency as a control predictor. For this purpose we used the log-transformed lemma counts in film subtitles in Lexique (New et al., Citation2004), indicated as logFreqFilm.
Because the data in each window in each set of signals are unique, it is impossible to determine a single model that is optimal for all those data sets. To allow for a straightforward comparison and interpretation, we decided to use the same, relatively simple, model for all windows. That model is:
lmer_test = lmer(amplitude ∼ Alday+trial+block+
reduction*language*logFreqFilm+I(time-startTime)+
(1+logFreqFilm+reduction|ppn)+(1|word), data = segment, REML = F,
control=lmerControl(optimizer=“bobyqa”,
optCtrl=list(maxfun=100000)))
Next, we filtered the sequences of t-values of all factors and interactions. In this process, all values that were not part of a sequence of at least three consecutive significant values were treated as not significant. By doing this, we make sure that spurious values
will not affect the final interpretation. The requirement that t-values should be part of uninterrupted sequences of significant values of length three or more reflects the conventional Bonferoni correction.
To facilitate the interpretation of the results we decided to analyse the averages of three clusters of five EEG electrodes: midline = [“Fz”, “FCz”, “Cz”, “CPz”, “Pz”] (the channels in the lime-coloured box in ), centre [“C1”, “C2”, “C3”, “C4”, “Cz”] (in the black box) and posterior [“P1”, “P2”, “P3”, “P4”, “Pz”] (in the blue box). The motivation for choosing these midline, central and posterior clusters is to capture N100, N400 and P600 effects, which are shown to be maximal at fronto-central, centro-parietal (Kutas & Federmeier, Citation2011), and posterior midline sites (Gouvea et al., Citation2010), respectively. Note that all pairs of these sets share one sensor. The amplitude-normalised EEG channels in the sets are averaged and the results are then subjected to an lmer analysis. To facilitate the interpretation of factors and their interactions, we highlight sequences of t-values and
with a length
.
4.2. Results
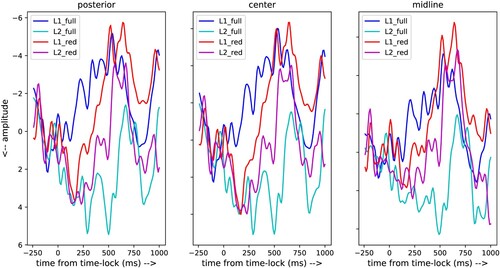
shows the ERPs for the four stimulus conditions under investigation (full versus reduced stimuli and native versus non-native listeners). It can be seen that the average ERPs of the four conditions differ between each other, and that the differences between the midline, centre and posterior sensors are small.
Figure 5. ERPs of three groups of five EEG channels covering the centre censors, posterior sensors and midline sensors (see ).
For each of the three sets of sensors we have 20 lme results from the model lmer_test above. As an example, shows the results for the analysis of window # 13 and the set of posteriors sensors. The complete set of 60 models are in the Supplementary Materials. To be able to show the results of these 60 models, we graphically present the t-values of the factors reduction and language and their interaction in . Results for other factors and interactions can be obtained from the Supplementary Material. As could be expected from the ERPs in , the t-values of the two factors and their interaction obtained with the model lmer_test are very similar for the three sets. The vertical axes in show the t-values of the factors and the interaction. Note that the scales of the vertical axes in the sub-panels are different; they are calibrated by the dashed brown and pink horizontal lines that indicate the values t = +1.96 and t = −1.96, respectively. The horizontal axis of the sub-figures represents time from the onset of the target words.
Figure 6. Significant t-values for the factors reduction and language and the interaction between these factors in each of the three sets of signals analysed.
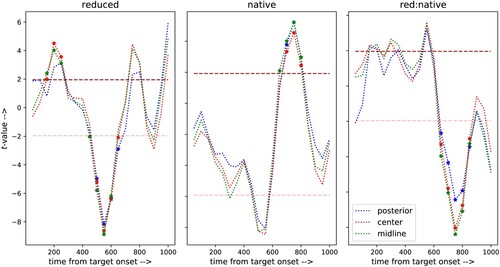
Table 3. Example of a complete lme model (posterior sensors, target onset, window # 13).
From the left panel in it can be seen that the factor reduction induces a P200-like effect. According to Crowley and Colrain (Citation2004) a more positive-going P200 component may indicate that less attention or effort is devoted to acoustic processing of the onset of reduced target words. The factor reduction also shows a very pronounced N600-like component, or perhaps more plausibly, a very strong diminishing of the more familiar P600 component that is generally associated to semantic processing (Brown & Hagoort, Citation1999).
The t-values for the factor group in the middle panel of show a significant positive-going ERP component, centred at 750 ms after the onset of the target words for the native listeners. Given the fact that the average duration of the target words is 370 ms for the reduced and 460 ms for the full forms of the words, the cognitive effect associated with this component is most likely related to syntactic or semantic integration. The significantly negative-going t-values for the interaction reduction:group in the right-hand panel suggest that this integration effect plays out very differently for the processing of the reduced forms by the native listeners.
In summary, the EEG analysis with the conventional time-lock on target word onset shows that there are effects of the factor reduction with respect to acoustic-phonetic decoding, lexical access and syntactic/semantic integration. The former effects hold for both groups. If the assumption of Crowley and Colrain (Citation2004) that a more positive-going P200 indicates a lower level of attention and effort devoted to acoustic-phonetic decoding is correct, this implies that final processing of the reduced stimuli is postponed, awaiting the advent of additional information. This may result in what might either be a delayed N400 or a substantially diminished P600 component that indicates that lexical-semantic access and syntactic integration are more difficult for the reduced target words. We also see an effect of the factor group in the time interval centred around 750 ms after target word onset, where syntactic/semantic integration is the most likely cognitive process. The interaction between the factors reduction and group in a broad time interval centred around 750 ms after target word onset suggests that natives handle syntactic/semantic integration of reduced nouns different than advanced learners. The combination of these effects suggests that reduction affects acoustic-phonetic decoding and lexical access in both groups, but when it comes to syntactic/semantic integration the natives have recovered faster or more completely than the learners.
In terms of conventional ERP components our results do not straightforwardly replicate previous findings. This indicates that the passive listening-for-meaning task in our experimental design invokes putative cognitive processes such as phonetic decoding, lexical access and syntactic/semantic integration in a quite task-specific manner. In terms of differences between natives and learners the results suggest that reduction affects acoustic-phonetic decoding in both groups, but the natives recover faster and more effectively.
5. Combined analysis of EEG and Eye movement data
The analysis of EEG signals crucially depends on the definition of “events” that trigger some cognitive activity in the processing of individual trials by individual participants and that therefore define potentially meaningful time-lock moments. In the analyses above we used the conventional “event” onset of the target word to define the time-lock moment. However, the availability of Eye Tracking data allows us to define alternative “events” that can be used for time-locking. Those events might open up a window into cognitive processing defined by behaviours of individual listeners while processing individual stimuli, rather than events defined on the basis of stimulus features that are the same for all listeners. In defining these “events” we need to take into account that the participants were not instructed to fixate the pictures displaying the target word. Also, the set-up of the experiment was such that participants could grasp the information in the four pictures without explicitly fixating all pictures. We defined four “events” that can be derived from the Eye Track data and that may yield information about the processing of the combined auditory and visual information:
| (1) | the first moment, in a time window of 500 ms starting 200 ms after the onset of the target word, at which the eye track enters the region of interest (RoI) associated with the picture of the target word; | ||||
| (2) | the first moment, in the same 500 ms time window, at which the eye track enters the RoI associated with the picture showing the phonological competitor; | ||||
| (3) | the first moment, in the same 500 ms time window, at which the eye track enters any RoI; | ||||
| (4) | the last moment in a window that starts 200 ms after the onset of the target word and ends 200 ms after the onset of the semantically related word when the eye track enters the RoI of the target picture. | ||||
Obviously, there is some overlap between the sets of trials selected on the basis of these events. For example, the set containing the trials in which the eye track entered any RoI includes the trials in which the eye track entered the RoI of the target picture or the RoI of the phonological competitor picture. Note that the signals time-locked at the last moment when the eye track entered the RoI of the target picture may differ from the signals time-locked at the first moment that the eye track entered that RoI in the same stimulus. The numbers of trials of the four stimulus types obtained with the four events defined on the basis of the eye movements are shown in . The top line in that table shows the number of trials when the onset of the target word is taken as the time-lock event. From the remaining lines it can be inferred that the proportion of trials in which the native listeners' eye tracks entered some RoI is larger that for the learners. These observations were to be expected, given the data about the eye movements in .
Table 4. Number of trials for each of the four stimulus types with time-lock on the onset of the target word, and time-locks on the moment the eyes enter a region of interest.
It must be noted that “events” defined on the basis of features of the stimuli are fundamentally different from “events” derived from the eye tracks. Whereas the former are completely determined by the stimuli, and therefore identical for all participants, the latter are direct reflections of the behaviour of individual participants, and unique for individual trials. Therefore, the cognitive processes associated with the events based on the eye tracks may be different from the processes associated with the start of the target word.
5.1. Results
For the sake of brevity we only present and discuss the results of the analysis of the sensors in the centre line (see ). The analyses of the two other data sets yielded very similar results. shows the t-values for the factors reduction and language and their interaction for the centre line sensors. These t-values were obtained with model lmer_test-1:
lmer_test-1 = lmer(amplitude ∼ Alday+trial+block+delay+
reduction*language*logFreqFilm+I(time-startTime)+
(1+logFreqFilm+reduction|ppn)+(1|word), data = segment, REML = F,
control=lmerControl(optimizer=“bobyqa”,
optCtrl=list(maxfun=100000)))
Figure 7. Comparison between significant t-values for the factors reduction and language and the interaction between these factors obtained with time-locks on the moment that the eyes entered the Region of Interest of one of the four pictures. Data shown are for the centre sensors. Note the annotation of the horizontal axis: time from time-lock. The corresponding physical time point is different for all trials.
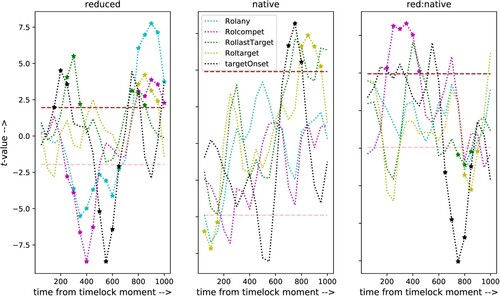
For reference, also contains the t-values for the models with time-lock on target word onset (black markers, copied from ). The latter results were obtained with model lmer_test that does not contain the predictor delay (which would by definition be equal to zero for all trials).
The first thing that strikes the eye in is the fact that time-locks based on events in the eye tracks give rise to significant effects, especially for the factor reduction, and also for the interaction reduction:language; for the factor group we only see significant t-values for the trials time-locked on the moment when the eyes enter the ROI of the target picture. This strongly suggests that the moments when the eye track enters the ROI of one of the pictures indeed index some common cognitive activity. It could be objected that the significant t-values obtained with the subsets of trials obtained from eye track events simply represent the same effects as obtained with the conventional time-lock on target word onset, but shifted by 200 ms because of a shift in the time-lock moments. However, if that were the case, the additional predictor delay could not possibly be significant. Moreover, a detailed analysis of the delay measures shows that the 90th percentile of the delay measures for the trials with time-lock defined by entering the RoI of the target or the competitor is at 600 ms after target word onset (the tenth percentile is at 200 ms). For time-lock defined by the last moment in which the eye track enters the RoI of the target picture the tenth and 90th percentiles are at 330 and 1800 ms after target word onset, with an almost uniform distribution. Still, time-locks defined by that event result in lme-models with highly significant effects for reduction and the interaction reduction:language.
In interpreting the results summarised in it should be emphasised that the horizontal axis corresponds to time after the time-lock moments defined above (and that differ between the four definitions). Only for the “conventional” time-lock on target word onset (the black markers) all trials in the data sets share a common time-lock moment. It must also be kept in mind that the sets of trials used in the analyses differ between the time-lock definitions, and that these sets contain different numbers of trials.
The most important result of the analysis with respect to the main factor reduction (left-hand panel in ) is the very significant effect in the time interval between 800 and 1000 ms after the time-lock moment in the data set that comprises the trials in which the eyes entered any RoI (cyan markers). The t-values for the sets of trials time-locked at the moment when the eyes entered the RoI of the target (yellow markers) or the phonological competitor (magenta markers) are also significant in that time window. Importantly, a similar effect is absent from the analysis of the complete set of trials with time-lock on target word onset (black markers). This suggests that visual information does play a role related to syntactic/semantic integration in the stimuli with reduced target words in the trials that have a fixation on one of the pictures. This effect could only be uncovered by using information from the eye movements to define alternative time-lock events. Equally importantly, that effect was absent in analyses of the same subsets of the trials, but with time-lock on the onset of the target words (not shown). This confirms that the significant t-values in the time interval between 800 and 1000 ms after the moment when the eye track entered an RoI are related to some kind of integration of visual and auditory information.
The absence of the P200 component, which was significant in the analysis of the complete set of trials, in the trials time-locked on the moment the eyes enter an RoI is due to the fact that we only included trials in which the eyes entered an RoI later than 200 ms after target word onset. This also explains the leftward shift of the significant negative t-values for the factor reduction for the stimuli with time-lock on the moment the eyes enter the RoI of any picture, including the competitor picture.
There are indications for a special status of looking to the target word picture. First, in the results for reduction the t-values for the set of trials time-locked on the moment when the eyes enter the RoI of the target word fail to yield significant t-values in the time window between 250 and 600 ms, while the sets for the competitor and all trials do show significant t-values in that time interval. In addition, the only significant effect for the factor language holds for the trials in which the listener looked at the target picture. There are significant negative t-values centred at 100 ms after the time-lock event. However, this cannot possibly be a conventional N100, because time-lock events cannot be earlier than 200 ms after target word onset. Possibly, early looks at the target picture are related to faster lexical access in the native listeners. In addition, we see significant positive t-values in a time window centred at 800 ms after looking at the target picture. This suggests that looking at the target picture indexes a difference between the natives and the learners with respect to semantic integration.
The results for the interaction reduction:language show that the significant negative-going ERP amplitudes in the time window up to 500 ms after time-lock for the factor reduction for the trials in which the listener looked at the competitor picture (magenta markers) only hold for the learners: for the native listeners those amplitudes become less negative-going, because of the addition of a significant positive-going effect. Also the significant positive going effects for the reduced stimuli in the time window around 800 ms are diminished for the native listeners, suggesting that any specific effect of late semantic integration in the reduced stimuli differs between native listeners and learners.
The t-values obtained from the analysis of the trials time-locked at the last moment when the eyes entered the RoI of the target picture before the listener being able to recognise the semantically related word (the lime-coloured markers) show a very different pattern. We see significant positive t-values centred at 350 ms after entering the RoI for the factor reduction. In the analysis of all trials with time-lock on target word onset we saw a similar effect, but with a centre at 250 ms post time-lock. There is another significant positive-going effect for the factor reduction centred at 800 ms after entering the RoI. For the complete set of trials time-locked at target word onset there is one t-value at 800 ms that we do not accept as significant because it is not part of a sequence of at least three such values. The significant negative t-values in the time window centred at 800 ms after last entering the target RoI in the interaction reduction:language again suggest that the effect of looking at the target picture differs between the natives and the learners.
In summary, the analysis of EEG signals with time-lock on the moment when the eyes entered the RoI of one of the four pictures that were displayed during the full duration of the auditory stimuli shows that there is a difference between full and reduced stimuli that appears some 800 ms after the moment when the eyes enter an RoI. A similar effect was not significant in the analysis of the complete set of trials with time-lock on target word onset. Therefore, the effect can only be attributed to a cognitive process associated with the eye movements. Given the long delay between the time-lock moment and the effect in the EEG signals (and the even longer distance to the start of the target word), the effect can only be attributed to syntactic or semantic integration. In addition, the difference between the two groups in the trials time-locked at the moment when the eyes enter the RoI of the target word, associated with the only phonological representation of the actual speech signal, suggests that lexical access is faster in the natives than in the learners.
6. General discussion
Previous research into the processing of reduced forms by native listeners versus learners has shown that learners suffer more from reduction than native listeners, both in terms of the speed and accuracy with which they process these forms (e.g. Nouveau, Citation2012; Stridfeldt, Citation2005; Wong et al., Citation2015). These problems are generally attributed to the acoustic decoding of the stimuli, combined with slower and more effortful lexical retrieval. However, due to the design of many of the (predominantly) behavioural studies, they can only indirectly address the cognitive processes underlying the observed behaviour.
The aim of this study was to obtain more insights into the cognitive processes that are involved in the comprehension of speech in both natives and advanced learners. We investigated how natives and advanced learners process schwa reduction in French nouns (e.g. /rkϵ̃/ for /rəkϵ̃/ (“requin”) within sentences. Participants performed a passive listening visual world task, in which they heard a sentence with either a reduced or a full word form in mid-sentence position and were simultaneously shown pictures representing the target word (e.g. fenêtre /fənεtr/ “window”), a phonological competitor (e.g. fourchette /furʃεt/ “fork”), and two neutral distractors (see ). After each sentence participants saw a photo of a scene, and they had to decide whether or not this photo represented the meaning expressed in the sentence. Eye movements and EEG were recorded simultaneously.
An additional aim of this study was more methodological in nature. Given the indirect relation between cognitive processes on the one hand and EEG signals (e.g. Kutas & Federmeier, Citation2011) or eye movements (e.g. Huettig et al., Citation2011) on the other, it is very difficult to make hard and fast conclusions about those relations. We investigated whether combining EEG and eye movement data would allow us to be more specific about putative underlying cognitive processes.
It appeared that the passive listening task, chosen because it is more ecologically realistic than visual world paradigms in which participants have to use eye fixations to enable mouse clicks, failed to uncover a strong effect of phonological competition. An important difference with several previous experiments was the fact that phonological overlap between targets and competitors was limited to the word-initial consonants. With words that have a schwa in the first syllable, longer overlaps, and especially overlaps including a stressed vowel (for example panda and pencil in Weber & Cutler, Citation2004) are impossible. For that reason we will not discuss the differences in the proportions of fixations to target and competitor pictures in in any detail.
In any 10 ms bin in the time interval up to 800 ms after the onset of the (full or reduced) target word the native listeners fixated a picture in slightly less than 40% of the trials; the learners had fixations in about 30% of the trials. We found that the difference in proportions fixations on target and competitor pictures starts to increase later in the reduced than in the full stimuli for the native listeners (see ). This suggests that reduction of the schwa in word-initial syllables, which is a very frequent effect in everyday spoken French, still might affect phonetic decoding. This is different from the results of the EEG study by Drijvers et al. (Citation2016), who found an effect of mid-sentence reduction in native speakers of Dutch on semantic integration, but not on phonetic decoding. Debriefings after the conclusion of the experiment showed that none of the native listeners discovered an alternation in full or reduced versions of words with a schwa in the first syllable. also shows that the learners had a larger preference for looking at the target over the competitor picture in the reduced than in the full stimuli, but this effect was most pronounced after the offset of the target words. Therefore, in advanced learners mid-sentence schwa-reduction seems to affect mainly lexical-semantic access.
The finding that in any 10 ms time bin not more than 40% of the trials had a fixation for the natives and only some 30% for the learners may seem to contradict the numbers in , but the difference is due to different perspectives on the data. For defining a time-lock moment any fixation in the time interval between 200 and 800 ms after target word onset selects a trial; thus, it can be said that the perspective is horizontal (along the time axis). The per-bin data underlying the growth curve analysis are strictly “vertical” in nature; this perspective ignores all trials that did not have a fixation in a specific bin, regardless of whether those trials had fixations in earlier or later bins. So what the growth curves tell us is that, if there is a fixation in time bins with increasing distance to the start of the target word, the probability that this will be a fixation of the target word increases. In terms of the hypotheses about the link between speech processing and fixations proposed by Dahan et al. (Citation2007) this suggests that fixations may indicate a verification of the result of lexical-semantic access. Note that we still do not know in which way the verification works. A fixation on the target picture can signal the fact that the word has been understood, but it also possible that it means that the fixation intends to make sure that the lexical hypothesis is correct. If anything, we may speculate that the fact that the natives fixate the target picture almost equally often in the full and reduced stimuli from 500 ms after target word onset indicates that the target word has been recognised. For the learners, who fixate the target picture more often in the reduced stimuli, the other interpretation may hold: a fixation indicates an attempt to make sure that the lexical hypothesis is correct.
The analysis of the EEG signals with time-lock on target word onset confirms the finding that reduction of (unpredictable) sentence-medial nouns affects acoustic-phonetic decoding in natives and learners. Although the significant negative-going ERP amplitude associated with reduction centred around 550 ms after target word onset is not easy to interpret in terms of conventional ERP components such as N400 (Kutas & Federmeier, Citation2011) and P600 (Brown & Hagoort, Citation1999), the significant (positive) t-values for the factor group and the significant (negative) t-values of the interaction reduction:group suggest that the natives have an easier time recovering from the acoustic-phonetic decoding issue.
Usually, time-lock events for the analysis of EEG signals are defined on the basis of stimulus properties. The combination of eye tracking and EEG signals allowed us to define time-lock events on the basis of the eye movements, which may correspond to endogenous cognitive processes. We time-locked the EEG signals of subsets of the data based on four different events that can be derived from the eye movements: the first fixation of the target picture after the onset of the target word, the first fixation of the competitor picture after the onset of the target word, the first fixation on any picture, and the last fixation of the target picture before the start of the semantically related word, which may help to -retroactively- recognise the target word. The first result of using visual events to define time-lock events was that these events uncovered significant statistical effects, despite the fact that the trial subsets were relatively small and the position of the time-lock moments in the stimuli differed between trials. Unsurprisingly, this confirms that eye movements do index cognitive processes that can be retrieved from EEG signals. In addition, we found evidence about a relation between looking behaviour and lexical access for the target words. Finally, we found a strong relation between looking behaviour and syntactic/semantic integration.
6.1. The relation between visual and auditory information
The design of our experiment differs fundamentally from the type of design used previously by (e.g. Dahan et al., Citation2007; Weber & Cutler, Citation2004), where participants needed to fixate a picture to be able to click on it with a mouse. Arguably, this makes it difficult, and perhaps dangerous, to use our results to arbitrate between the hypotheses about the relation between eye movements and speech processing put forward in Dahan, Magnuson, and Tanenhaus (Citation2001). Therefore, we prefer to discuss our results in terms of how working memory representations of the stationary visual display on the one hand and unfolding speech information on the other are integrated. In doing so, we assume that the representation of the visual display is not affected by the accumulating evidence in the speech signals.
Our design offers two sets of data about the relation between visual and auditory information: the growth curves discussed in Section 3 and the EEG analyses using time-locks derived from eye movements in Section 5. Especially the EEG data show a strong effect for the factor reduction that occurs about 750 ms after the eyes enter the RoI of one of the pictures. The curves in suggest a preference for looking at the target picture. The timing of that effect shows that it is related to semantic (and perhaps also syntactic) integration. The fact that a similar effect is not present in the analysis of all data with time-lock on target word onset strongly suggests that fixating any picture boosts the integration of the auditory information and the working memory representation of the pictures that is also available in the trials without a fixation. Note that this such a boost only requires conceptual (semantic) representations of the objects on the display and not necessarily also phonological representations of the names of the objects.
The fact that the effects of looking at the target picture are different from the other pictures, especially in the time interval up to 500 ms after the moment the eyes enter the RoI, strongly suggest an influence of phonological representations of the target's name, activated by the visual display. Because the display precedes the speech, it must be assumed that the cause-effect relation is from display to phonetic decoding and especially lexical access.
6.2. Differences between natives and learners
Several results may help us better understand differences between the processing of the spoken utterances between native listeners and advanced learners, especially with respect to processing reduced pronunciation variants. And these results all suggest that the differences are mainly in syntactic-semantic integration, and probably also in lexical access. The first indication comes from the proportions fixations on the target picture in . Shortly after the offset of the target words natives look at the target picture equally often for the full and reduced stimuli. The learners look more often at the target picture in the reduced stimuli. Another indication of a difference between natives and learners comes from the significant effect of the factor group in the analysis of the EEG signals time-locked at target word onset in the time interval centred at 750 ms after target word onset (see . The very significant interaction reduction:group in the same time interval strengthens the interpretation that the learner's difficulties are mainly with semantic integration.
The significant effects in the trials time-locked at the moment the eyes enter the RoI of the target word for the factor group in centred around t = 100 ms suggest that lexical access happens faster in the natives than in the learners. And faster lexical access may translate into faster syntactic and semantic integration. Neither set of data offers conclusive evidence about a difference between the two groups with respect to acoustic-phonetic decoding. In a way, this is not surprising, because acoustic-phonetic decoding per sé is arguably the cognitive process that is most bottom-up and signal-driven. We do not have an explanation for the significant effect in the interaction reduction:group in the time interval between 300 and 500 ms after the moment the eyes enter the RoI of the competitor picture in .
6.3. About combining EEG and eye movements
Our exploratory foray into combining eye tracking and EEG analysis for investigating differences between natives and advanced learners of French in the processing of reduced pronunciations allowed us to attribute most of the difficulties that learners have to syntactic/semantic integration, and, perhaps most importantly, they suggest a difference between the two groups with respect to lexical access. Time-locking EEG signals on the moment when the eyes enter the RoI of a picture showed that fixations boost the contribution of the conceptual/semantic information provided by the visual information, compared to trials that lacked such a fixation. It also uncovered the fact that fixations of the target picture suppress the effect of reduction in the time interval where lexical access takes place. These findings will allow us and other researchers to set up future, possible less complicated, virtual world experiments in which the combination of the two measures can be used to answer more targeted questions.
6.4. Open issues
From the data summarised in it can be seen that the learners move their eyes in a manner that is very different from the native listeners. The design of our experiment did not allow us to investigate whether different eye movements reflect systematic differences in the nature of the cognitive processes in the two groups. It is unlikely that the natives have relied on the visual information to understand the –admittedly context-free– utterances. This may have been different for the learners.
Our data show conclusively that the visual information affects semantic (and possibly also syntactic) integration of the target words. For supporting semantic integration it suffices that the participants form conceptual representations of the objects shown on the screen. The special status of the target words with respect to acoustic-phonetic decoding and lexical access, on the other hand, is difficult to explain without assuming that phonological representations also play a role. However, targeted experiments are needed to investigate the operation of decoding and lexical access and possible advantages of natives, especially with respect to lexical activation.
7. Conclusions
We designed an experiment in which we recorded EEG signals while French native speakers and Dutch advanced learners of French listened to meaningful sentences. They had to decide whether a photo of a scene, showed 500 ms after the end of the sentence corresponded to the message expressed in the sentence. A crucial mid-sentence target noun with a schwa in the first syllable was reduced in half of the stimuli. The main goal of the experiment was to better understand which cognitive processes are responsible for the often reported, but badly understood, difficulties that learners have in processing reduced words. An ancillary goal was to explore whether the combination of eye tracking and EEG recording can uncover information that either technique used on its own cannot.
It appeared that the eye movements of the learners are best characterised as a random walk in an area around the centre of the screen, whereas the natives seem to use their eyes in a more strategic manner. Both eye movements and EEG signals indicate that learners and natives are affected by mid-sentence reductions, but the native listeners appear to recover from the difficulties faster than the learners, most probably because of faster lexical access. An analysis of the EEG signals in which we defined time-lock moments at the moment when a fixation on a picture on the screen started showed that these fixations affected late semantic integration; semantic integration of reduced words appears to differ between the two groups.
Our experiment raised the question to what extent the differences between natives and learners with respect to semantic integration of reduced mid-sentence nouns can be explained by slower or more uncertain lexical access. However, we are confident that targeted visual world experiments in which EEG is also recorded can answer that question. Targeted experiments are also needed to investigate whether the different eye movement patterns between natives and learners point to different processes or strategies in the integration of the visual and auditory information in a passive listening task where the goal is to understand the message in the stimulus sentences.
Supplemental Material
Download PDF (246 KB)Acknowledgments
The authors thank Thera Baayen for helping to run the combined eye-tracking and ERP experiment in Paris. The authors thank Cécile Fougeron, Janine Berns, Iris Mulders, Jenny Doetjes, Jos Pacilly, and Jan Hulstijn who made it possible to conduct the experiments in Paris, Nijmegen, Utrecht, Leiden, and Amsterdam.
The authors thank Effie Kapnoula and an anonymous reviewer for their comments on a previous version of the manuscript that have resulted in substantial improvements of the presentation of the experiment and its outcomes.
Disclosure statement
The authors declare that they have no known competing financial interests or personal relationships that could have appeared to influence the work reported in this paper.
Additional information
Funding
Notes
2 The relatively large number of excluded participants is due to technical problems with simultaneously recording eye tracking and EEG, combined with our intention to only include participants for whom both measures were recorded without substantial amounts of artifacts.
References
- Adda-Decker, M., Boula de Mareüil, P., Adda, G., & Lamel, L. (2005). Investigating syllabic structures and their variation in spontaneous French. Speech Communication, 46(2), 119–139. https://doi.org/10.1016/j.specom.2005.03.006
- Alday, P. M. (2019). How much baseline correction do we need in ERP research? Extended GLM model can replace baseline correction while lifting its limits. Psychophysiology, 56(12), e13451. https://doi.org/10.1111/psyp.13451
- Allopenna, P. D., Magnuson, J. S., & Tanenhaus, M. K. (1998). Tracking the time course of spoken word recognition using eye movements: Evidence for continuous mapping models. Journal of Memory and Language, 38(4), 419–439. https://doi.org/10.1006/jmla.1997.2558
- Altmann, G., & Kamide, Y. (2004). Now you see it, now you don't: Mediating the mapping between language and the visual world. In F. Ferreira (Ed.), The integration of language, vision, and action: Eye movements and the visual world (pp. 347–386). Psychology Press.
- Altmann, G., & Kamide, Y. (2007). The real-time mediation of visual attention by language and world knowledge: Linking anticipatory (and other) eye movements to linguistic processing. Journal of Memory and Language, 57(4), 502–518. https://doi.org/10.1016/j.jml.2006.12.004
- Ardal, S., Donald, M. W., Meuter, R., Muldrew, S., & Luce, M. (1990). Brain responses to semantic incongruity in bilinguals. Brain and Language, 39(2), 187–205. https://doi.org/10.1016/0093-934X(90)90011-5
- Bates, D., Mächler, M., Bolker, B., & Walker, S. (2015). Fitting linear mixed-effects models using lme4. Journal of Statistical Software, 67(1), 1–48. https://doi.org/10.18637/jss.v067.i01
- Boersma, P., & Weenink, D. (2019). Praat: Doing phonetics by computer. https://www.praat.org/
- Brand, S., & Ernestus, M. (2018). Listeners' processing of a given reduced word pronunciation variant directly reflects their exposure to this variant: Evidence from native listeners and learners of French. Quarterly Journal of Experimental Psychology, 71(5), 1240–1259. https://doi.org/10.1080/17470218.2017.1313282
- Brouwer, S., Mitterer, H., & Huettig, F. (2012). Speech reductions change the dynamics of competition during spoken word recognition. Language and Cognitive Processes, 27(4), 539–571. https://doi.org/10.1080/01690965.2011.555268
- Brown, C., & Hagoort, P. (Eds.). (1999). The neurocognition of language. Oxford University Press.
- Brysbaert, M. (2013). LEXTALE-FR: A fast, free, and efficient test to measure language proficiency in French. Psychologica Belgica, 53, 23–37. https://doi.org/10.5334/pb-53-1-23
- Bürki, A., Ernestus, M., & Frauenfelder, U. H. (2010). Is there only one “fenêtre” in the production lexicon? On-line evidence on the nature of phonological representations of pronunciation variants for French schwa words Is there only one “fenêtre” in the production lexicon? On-line evidence on the nature of phonological representations of pronunciation variants for French schwa words. Journal of Memory and Language, 62, 421–437. https://doi.org/10.1016/j.jml.2010.01.002
- Bürki, A., Fougeron, C., & Gendrot, C. (2007). On the categorical nature of the process involved in schwa elision in French. In Proceedings of Interspeech-2007 (pp. 1026–1029). International Speech Communication Association (ISCA).
- Cohen, C., Carlson, M., & Dussias, P. E. (2023, February). Just to be safe: Listeners use redundant phonetic information to distinguish unsuffixed from suffixed nouns. PsyArXiv. psyarxiv.com/uy823
- Council of Europe (2011). Common European framework of reference for languages: Learning, teaching, assessment. https://www.coe.int/t/dg4/linguistic/cadre1_en.asp
- Crosse, M., Di Liberto, G., Bednar, A., & Lalor, E. (2016). The multivariate temporal response function (mTRF) toolbox: A MATLAB toolbox for relating neural signals to continuous stimuli. Frontiers in Human Neuroscience, 10, Article 604. https://doi.org/10.3389/fnhum.2016.00604
- Crowley, K. E., & Colrain, I. M. (2004). A review of the evidence for P2 being an independent component process: Age, sleep and modality. Clinical Neurophysiology, 115(4), 732–744. https://doi.org/10.1016/j.clinph.2003.11.021
- Cutler, A. (2012). Native listening: Language experience and the recognition of spoken words. MIT Press.
- Dahan, D., Magnuson, J. S., & Tanenhaus, M. K. (2001). Time course of frequency effects in spoken-word recognition: Evidence from eye movements. Cognitive Psychology, 42(4), 317–367. https://dx.doi.org/10.1006/cogp.2001.0750
- Dahan, D., Magnuson, J. S., Tanenhaus, M. K., & Hogan, E. M. (2001). Subcategorical mismatches and the time course of lexical access: Evidence for lexical competition. Language and Cognitive Processes, 16, 507–534. https://doi.org/10.1080/01690960143000074
- Dahan, D., Tanenhaus, M., & Salverda, A. P. (2007). The influence of visual processing on phonetically driven saccades in the “visual world” paradigm. In R. van Gompel, M. Fischer, W. Murray, & R. Hill (Eds.), Eye movements: A window on mind and brain (pp. 471–486). Elsevier. https://doi.org/10.1016/B978-008044980-7/50023-9
- de Cheveigné, A., & Arzounian, D. (2018). Robust detrending, rereferencing, outlier detection, and inpainting for multichannel data. NeuroImage, 172, 903–912. https://doi.org/10.1016/j.neuroimage.2018.01.035
- Drijvers, L., Mulder, K., & Ernestus, M. (2016). Alpha and gamma band oscillations index differential processing of acoustically reduced and full forms. Brain and Language, 153–154, 27–37. https://doi.org/10.1016/j.bandl.2016.01.003
- Erb, J., & Obleser, J. (2013). Upregulation of cognitive control networks in older adults' speech comprehension. Frontiers in Systems Neuroscience, 7, 116. https://doi.org/10.3389/fnsys.2013.00116.
- Ernestus, M. (2000). Voice assimilation and segment reduction in casual Dutch. A corpus-based study of the phonology-phonetics interface [Unpublished doctoral dissertation]. Free University. (Print ISBNs 9789076864020, 9076864020).
- Ernestus, M., Baayen, R., & Schreuder, R. (2002). The recognition of reduced word forms. Brain and Language, 81, 162–173. https://doi.org/10.1006/brln.2001.2514
- Ernestus, M., Dikmans, M., & Giezenaar, G. (2017). Advanced second language learners experience difficulties processing reduced word pronunciation variants. Dutch Journal of Applied Linguistics, 6(1), 1–20. https://doi.org/10.1075/dujal
- Ernestus, M., Kouwenhoven, H., & van Mulken, M. (2017). The direct and indirect effects of the phonotactic constraints in the listener's native language on the comprehension of reduced and unreduced word pronunciation variants in a foreign language. Journal of Phonetics, 62, 50–64. https://doi.org/10.1016/j.wocn.2017.02.003
- Gouvea, A. C., Phillips, C., Kazanina, N., & Poeppel, D. (2010). The linguistic processes underlying the P600. Language and Cognitive Processes, 25(2), 149–188. https://doi.org/10.1080/01690960902965951
- Hahne, A. (2001). What's different in second-language processing? Evidence from event-related brain potentials. Journal of Psycholinguistic Research, 30, 251–266. https://doi.org/10.1023/A:1010490917575
- Hahne, A., & Friederici, A. D. (2001). Processing a second language: Late learners' comprehension mechanisms as revealed by event-related brain potentials. Bilingualism: Language and Cognition, 4(2), 123–141. https://doi.org/10.1017/S1366728901000232
- Hanique, I., Schuppler, B., & Ernestus, M. (2010). Morphological and predictability effects on schwa reduction: The case of Dutch word-initial syllables. In Proceedings of Interspeech-2010 (pp. 933–936). International Speech Communication Association (ISCA).
- Huettig, F., & G. T. M. Altmann (2005). Word meaning and the control of eye fixation: Semantic competitor effects and the visual world paradigm. Cognition, 96, 23–32. https://doi.org/10.1016/j.cognition.2004.10.003
- Huettig, F., & McQueen, J. M. (2007). The tug of war between phonological, semantic and shape information in language-mediated visual search. Journal of Memory and Language, 57(4), 460–482. https://doi.org/10.1016/j.jml.2007.02.001
- Huettig, F., Olivers, C. N., & Hartsuiker, R. J. (2011). Looking, language, and memory: Bridging research from the visual world and visual search paradigms. Acta Psychologica, 137(2), 138–150. https://doi.org/10.1016/j.actpsy.2010.07.013Visual search and visual world: Interactions among visual attention, language, and working memory.
- Huettig, F., Rommers, J., & Meyer, A. S. (2011). Using the visual world paradigm to study language processing: A review and critical evaluation. Acta Psychologica, 137(2), 151–171. https://doi.org/10.1016/j.actpsy.2010.11.003
- Ito, A., Pickering, M. J., & Corley, M. (2018). Investigating the time-course of phonological prediction in native and non-native speakers of English: A visual world eye-tracking study. Journal of Memory and Language, 98, 1–11. https://doi.org/10.1016/j.jml.2017.09.002
- Johnson, K. (2004). Massive reduction in conversational American English. In K. Yoneyama & K. Maekawa (Eds.), Spontaneous speech: Data and analysis. Proceedings of the 1st session of the 10th International Symposium (pp. 29–54). Tokyo: National International Institute for Japanese Language.
- Just, M. A., & Carpenter, P. A. (1980). A theory of reading: From eye fixations to comprehension. Psychological Review, 87(4), 329–354. https://doi.org/10.1037/0033-295X.87.4.329
- Kohler, K. J. (1990). Segmental reduction in connected speech in German: Phonological facts and phonetic explanations. In W. Hardcastle & A. Marchal (Eds.), Speech production, speech modelling (pp. 21–33). Kluwer Academic Publishers.
- Kotz, S. A., Holcomb, P. J., & Osterhout, L. (2008). ERPs reveal comparable syntactic sentence processing in native and non-native readers of English. Acta Psychologica, 128(3), 514–527. https://doi.org/10.1016/j.actpsy.2007.10.003
- Kutas, M., & Federmeier, K. D. (2011). Thirty years and counting: Finding meaning in the N400 component of the event-related brain potential (ERP). Annual Review of Psychology, 62, 621–647. https://doi.org/10.1146/psych.2011.62.issue-1
- Lahey, M., & Ernestus, M. (2014). Pronunciation variation in infant-directed speech: Phonetic reduction of two highly frequent words. Language Learning and Development, 10(4), 308–327. https://doi.org/10.1080/15475441.2013.860813
- Lemhöfer, K., & Broersma, M. (2012). Introducing LexTALE: A quick and valid Lexical test for advanced learners of English. Behavior Research Methods, 44(2), 325–343. https://doi.org/10.3758/s13428-011-0146-0.
- Lennes, M., Alaroty, N., & Vainio, M. (2001). Is the phonetic quality of unaccented words unpredictable? An example from spontaneous finnish. Journal of the International Phonetic Association, 31, 127–138. https://doi.org/10.1017/S0025100301001104
- Makeig, S., Bell, A., Jung, T. P., & Sejnowski, T. (1996). Independent component analysis of electroencephalographic data. In D. Touretzky, M. Mozer, & M. Hasselmo (Eds.), Advances in neural information processing systems (pp. 145–151). MIT Press.
- Manor, B. R., & Gordon, E. (2003). Defining the temporal threshold for ocular fixation in free-viewing visuocognitive tasks. Journal of Neuroscience Methods, 128, 85–93. https://doi.org/10.1016/S0165-0270(03)00151-1
- Matin, E., Shao, K., & Boff, K. (1993). Saccadic overhead: Information-processing time with and without saccades. Perception & Psychophysics, 53, 372–380. https://doi.org/10.3758/BF03206780
- Miettinen, I., Tiitinen, H., Alku, P., & May, P. J. (2010). Sensitivity of the human auditory cortex to acoustic degradation of speech and non-speech sounds. BMC Neuroscience, 11, 1–13. https://doi.org/10.1186/1471-2202-11-24
- Mirman, D. (2014). Growth curve analysis and visualization using R. CRC Press.
- Mirman, D., Dixon, J. A., & Magnuson, J. S. (2008). Statistical and computational models of the visual world paradigm: Growth curves and individual differences. Journal of Memory and Language, 59(4), 475–494. https://doi.org/10.1016/j.jml.2007.11.006
- Mirman, D., & Magnuson, J. S. (2009). Dynamics of activation of semantically similar concepts during spoken word recognition. Memory & Cognition, 37(7), 1026–1039. https://doi.org/10.3758/MC.37.7.1026
- Moreno, E. M., & Kutas, M. (2005). Processing semantic anomalies in two languages: An electrophysiological exploration in both languages of Spanish–English bilinguals. Cognitive Brain Research, 22(2), 205–220. https://doi.org/10.1016/j.cogbrainres.2004.08.010
- Moreno, E. M., Rodríguez-Fornells, A., & Laine, M. (2008). Event-related potentials (ERPs) in the study of bilingual language processing. Journal of Neurolinguistics, 21(6), 477–508. https://doi.org/10.1016/j.jneuroling.2008.01.003
- Morgan-Short, K., & Tanner, D. (2013). Event-related potentials (ERPs). In J. Jegerski & B. VanPatten (Eds.), Research methods in second language psycholinguistics (pp. 127–152). Routledge.
- Mulder, K., Brekelmans, G., & Ernestus, M. (2015). The processing of schwa reduced cognates and noncognates in non-native listeners of English. In Scottish consortium for ICPhS, M. Wolters, J. Livingstone, B. Beattie, R. Smith, & M. MacMahon (Eds.), Proceedings of the 18th International Congress of Phonetic Sciences (ICPhS 2015). Glasgow: University of Glasgow.
- Mulder, K., ten Bosch, L., & Boves, L. (2018). Analyzing EEG signals in auditory speech comprehension using temporal response functions and generalized additive models. In Proceedings of Interspeech 2018 (pp. 1452–1456). International Speech Communication Association (ISCA).
- Mulder, K., Wloch, L., Boves, L., ten Bosch, L., & Ernestus, M. (2022). Cognate status modulates the comprehension of isolated reduced forms. Language, Cognition and Neuroscience, 37(5), 576–614. https://doi.org/10.1080/23273798.2021.1995611.
- New, B., Pallier, C., Brysbaert, M., & Ferrand, L. (2004). Lexique 2: A new French lexical database. Behavior Research Methods, Instruments, & Computers, 36(3), 516–524. https://doi.org/10.3758/BF03195598.
- Nijveld, A., ten Bosch, L., & Ernestus, M. (2019). ERP signal analysis with temporal resolution using a time window bank. In Proceedings of Interspeech (pp. 1208–1212). International Speech Communication Association (ISCA).
- Nouveau, D. (2012). Limites perceptives de l'e caduc chez des apprenants nééerlandophones. Revue Canadienne de Linguistique Appliquée, 15, 60–78.
- Oostenveld, R., Fries, P., Maris, E., & Schoffelen, J. (2011). FieldTrip: Open source software for advanced analysis of MEG, EEG, and invasive electrophysiological data. Computational Intelligence and Neuroscience, 2011, 1–9. https://doi.org/10.1155/2011/156869.
- Proverbio, A. M., Čok, B., & Zani, A. (2002). Electrophysiological measures of language processing in bilinguals. Journal of Cognitive Neuroscience, 14(7), 994–1017. https://doi.org/10.1162/089892902320474463
- Rossion, B., & Pourtois, G. (2004). Revisiting Snodgrass and Vanderwart's object pictorial set: The role of surface detail in basic-level object recognition. Perception, 33, 217–236. https://doi.org/10.1068/p5117
- Sanders, L. D., & Neville, H. J. (2003a). An ERP study of continuous speech processing: II. Segmentation, semantics, and syntax in nonnative speakers. Cognitive Brain Research, 15, 214–227. https://doi.org/10.1016/S0926-6410(02)00194-5
- Sanders, L. D., & Neville, H. J. (2003b). An ERP study of continuous speech processing: I. Segmentation, semantics, and syntax in native speakers. Cognitive Brain Research, 15(3), 228–240. https://doi.org/10.1016/S0926-6410(02)00195-7
- Sanders, L. D., Newport, E. L., & Neville, H. J. (2002). Segmenting nonsense: An event-related potential index of perceived onsets in continuous speech. Nature Neuroscience, 5(7), 700–703. https://doi.org/10.1038/nn873
- Shook, A., & Marian, V. (2013). The bilingual language interaction network for comprehension of speech. Bilingualism: Language and Cognition, 16(2), 304–324. https://doi.org/10.1017/S1366728912000466
- Snodgrass, J. G., & Vanderwart, M. (1980). A standardized set of 260 pictures: Norms for name agreement, image agreement, familiarity, and visual complexity. Journal of Experimental Psychology Human Learning and Memory, 6, 174–215. https://doi.org/10.1037/0278-7393.6.2.174
- Song, J., & Iverson, P. (2018). Listening effort during speech perception enhances auditory and lexical processing for non-native listeners and accents. Cognition, 179, 163–170. https://doi.org/10.1016/j.cognition.2018.06.001
- Stridfeldt, M. (2005). La perception du français oral par des apprenants suédois [Unpublished doctoral dissertation]. Umea Universitet.
- ten Bosch, L., Boves, L., & Ernestus, M. (2022, May 23). DIANA, a process-oriented model of human auditory word recognition. Brain Science, 12(5), 681. https://doi.org/10.3390/brainsci12050681
- Teruya, H., & Kapatsinski, V. (2019). Deciding to look: Revisiting the linking hypothesis for spoken word recognition in the visual world. Language, Cognition and Neuroscience, 34(7), 861–880. https://doi.org/10.1080/23273798.2019.1588338
- Thothathiri, M., & Snedeker, J. (2008). Give and take: Syntactic priming during spoken language comprehension. Cognition, 108(1), 51–68. https://doi.org/10.1016/j.cognition.2007.12.012
- van de Ven, M., Tucker, B. V., & Ernestus, M. (2011). Semantic context effects in the comprehension of reduced pronunciation variants. Memory & Cognition, 39(7), 1301–1316. https://doi.org/10.3758/s13421-011-0103-2
- van Gompel, R., Fischer, M., Murray, W., & Hill, R. (Eds.). (2007). Eye movements: A window on mind and brain. Elsevier.
- Weber, A., & Cutler, A. (2004). Lexical competition in non-native spoken-word recognition. Journal of Memory and Language, 50(1), 1–25. https://doi.org/10.1016/S0749-596X(03)00105-0
- Weber-Fox, C. M., & Neville, H. J. (1996). Maturational constraints on functional specializations for language processing: ERP and behavioral evidence in bilingual speakers. Journal of Cognitive Neuroscience, 8(3), 231–256. https://doi.org/10.1162/jocn.1996.8.3.231
- Winsler, K., Midgley, K. J., Grainger, J., & Holcomb, P. J. (2018). An electrophysiological megastudy of spoken word recognition. Language, Cognition and Neuroscience, 33(8), 1063–1082. https://doi.org/10.1080/23273798.2018.1455985.
- Wong, S. W. L., Mok, P. P. K., Chung, K. K. H., Leung, V. W. H., Bishop, D. V. M., & Chow, B. W. Y. (2015). Perception of native English reduced forms in Chinese learners: Its role in listening comprehension and its phonological correlates. Tesol Quarterly, 51, 7–31. https://doi.org/10.1002/tesq.2017.51.issue-1