
 ?Mathematical formulae have been encoded as MathML and are displayed in this HTML version using MathJax in order to improve their display. Uncheck the box to turn MathJax off. This feature requires Javascript. Click on a formula to zoom.
Abstract
In this study, a clay sample recovered from an archaeological excavation from the Krobo Mountains in Ghana was examined for its potential to decolorize and adsorb cationic methylene blue. The raw and calcined clay samples were characterized with XRD, SEM, FTIR and EDX. The supernatant obtained by washing the raw clay with 70% ethanol solution decolorized methylene blue. The decolorization of methylene blue was independent of calcination temperature up to 300°C. The clay material subjected to calcination temperature at 600°C showed strong adsorption towards cationic methylene blue. The equilibrium adsorption data fitted well with the Freundlich isotherm indicating adsorption unto heterogeneous surface with the interaction between the adsorbed molecules which is not restricted to the formation of a monolayer. The data also fitted well with the Weber and Morris model which described the rate-controlling steps. The intra-particle diffusion was controlled by pore and surface diffusion. In addition, the adsorption data followed a pseudo-second-order kinetic model, indicating a chemisorption process. The results highlight a unique property of the clay material as an effective decolorizing and adsorption agent for the removal of water-soluble dyes from contaminated water bodies.
Public Interest Statement
Water is the most basic need in life. However, water pollution through environmental pollutants such as dyes, pesticides, pharmaceutical water and heavy metals has rendered most water sources unsafe for human consumption. Water pollution by dyes has serious effect on human health and aquatic species. To reduce the impact of water pollution, different water purification strategies have been developed. However, some of the water treatment technologies developed are expensive, and hence, the need to look into developing water treatment technologies that are less costly. In this study, a clay sample recovered from an archaeological excavation from the Krobo Mountains in Ghana was examined for its potential to decolorize and adsorb cationic methylene blue. The results are very promising and showed the potential application of the clay deposit at Krobo Mountains in Ghana in developing water treatment technologies.
Competing Interests
The authors declare no competing interests.
1. Introduction
Clay materials are ubiquitous in nature, easily accessible and have been used since antiquity for the removal of impurities or undesirable color from wastewater and oil (Bennani-Karim et al., Citation2011). The ability of clay materials or their composites to remove color from materials or oils often gave such clays the name “bleaching earth” (Beshara and Cheeseman, Citation2014; Ming et al., Citation2003; Udomkun et al., Citation2018). The structural features of clays are described by their octahedral (Al3+, Fe2+, Fe3+, or Mg2+) and tetrahedral (Si4+) arrangements of atoms and they can further be modified through intercalation of cations at elevated temperatures (Detellier, Citation2018; Paineau et al., Citation2012; Vaculíková et al., Citation2019). Most clay materials obtained from archaeological contexts have been widely linked to specific medical practices including but not limited to preservation of human remains, removal of hazardous contaminants from wastewater or healing rituals which are probably due to their porous and complex topography that allows the use of the materials for such applications compared to soils and sand (Christopoulou-Aletra et al., Citation2006; Insoll, Citation2009; Van Dongen et al., Citation2011). The increasing demand for synthetic and natural dyes in the textile, paint and food industries as well as the use of dyes for biomedical research requires efforts to identify new effective adsorbing materials for such applications. Currently activated carbon has gained prominence for water treatment or in removing colored organic substances (Cheng et al., Citation2018; Khasri & Ahmad, Citation2018; Tiburu et al., Citation2017; Yang et al., Citation2019; Zhou et al., Citation2019). In addition, Kaolin and montmorillonite clays are abundant in nature with traces of other subtypes spread across continents and have been used as effective color removal agents (Daou et al., Citation2017; Kenawy et al., Citation2018; Oussalah et al., Citation2018; Vanamudan et al., Citation2014). These clays are widely used as adsorbents because of their negatively charged attributes which make them very effective in removing cationic dyes such as methylene blue. Methylene blue has unique color and sensitivity to most external stimuli and has been used as a model dye for studying the adsorption capacity of clay materials for decades.
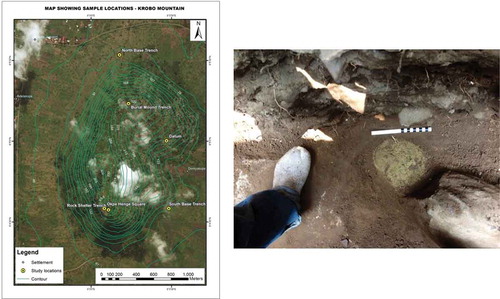
A clay sample recovered from an archaeological excavation on the Krobo Mountain (0° 3ʹ15.34”E, 6° 5ʹ1.86”N) in the Eastern Region of Ghana, coordinates shown in (Figure ) reveals probable adsorption, decolorization or degradation potential for organic dyes. The distinctively green clay sample as shown in (Figure ) recovered from a depth of approximately 240 cm below the surface, with charcoal samples yielded a calibrated AMS date of AD 1320–1350 at 2 sigma (Gblerkpor, Citation2006). The clay was situated on a bare rock and appeared to have been deliberately transported from elsewhere to the Krobo Mountain as shown in (Figure , GPS coordinate: N 06.08737, E 000.05397). The archaeology and ethnoarchaeology of the Krobos of Ghana have been the focus of several research project activities and the current work seeks to complement the archaeological interpretation of the artifacts (Gblerkpor, Citation2008). In Krobo, there are widespread local traditions about the use of clays for ceramics, healing, spiritual and symbolic practices. As a result, the motivation to collect and subject the clay sample to further laboratory examination in the hope of adding meaning to the material culture cannot be overstated. More so, the medical properties of clay minerals have been known by Ghanaians for centuries (Asamoah et al., Citation2018), and the biological implications of clay materials are also an area of intense interest due to their geophagy practices amongst Ghanaians especially pregnant women. These clays are widely used for healing purposes due to their perceived efficacy in curing multiple ailments including scorpion bites, chronic headaches, joint and other bodily pains, insanity and female infertility (Van Dongen et al., Citation2011). Furthermore, recent interest in the analysis of archaeological and ethnographic clays of Ghana (Tiburu et al., Citation2017; Van Dongen et al., Citation2011; Insoll, Citation2011) meant that field archaeologists must go beyond just detailed recording of the matrix as well as past cultural implications to paying greater attention to medicinal and other properties of clay materials from archaeological contexts.
First, as part of standard scientific research practices, which requires detailed analysis of the clay material to identify its identity, we subjected the material to various physical and chemical analyses including X-ray diffraction studies and energy-dispersive X-ray spectroscopy to identify the material structure and elemental composition, respectively. The material morphology as well as stability was determined by scanning electron microscopy and thermographic analysis, respectively. One of the major attributes of clays is their ability to remove adsorbed small organics especially colored dyes or toxins. Thus, using methylene blue as a substrate due to its unique blue coloration, we subjected the clay to adsorption studies to ascertain the adsorption capacity of the material and compared the adsorptive behavior to that of the calcined clay.
2. Materials and methods
The clay material was recovered at a depth of approximately 240 cm below the surface on a bare rock. The material was ground into powder using mortar and pestle and the powder sieved using a standard molecular sieve of cut-off 75 micron. The resulting clay was calcined at different temperatures (100°C to 600°C) for one hour. The raw (KG) and calcined clay (KGC) were used for this study. Methylene blue and absolute ethanol were obtained from Sigma–Aldrich (Boston, USA).
2.1. Decolorization studies
A known amount of the clay sample (raw and calcined) was washed with 70% ethanol solution for 30 minutes on a rotator and centrifuged. 40 mL of the supernatant was then used to dissolve 2 mg of solid methylene blue. The methylene blue solution was stirred continuously for an hour to ensure complete dissolution. The decolorization of methylene blue was examined by measuring absorbance at a wavelength of 662 nm using UV-VIS Spectrophotometer.
2.2. Characterization
2.2.1. Thermalgravimetric analysis (TGA)
TA Instrument Q500 (University Cambridge, Dept. of Materials Sciences and Metallurgy) was used to analyze the thermal behavior (TGA). The Analysis was performed under Nitrogen at the heating rate of 10°C/min.
2.2.2. Fourier transform infrared spectroscopy (FTIR)
The FTIR spectra were recorded with a Nicolet MAGNA-IR 750 Spectrometer (Nicolet Instrument Co., Madison, WI). All spectra were recorded from 4000 cm−1 to 500 cm−1 with 16 scans and spectral resolution of 4 cm−1. The sample holder was first cleaned using acetone and a prior to taken spectrum of the empty holder to ensure there were no contaminants that could interfere with readings. The sample was then loaded, and the spectrum obtained. Data processing was done to transform %transmittance into absorbance and the resulting data plotted against wavelength.
2.2.3. Energy-dispersive X-ray spectroscopy (EDX)
EDX spectra and the elemental composition of each sample were obtained at an accelerating voltage of 10 kV using a JEOL JSM-7100 F Field Emission Scanning Electron Microscope equipped with a Thermo Scientific UltraDry EDX detector. Each sample was sputter-coated with 3 nm of gold.
2.2.4. Scanning electron microscopy (SEM)
SEM micrographs were obtained at an accelerating voltage of 10 kV using a JEOL JSM-7100 F Field Emission Scanning Electron Microscope. Approximately 50 μm of colloidal graphite (Agar Scientific Ltd, Stansted, UK) was uniformly spread on an aluminium stub. Each powdered sample was then deposited on the sticky colloidal graphite and excess particles were removed by tapping the stub sideways followed by blowing with an aerosol duster. The deposited powder samples were then sputter-coated with gold.
2.2.5. X-ray diffraction (XRD)
XRD was performed with a Pan Analytical diffractometer using CuKα radiation at 2θ, scanning from 5 to 45 degrees in steps of 0.05 degrees, with a tube voltage of 45 kV and a current of 40 mA.
2.2.6. Equilibrium adsorption studies
The equilibrium adsorption studies were conducted by adding 40 ml of methylene blue solution (10–50 mg/L) to 200 mg of the calcined clay samples. Some amount of the methylene blue solution was sampled at various time intervals and centrifuged. The absorbance of the supernatant was measured using UV–Vis spectrophotometer (Shimadzu UV/Vis 1601 spectrophotometer, Japan) at maximum wavelength of 662 for methylene blue. The amount of methylene blue adsorbed (Qe (mg/g)) at time, t (mins) was calculated using the following equation:
where Co and Ce (mg/L) are the initial and equilibrium liquid-phase concentration of methylene blue, respectively; V (L) is the volume of the solution; and W (g) is the mass of the raw and calcined clays used for the adsorption.
2.2.7. Sorption kinetics
In this study, the pseudo-first-order, pseudo-second-order kinetic equations and the intra-particle diffusion model were applied to examine the adsorption kinetics of methylene blue on the clay (KGC).
2.2.7.1. Pseudo-first-order kinetics model
This type of sorption kinetic model assumes the rate of change of sorbate uptake with time is proportional to the difference in the saturation concentration and the amount of solid update with time. It is the most commonly applied rate of sorption equation in liquid-phase sorption. Generally, it is represented by EquationEquation (2)(2)
(2) below;
where qe and qt are the amounts of MB adsorbed onto the adsorbents (mg/g) at equilibrium and time t, respectively. k1 is the pseudo-first-order rate constant (min−1). The pseudo-first-order rate constant and the equilibrium capacity qe can be obtained from the slope and intercept, respectively (Hui et al., Citation2005).
2.2.7.2. Pseudo-second-order kinetic model
This type of sorption kinetics is based on the amount of adsorbed sorbate on the adsorbent. The chemisorption kinetics rate equation is represented by EquationEquation (3)(3)
(3) below;
where k2 is the pseudo-second-order rate constant. By plotting t/qt against t, the constants of the equation can be deduced. The intercept and the slope obtained from the graph can be used to determine the second-order rate constant k2 (mg g−1) and qe (mg g−1) (Hui et al., Citation2005).
2.2.7.3. Intra-particle diffusion model
Estimation of the rate-determining step is a vital factor to be included in any adsorption procedure. The adsorption process of the adsorbate molecules from the bulk liquid phase onto the adsorbent surface is assumed to involve three stages; (1) Mass transfer of the adsorbate molecules across the external boundary layer, (2) Intra-particle diffusion within the pores of the absorbent and (3) adsorption at a site on the surface. The intra-layer diffusion depends on several factors such as the physical properties of the adsorbent, the initial concentration of solution, the temperature, and the rotation speed in batch mode (Yousef et al., Citation2011).
The intra-particle diffusion model equation is given by Weber and Morris (EquationEquation 4(4)
(4) ):
where is the intra-particle diffusion rate constant and
is associated with the boundary layer thickness,
is the absorbed quantity of MB at time t (min).
A linear plot is often obtained if an intra-particle diffusion occurs. The rate-limiting process is as a result of intra-particle diffusion if the plot passes through the origin. Other mechanism is said to be contributing to the process if the plot does not meet the fore mentioned condition.
2.2.8. Adsorption isotherms
To improve the performance of an adsorption system for the adsorption of the cationic dye (MB), it is vital to adopt the most suitable correlation for the equilibrium curves. Diverse models have been divulged in the literature to depict the experimental data of adsorption isotherms. In this paper, two of the most commonly used equilibrium models, the Langmuir and Freundlich isotherms, were fitted with the experimental data to find the most suitable model. These models were employed in gas adsorption by microporous adsorbents before expanding to solute adsorption (Hui et al., 2005)
2.2.8.1. Langmuir model
The Langmuir model assumes that adsorption is monolayer and is dependent on the assumption that the adsorbent surface consists of active sites having a uniform energy and therefore, the adsorption energy is constant.
The linear form of Langmuir’s isotherm model is given by EquationEquation (5)(5)
(5) ;
where KL is the adsorption equilibrium constant (L mg−1), qo is the maximum monolayer adsorption capacity, and qe is the amount adsorbed on a unit mass of the adsorbent (mg g−1) at an equilibrium concentration of Ce (mg L−1) (Li et al., Citation2015).
Favorability of the Langmuir model can be expressed in terms of a dimensionless separation factor (RL). The equation of RL is defined as follows:
where Co is the highest initial solute concentration (mg L−1), KL is the Langmuir’s constant (L/mg). RL value gives the condition and state of the adsorption whether it is unfavorable (RL > 1), linear (RL = 1), favorable (0< RL<1) or irreversible (RL = 0) (Hor et al., Citation2016). To confirm the favorability of the absorption process in this study, the separation factor was calculated.
2.2.8.2. Freundlich model
In contrast to Langmuir, the Freundlich model assumes that the adsorbent surface energy is heterogenous (Yousef et al., Citation2011). It is also assumed that the stronger binding sites are occupied first and that the binding strength decreases with the increasing degree of site occupation. This model is mostly applied in the description of adsorption of inorganic and organic composition in solution (Hui et al., Citation2005).
The Freundlich adsorption isotherm expression is shown in the equation:
where KF (mg/g) is defined as the adsorption capacity of the absorbent. The 1/n value, which ranges between zero and one, is a dimensionless factor that measures the adsorption intensity. Ce and qe have already been defined.
2.3. Statistical analysis
Logit and ExpAssoc kinetic models were used to analyze the behavior of methylene blue when adsorbed by the calcined clay. R2 values were extracted from the two models to predict which model best describes the kinetic behavior.
3. Results and discussion
3.1. Pretreatment and characterization of the clay by FTIR, TGA, XRD and EDX
The map showing the location of the excavation site in the eastern part of the West African country, Ghana is shown in Figure . The green clay material was situated on 6° 4ʹ34.63”N, 0° 3ʹ6.29”E as shown in (Figure ) and was recovered on a bare rock at a depth of approximately 240 cm below the surface as shown in (Figure )
Figure 1. Map showing the Eastern Region in Ghana and the excavation site.
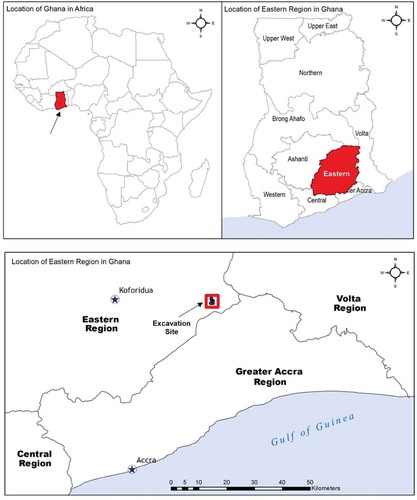
Figure 2. Map showing Klowem with the base area excavation units (South and North Trenches) and the hilltop excavation units. A ball clay placed on a bare rock of depth 240 cm below the Surface.
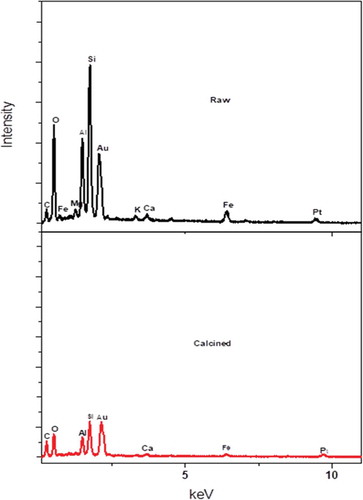
The clay material was subjected to pretreatment by grinding and sieving using 75-micron molecular sieve before calcining at different temperatures up to 600°C. This temperature was arrived at after subjecting the raw clay material to thermal analysis. The TGA of the clay sample is represented in (Figure ). The TGA analysis is used to determine weight loss of the clay sample with temperature. The nature of the plot shows a multistage decomposition. Two distinct decompositions were observed at ca. 90°C and 480°C. The mass loss at 90°C can be attributed to the decomposition of water molecules adsorbed onto the surface of the clay while the mass loss at 480°C can be attributed to the dihydroxylation of the clay sample (Nyankson et al., Citation2015). The mass loss could also include the decomposition of organic substances present in the clay. The total mass loss after heat treatment to 700°C was approximately 12.27%. No significant mass loss was observed after heat treatment beyond 600°C. The clay sample was therefore calcined up to a temperature of 600°C. The raw and calcined clays are shown in (Figure ,c) respectively. It was clearly observed that the green coloration from the raw clay was drastically transformed into brown colour after heating at 600 °C (Figure ) probably indicating the leakage or rearrangement of iron within the clay matrix. FTIR was used to identify the molecular fingerprints of the material before and after calcination (Figure ). The peak observed at 910 cm−1 can be attributed to deformation vibration of hydroxyl groups (Al-Al-OH), whereas the peak observed at 996 cm−1 represents the stretching vibration of T-O-T (where T is either Al or Si). The peak observed at 1634 cm−1 is due to deformation vibration of interlayer water (absorbed water). The peak observed at 3398 cm−1 also represents absorbed water. The peaks at 3695 cm−1 and 3625 cm−1 are due to the stretching vibration of inner surface hydroxyl groups. After calcination, most of the peaks disappeared. There was a shift of peak 3398 cm−1 to 3386 cm−1. Implying that some absorbed water was detected in the calcined sample. The peak at 1024 cm−1 represents Si-O tetrahedral stretching vibration (Nyankson et al., Citation2015). Further, other previously identified absorption peaks in the raw clay did not appear in the calcined clay. The clay material was analyzed by XRD and the results showed that the crystallinity of the raw clay (KGC) was enhanced upon calcination (KGC) as shown in (Figure ) and (Figure ). The peaks were identified upon matching with standard X-ray patterns and the additional peaks observed in (Figure ) were due to rearrangement of atoms in a more crystallized material with unique crystal reflections. It can be seen from the XRD peaks that, KGC is a complex mixture of pyrophyllite, quartz, kaolinite and Si. The pronounced peak [111 crystallographic plane at 2 theta value of ca. 28.45 degree) corresponds to Si. The SEM images of the clay samples before and after calcination at 600°C are shown in (Figure ) and (Figure ). Before calcination, the SEM images of the clay samples show granular overlays. However, after calcination, the morphology of the clay showed flaky sheets. This observed change in morphology is expected to influence the adsorption properties of the clay. Finally, as shown in Figure , the EDX analysis revealed several major peaks including Si, Al, Zr, Fe, Au and Ca with a Si/Al = 2.24. Gold was used for the sputter coating and hence the Au was detected by the EDX.
Figure 3. (a) TGA of KGC conducted in Nitrogen atmosphere, (b) FTIR of raw and calcined KGC (c)The calcined clay material at 600 deg revealing brownish coloration and (d) showing the colour of the raw clay.
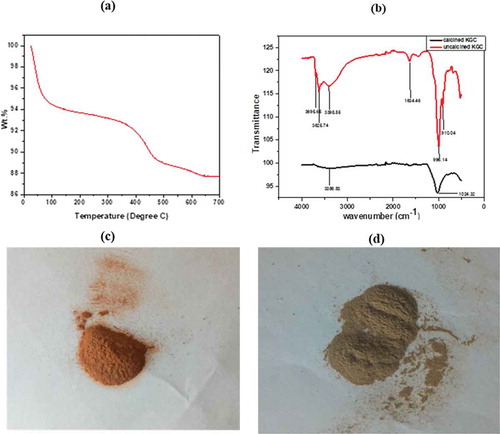
Figure 4. XRD patterns of the (a) raw clay at 25°C compared to the (b) calcined clay at 600°C. Additional peaks were observed in the calcined peaks probably showing an indication of a more crystalline material. (P: pyrophyllite, Q: Quartz, K: kaolinite). SEM of the raw clay at 25°C (c) compared to the calcined clay at 600°C (d).
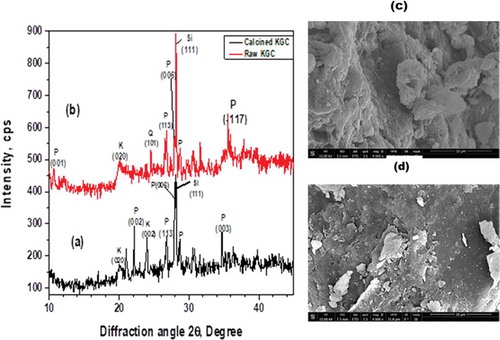
Figure 5. EDX analysis of the clay material showing the major elements and their corresponding intensities for the raw and calcined clay.
3.2. UV-VIS Spectrophotometer analysis of methylene blue in the raw and pretreated clay at 600°C
The distinct green color in the clay compared to the environment the material was found appeared to indicate that the clay was deliberately transported from elsewhere to the Krobo Mountain for use in medical as well as other applications including adsorption of impurities and dyes from food or clothes. The clay was therefore exposed to methylene blue to determine its adsorbing or decolorization characteristics. There was instant decolorization of methylene blue in the supernatant (obtained by washing the KGC with 70% ethanol solution) of the raw clay materials as shown in (Figure ). Subsequent washes up to the fifth wash resulted in gradual decrease in decolorization probably due to the depletion of certain organic substances responsible for decolorization of the dye. The material was then subjected to heat treatment up to 600°C to remove all organic matter. The calcined material from 100°C to 300°C showed instant decolorization like what was exhibited by the raw clay whereas, the pretreated material at 400°C showed gradual decolorization up to 30 minutes of dissolution in the supernatant. As shown in (Figure ), the clay pretreated at 600°C could not decolorize the methylene blue. The original color of the clay also changed from green to brown at 600°C probably due to iron leakage from the material matrix.
From Table , there was a 12% weight loss after the pretreatment at 600°C. Since there was no noticeable decolorization in the methylene blue in the pretreated clay at 600°C, it was assumed that the organic substances that decomposed or were lost (12 wt. % loss recorded in the TGA) during the thermal treatment were responsible for the decolorization.
Figure 6. UV-VIS spectrophotometry analysis of methylene blue in 70 percent supernatant of ethanol from the raw clay material. (a) The corresponding absorption is recorded for 5 cycles of supernatant dissolution of the methylene blue. (b) Comparison of the adsorption of methylene blue when the supernatant from the raw and calcined clays are used to dissolve the dye, (c) UV-vis spectra for the adsorption of methylene blue by the raw clay sample and (d) an adsorption of methylene blue by the calcined clay at 600°C as a function of time at different concentrations.
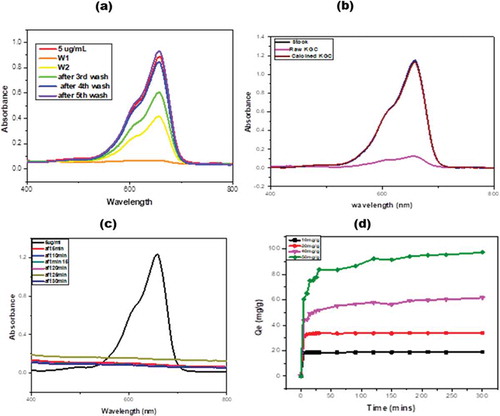
Table 1. The effect of change in methylene blue concentration after 300 minutes on the Calcined Clay
3.3. Methylene blue adsorption studies in the pretreated clay at 600°C
Adsorption studies were conducted using methylene blue (MB), the raw (KGC) and calcined clay (KGC). The removal of the methylene blue from solution after contacting with the raw clay was instant as can be seen in (Figure ). All the methylene blue was removed within five minutes upon contacting with the raw clay. However, a gradual adsorption of methylene blue on the calcined clay sample was observed. The suggestion that the removal of MB by KGC was due to a combined effect of decolorization and adsorption while that of KGC may be due to adsorption alone. The adsorption equilibrium and kinetic studies were therefore conducted using the calcined clay (KGC). The methylene blue was adsorbed by the calcined clay over fivehours to study the kinetics of dye uptake. As shown in (Figure ), the adsorption was conducted at four different methylene blue concentrations to determine the lower and upper limit adsorption capacity of the clay. The equilibrium adsorption capacities were 18.8 mg/g, 33.9 mg/g, 61.5 mg/g and 97.2 mg/g for 10 mg/L, 20 mg/L, 40 mg/L and 50 mg/L, respectively, all obtained at room temperature as shown in Table .
Table 2. Results showing the concentration of methylene blue in the clays and percent decolorization of the dye as well as the weight loss recorded at 25°C and 600°C
Two selected adsorbing isotherms were used to determine methylene blue uptake when the dye has reached equilibrium. The Logit and ExpAssoc kinetic models were considered because the latter involves a two-phase medium with slow and fast exponential decay process. This model is also applicable whenever the rate at which a reaction occurs is proportional to the amount of reactant remaining. Considering this research and model, it can be stated that the rate of adsorption of methylene blue by the clay is proportional to the amount of methylene blue left in solution.
From (Figure ), it can be observed that the rate of adsorption of methylene blue by the clay is much higher in the first 30 minutes and fairly constant afterwards. At the minimum methylene blue concentration (10 mg/L) used for this study, the R2 value from the Logit model compared with that of the ExpAssoc model was R2 = 0.9999 and 0.9998, respectively. That is at lower methylene blue concentration, the data is best fitted with both models. However, at high concentration (50 mg/L) the Logit model performed better resulting in R2 values of 0.9930 compared to 0.9815 for the ExpAssoc model. Generally, the amount of the dye adsorbed increased with increasing time and MB initial concentration.
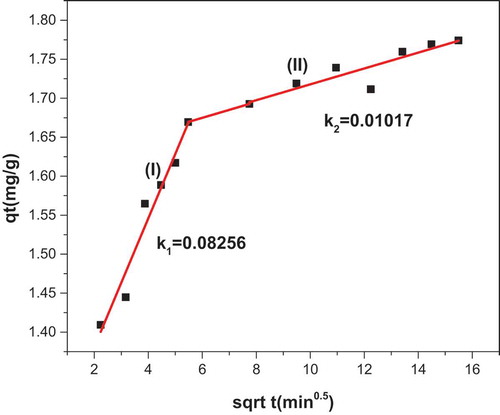
From this study, the R2 values obtained for the pseudo-first-order kinetics (Figure ) were very low when compared with the R2 value of the pseudo-second-order kinetic model (Figure ). The R2 values found to be 0.4309 and 0.8225, for pseudo-first-order and pseudo-second-order kinetics, respectively. This indicates that the adsorption kinetics probably followed the pseudo-second-order kinetics. Implying that the adsorption of methylene blue on KGC occurred by chemisorption. The adsorption equilibrium isotherms were examined using the Langmuir and Freundlich models. The Freundlich isotherm plot is represented in the (Figure ) and the Freundlich constant is 51.04. The R2 value of this model was found to be 0.9911 indicating that it fits the experimental data better than the Langmuir’s model (R2 = 0.9794). The (n > 1) value which is 2.0678 indicates a favorable adsorption condition. The result for the intra-particle diffusion model is presented in (Figure ). The intra-particle model describes the rate-controlling steps of the adsorption process in two stages. The first stage (I) with steeper slope (0.08256) represents a faster adsorption process due to the electrostatic interaction between the adsorbate and the adsorbent. This confirms that the adsorption process is chemisorption (pseudo-second-order kinetics). The second stage (II) with slope
(0.01017) represents a more gradual diffusion process indicating that more of the active sites and pores are being occupied by the dye molecule thereby leaving smaller number of active sites for effective adsorption.
Figure 7. (a) The logistic and (b) ExpAssoc fit adsorption profile of methylene blue by calcined KGC paricles at different time intervals
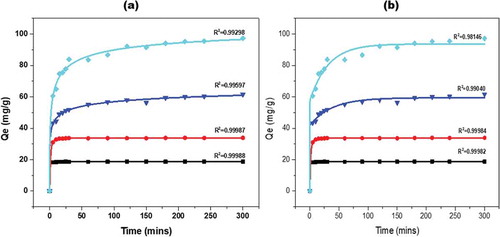
Figure 8. (a) Linearized Langmuir and Freundlich (b) isotherm, (c) Linearized pseudo-first-order and (d) pseudo-second-order kinetic model for methylene blue adsorption onto KGC.
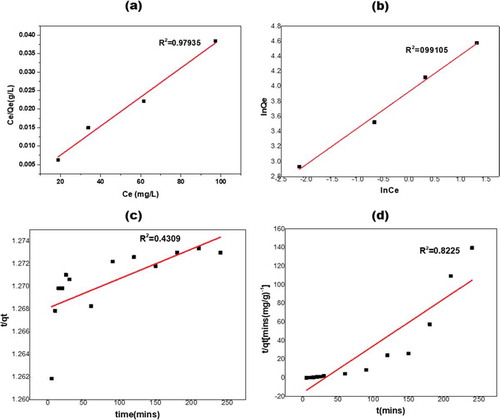
Figure 9. Linearized inter-particle diffusion model for methylene blue adsorption onto KGC.
The results from the adsorption equilibrium and kinetic studies are presented in Table .
Figure 10. Absorption spectrum of concentration 50 mg/L (a) and 10 mg/L (b) showing the adsorption of MB onto KGC.
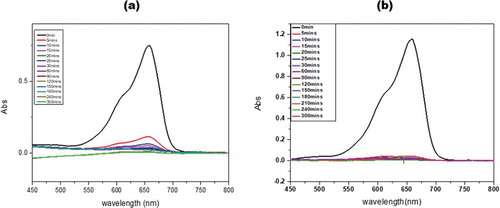
Table 3. Adsorption isotherm model parameters for the adsorption of MB onto KGC
3.4. Discussion
It is well established that kaolin and montmorillonite clays are abundant in nature. The characterization data obtained from this work, however, suggest that the clay material might be a pyrophyllite ore with traces of Quartz, kaolinite and Si. Pyrophyllite has been used as materials for the removal of insecticides or toxins from the intestinal tracts after mixing with activated charcoal (Bessac & Hoyau, Citation2013). Thus, it is tempting to suggest that the clay material might be transported to the current location due to its medical applications. This assertion is strongly corroborated with the fact that the decolorization of the methylene blue was instantaneous indicating that the material was modified by an organic substance to enhance its decolorization efficiency. While several studies on the decolorization of methylene blue have been conducted using different types of clay, the ability of this clay to decolorize methylene blue instantaneously even after heat treatment at high temperatures reveals unique findings in this work. The biphasic behavior characterized by a decolorization potential of the raw clay and both the Logit and exponential kinetic adsorptive behavior towards methylene blue when calcined probably will encourage reverse engineering to redesign the structure of the material using the precursor molecules identified in this study for various biomedical application.
An intriguing observation was that the organic substances present in the clay were insensitive to temperature treatment up to 400°C and could be only be destroyed beyond 400°C suggesting that the organic materials present can withstand temperatures up to 400°C. This may include microorganisms (Aspergilla and Penicillia) that are very resistant to heat treatment. The persistent green coloration of the clay at temperatures below 400°C may be attributed to the presence of the green mold, Penicillium and the yellow-green strain of Aspergillus in the clay. The weight loss in detected in the TGA analysis at temperatures above ca. 480°C may be due to the dihydroxylation of the KGC as well as the decomposition of the organic substances present in the KGC. This explains why the potency of KGC in decolorization MB was degraded after heat treatment above 300°C.
Interestingly, the pre-treatment changed the adsorption behavior of the material. There was exponential adsorption kinetics which was not observed in the raw clay. This might be due to the rearrangement of the material architecture as observed by many studies with respect to pyrophyllite which indicates that their structure changes significantly leading to enhanced adsorption behavior. It was observed from the SEM images that the morphology of the clay changed from granular overlays to flaky sheets upon calcination. This may influence the adsorption behavior of the clay. In addition, the instantaneous decolorization of MB after contacting it with the raw clay suggests that the decrease in MB concentration may be due to decolorization by the organic substances present as well as adsorption by the clay.
From this study, the R2 values obtained for the pseudo-first-order kinetics were very low when compared with that of the pseudo-second-order kinetics. This implies that the adsorption of the methylene blue by the KGC occurred through chemisorption. Most clay samples possess negatively charged surface when in solution (at MB pH of 9). Since methylene blue is cationic, it is likely that the positively charged methylene blue interacted electrostatically with the negatively charged clay molecules. As evident from the UV-vis spectra reported in (Figure ), there was a sharp and instantaneous adsorption of MB by the KGC after the first five minutes followed by a steady decrease in adsorption afterwards, which is a typical characteristic of a pseudo-second-order kinetic adsorption. This was further confirmed from the intra-particle diffusion model that showed a much steeper slope at the initial stages of the adsorption process. The much steep (part 1) of the intra-particle graph in Figure indicates an external diffusion which in turn suggests a fast process of adsorption as a result of electrostatic interaction between the sorbate and sorbent; whereas the second portion of the graph represents the diffusion into the adsorbent particles, representing a steady process of diffusion suggesting that more of the active sites of the sorbent had been occupied by the sorbate leaving less active site hence the less steeper slope observed (Rida et al., Citation2013). Though other authors have proposed the use of different spectroscopic techniques such as Raman spectroscopy, XPS and XAS to understand the binding and adsorption of dyes on surfaces (Huang et al., Citation2011; Johnson et al., Citation2014), the authors could not use these techniques due to their unavailability at our University. This study has however revealed another dimension and demonstrated further clay properties that can be exploited to study biological activities. The results from the study reveal the potential application of the clay deposit at Krobo (Eastern Region of Ghana) in developing water treatment technologies with enhanced decolorization and adsorption of water-soluble cationic dyes. In addition, this material can be exploited for their potential application in adsorbing toxins as well as in the entrapment of greenhouse gas emissions (Azmi & Aziz, Citation2019) and may also have potential application in drug delivery.
4. Conclusion
This study lays out that the supernatant obtained after washing the raw and calcined clay with 70% ethanol was effective in decolorizing MB. The decolorizing potential of the supernatant was dependent on the calcination temperature of KGC and was in efficient at calcination temperature of 600°C. The decolorizing of MB was attributed to the presence of organic substances in the clay that were washed into the supernatant. After calcination, the clay (KGC) was effective in adsorbing MB from aqueous solutions. The result also showed that the adsorption of MB by the clay was largely dependent on the initial concentration of the MB and contacting time. The sorption kinetics of MB by the clay could be best delineated by pseudo-second-order model, suggesting a chemisorption process. Adsorption isotherms of MB could be best modelled by Freundlich equation. In addition, the entire adsorption process was controlled by surface and pore diffusion. XRD revealed that the clay sample is made up of pyrophyllite, kaolinite, quartz and Si. The archaeological-discovered clay may be an alternative to more costly sorbents for the treatment of aqueous wastes containing cationic water-soluble dyes.
Acknowledgements
The researchers acknowledge the Department of Materials Science and Metallurgy, the University of Cambridge for running the TGA, SEM and XRD experiments. We thank West Africa Center for Cell Biology of Infectious Pathogens (WACCBIP) for supporting this work. We also thank Mr. Solomon Kingsley Katu for assisting in data collection. The work received support from Wellcome Trust (WACCBIP DELTAS grant #; 107755/Z/15/Z) and the World Bank Africa Centre of Excellence project (ACE02-WACCBIP).
Additional information
Funding
Notes on contributors
Elvis K. Tiburu
Dr Emmanuel Nyankson holds a BSc in Chemical Engineering from the Kwame Nkrumah University of Science and Technology, Ghana, MSc in Materials Science and Engineering from the Norwegian University of Science and Technology, Norway, and PhD in Chemical Engineering from Auburn University, USA. He is a Commonwealth Early Academic Fellow. He is also a fellow of the Cambridge-Africa Alborada Trust and CAPREx Fellowship. His research is focused on the development of novel materials for water purification, biomedical, environmental remediation and oil and gas applications. The material presented in this paper has a wider application in water treatment technologies and in biomedical applications.
References
- Asamoah, R. B., Nyankson, E., Annan, E., Agyei-Tuffour, B., Efavi, J. K., Kan-Dapaah, K., Apalangya, V. A., Damoah, L. N. W., Dodoo-Arhin, D., Tiburu, E. K., Kwofie, S. K., Onwona-Agyeman, B., & Yaya, A. (2018). Industrial applications of clay materials from Ghana (a review). Oriental Journal of Chemistry, 34(4), 1719–18. https://doi.org/10.13005/ojc/340403
- Azmi, A. A., & Aziz, M. A. A. (2019). Mesoporous adsorbent for CO2 capture application under mild condition: A review. The Journal of Environmental Chemical Engineering, 7(2), 103022. https://doi.org/10.1016/j.jece.2019.103022
- Bennani-Karim, A., Mounir, A., Hachkar, B., & Bakasse, M. (2011). Adsorption of malachite green dye onto raw Moroccan clay in batch and dynamic system. Canadian Journal of Civil Engineering, 2, 5–13.
- Beshara, A., & Cheeseman, C. R. (2014). Reuse of spent bleaching earth by polymerisation of residual organics. Waste Management, 34(10), 1770–1774. https://doi.org/10.1016/j.wasman.2014.04.021
- Bessac, F., & Hoyau, S. (2013). Pesticide interaction with environmentally important cations: A theoretical study of atrazine in interaction with two Ca2+ cations. Computational and Theoretical Chemistry, 1022, 6–13. https://doi.org/10.1016/j.comptc.2013.06.025
- Cheng, L., Flavigny, R. M. G., Hossain, M. I., Charles, W., & Cord-Ruwisch, R. (2018). Proof of concept of wastewater treatment via passive aeration SND using a novel zeolite amended biofilm reactor. Water Science and Technology, 78(10), 2204–2213. https://doi.org/10.2166/wst.2018.504
- Christopoulou-Aletra, H., Papavramidou, N., & Pozzilli, P. (2006). Obesity in the Neolithic era: A Greek female figurine. Obesity Surgery, 16(8), 1112–1114. https://doi.org/10.1381/096089206778026334
- Daou, I., Zegaoui, O., & Amachrouq, A. (2017). Study of the effect of an acid treatment of a natural Moroccan bentonite on its physicochemical and adsorption properties. Water Science and Technology, 75(5), 1098–1117. https://doi.org/10.2166/wst.2016.602
- Detellier, C. (2018). Functional Kaolinite. The Chemical Record, 18(7–8), 868–877. https://doi.org/10.1002/tcr.201700072
- Gblerkpor, W. N. (2006). An Archaeological Investigation of the Krobo Mountain Settlement Site. Nyame Akuma Bulletin, 65, 18–23.
- Gblerkpor, W. N. (2008). Current archaeological research at the Krobo Mountain Site, Ghana. Cambridge Monographs in African Archaeology, 74, 71–84.
- Hor, K. Y., Chee, J. M. C., Chong, M. N., Jin, B., Saint, C., Poh, P. E., & Aryal, R. (2016). Evaluation of physicochemical methods in enhancing the adsorption performance of natural zeolite as low-cost adsorbent of methylene blue dye from wastewater. Journal of Cleaner Production, 118, 197–209. https://doi.org/10.1016/j.jclepro.2016.01.056
- Huang, C., Wang, R. K., Wong, B. M., McGee, D. J., Léonard, F., Kim, Y. J., Johnson, K. F., Arnold, M. S., Eriksson, M. A., & Gopalan, P. (2011). Spectroscopic properties of nanotube–chromophore hybrids. ACS Nano, 5(10), 7767–7774. https://doi.org/10.1021/nn202725g
- Hui, K. S., Chao, C. Y. H., & Kot, S. C. (2005). Removal of mixed heavy metal ions in wastewater by zeolite 4A and residual products from recycled coal fly ash. Journal of Hazardous Materials, 127(1–3), 89–101. https://doi.org/10.1016/j.jhazmat.2005.06.027
- Insoll, T. (2009). Materializing performance and ritual: Decoding the archaeology of movement in Tallensi shrines in northern Ghana. Material Religion, 5(3), 288–310. https://doi.org/10.2752/175183409X12550007729905
- Insoll, T. (2011). Introduction. Shrines, substances and medicine in sub-Saharan Africa: Archaeological, anthropological, and historical perspectives. Anthropology & Medicine, 18(2), 145–166. https://doi.org/10.1080/13648470.2011.591193
- Johnson, P. S., Huang, C., Myungwoong Kim, M., Safron, N. S., Arnold, M. S., B M., W., Gopalan, P., & Himpsel, F. J. (2014). Orientation of a monolayer of dipolar molecules on graphene from X-ray absorption spectroscopy. Langmuir, 30(9), 2559–2565. https://doi.org/10.1021/la500183b
- Kenawy, E.-R., Ghfar, A. A., Wabaidur, S. M., Khan, M. A., Siddiqui, M. R., Alothman, Z. A., Alqadami, A. A., & Hamid, M. (2018). Cetyltrimethylammonium bromide intercalated and branchedpolyhydroxystyrene functionalized montmorillonite clay to sequester cationic dyes. Journal of Environmental Management, 219, 285–293. https://doi.org/10.1016/j.jenvman.2018.04.121
- Khasri, A., & Ahmad, M. A. (2018). Adsorption of basic and reactive dyes from aqueous solution onto Intsia bijuga sawdust-based activated carbon: Batch and column study. Environmental Science and Pollution Research, 25(31), 31508–31519. https://doi.org/10.1007/s11356-018-3046-3
- Li, C., Zhong, H., Wang, S., Xue, J., & Zhang, Z. (2015). Removal of basic dye (methylene blue) from aqueous solution using zeolite synthesized from electrolytic manganese residue. Journal of Industrial and Engineering Chemistry, 23, 344–352. https://doi.org/10.1016/j.jiec.2014.08.038
- Ming, H., Lara Pizarro, A. V., & Park, E. Y. (2003). Application of waste activated bleaching earth containing rapeseed oil on riboflavin production in the culture of Ashbya gossypii. Biotechnology Progress, 19(2), 410–417. https://doi.org/10.1021/bp0257325
- Nyankson, E., Olasehinde, O., John, V. T., & Gupta, R. B. (2015). Surfactant-loaded halloysite clay nanotube dispersants for crude oil spill remediation. Industrial & Engineering Chemistry Research, 54(38), 9328–9341. https://doi.org/10.1021/acs.iecr.5b02032
- Oussalah, B., Boukerroui, A., Aichour, A., & Djellouli, A. (2018). Cationic and anionic dyes removal by low-cost hybrid alginate/natural bentonite composite beads: Adsorption and reusability studies. International Journal of Biological Macromolecules, 124, 854–862. https://doi.org/10.1016/j.ijbiomac.2018.11.197
- Paineau, E., Dozov, I., Philippe, A.-M., Bihannic, I., Meneau, F., Christophe Baravian, Laurent, C., Michot, L. J., & Davidson, P. (2012). In-situ SAXS study of aqueous clay suspensions submitted to alternating current electric fields. The Journal of Physical Chemistry B, 116(45), 13516–13524. https://doi.org/10.1021/jp3064728
- Rida, K., Bouraoui, S., & Hadnine, S. (2013). Adsorption of methylene blue from aqueous solution by kaolin and zeolite. Applied Clay Science, 83-84, 99–105. https://doi.org/10.1016/j.clay.2013.08.015
- Tiburu, E. K., Kankpeyeng, B. W., Nkumbaan, S. N., Salifu, A., & Zhuang, J. Q. (2017). Novel nanocrystal clay materials with potential bone cells growth enhancement or inhibition characteristics in vitro. Journal of Biomimetics, Biomaterials and Biomedical Engineering, 30, 45–60. https://doi.org/10.4028/www.scientific.net/JBBBE.30.45
- Udomkun, P., Innawong, B., Siasakul, C., & Okafor, C. (2018). Utilization of mixed adsorbents to extend frying oil life cycle in poultry processing. Food Chemistry, 248, 225–229. https://doi.org/10.1016/j.foodchem.2017.12.070
- Vaculíková, L., Plevová, E., & Ritz, M. (2019). Characterization of montmorillonites by infrared and raman spectroscopy for preparation of polymer-clay nanocomposites. Journal of Nanoscience and Nanotechnology, 19(5), 2775–2781. https://doi.org/10.1166/jnn.2019.15877
- Van Dongen, B. E., Fraser, S. E., & Insoll, T. (2011). The composition and origin of Ghana medicine clays. Anthropology & Medicine, 18(2), 285–302. https://doi.org/10.1080/13648470.2011.591204
- Vanamudan, A., Bandwala, K., & Pamidimukkala, P. (2014). Adsorption property of Rhodamine 6G onto chitosan-g-(N-vinyl pyrrolidone)/montmorillonite composite. International Journal of Biological Macromolecules, 69, 506–513. https://doi.org/10.1016/j.ijbiomac.2014.06.012
- Yang, B., Liu, Y., Liang, Q., Chen, M., Ma, L., Lingli, L., Liu, Q., Tu, W., Lan, D., & Chen, Y. (2019). Evaluation of activated carbon synthesized by one-stage and two-stage co-pyrolysis from sludge and coconut shell. Ecotoxicology and Environmental Safety, 170, 722–731. https://doi.org/10.1016/j.ecoenv.2018.11.130
- Yousef, R. I., El-Eswed, B., & Al-Muhtaseb, A. H. (2011). Adsorption characteristics of natural zeolites as solid adsorbents for phenol removal from aqueous solutions: Kinetics, mechanism, and thermodynamics studies. Chemical Engineering Journal, 171(3), 1143–1149. https://doi.org/10.1016/j.cej.2011.05.012
- Zhou, W., Rajic, L., Chen, L., Kou, K., Ding, Y., Meng, X., Wang, Y., Mulaw, B., Gao, J., Qin, Y., & Alshawabkeh, A. N. (2019). Activated carbon as effective cathode material in iron-free Electro-Fenton process: Integrated H 2 O 2 electrogeneration, activation, and pollutants adsorption. Electrochimica Acta, 296, 317–326. https://doi.org/10.1016/j.electacta.2018.11.052