
 ?Mathematical formulae have been encoded as MathML and are displayed in this HTML version using MathJax in order to improve their display. Uncheck the box to turn MathJax off. This feature requires Javascript. Click on a formula to zoom.
Abstract
Background
Using SaTScan™ Geographical Information Systems (GIS), spatial cluster analysis was used to examine spatial trends and identify high-risk clusters of Coronavirus 2019 (COVID-19) incidence in response to changing levels of public health intervention phases including international and state border closures, statewide vaccination coverage, and masking requirements.
Methods
Changes in COVID-19 incidence were mapped at the statistical area 2 (SA2) level using a GIS and spatial cluster analysis was performed using SaTScan™ to identify most-likely clusters (MLCs) during intervention phases.
Results
Over the study period, significant high-risk clusters were identified in Brisbane city (relative risk = 30.83), the southeast region (RR = 1.71) and moving to Far North Queensland (FNQ) (RR = 2.64). For masking levels, cluster locations were similar, with MLC in phase 1 in the southeast region (RR = 2.56) spreading to FNQ in phase 2 (RR = 2.22) and phase 3 (RR = 2.64). All p values <.0001.
Conclusions
Movement restrictions in the form of state and international border closures were highly effective in delaying the introduction of COVID-19 into Queensland, with very low levels of transmission prior to border reopening while mandatory masking may have played a role in decreasing transmission through behavioural changes. Early clusters were in highly populated regions, as restrictions eased clusters were identified in regions more likely to be rural or remote, with higher numbers of Indigenous people, lower vaccination coverage or lower socioeconomic status.
Introduction
Following the detection of the highly transmissible coronavirus disease 2019 (COVID-19) in China in December 2019, and the eventual pandemic declaration by the World Health Organisation on 11 March 2020 [Citation1], the Australian Federal Government implemented a range of preventative measures. The most significant of these was the closure of international borders and barring entry of potentially COVID-19-infected travellers into Australia from March 2020 until late 2021. At the state government level, a range of strict suppression and elimination strategies were implemented, with non-pharmaceutical interventions (NPIs) including state level border closures for domestic travellers alongside test, trace, isolate and quarantine (TTIQ) strategies and social distancing, business and school closures and hygiene measures to prevent sustained local transmission and outbreaks [Citation2]. This approach aimed to prevent the high levels of mortality and healthcare overburden observed globally, to protect vulnerable populations while vaccines were developed and community immunisation levels lagged due to supply and distribution issues [Citation3]. In the state of Queensland, targeted responses included state border closures during outbreaks [Citation4], with varying levels of NPIs including stay-at-home orders, physical distancing and masking, with high levels of community testing to detect and contain outbreaks [Citation5]. NPIs were coordinated at the state level, and implemented at the state level with some additional measures (lockdowns, stay at home, workplace and school closures) during limited or isolated outbreaks occurring until the borders reopened, the majority of these occurred in the highly populated southeast of the state. These interventions were highly effective in preventing the introduction and sustained transmission of severe acute respiratory syndrome coronavirus 2 (SARS-CoV-2) [Citation6], though periodic outbreaks occurred as highly transmissible variants emerged [Citation7] until the decision was made to reopen international and state borders and remove restrictions in late 2021 [Citation8] ().
Figure 1. Timeline of changes in vaccination coverage, border changes and masking requirements with the number of daily COVID-19 case notifications (orange) with seven day moving average and number of SA2s with recorded cases (blue).
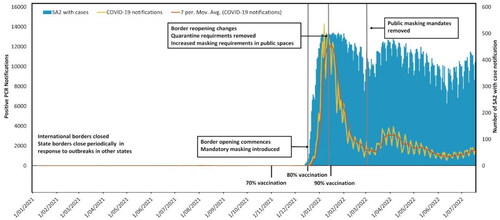
Previous research based on outbreak modelling supported the use of NPIs to prevent major outbreaks while community vaccination levels were low [Citation9], informing the decision to link community vaccination levels to the reopening of borders and transitioning to widespread transmission in Queensland. An optimal population vaccination coverage threshold of 80% of the population (aged over 16 years, a full course of approved vaccines) was determined to reduce widespread transmission risk and reduce hospitalisations and deaths [Citation10,Citation11]. Once population vaccination thresholds were reached, staged state and international border reopening was initiated, and mandatory mask-wearing was introduced with varying requirements (see ). Several new variants were detected during this time, starting with B.1.617.2 (Delta), replaced with B1.1.529 (Omicron) and sub-lineages BA.1, BA.2, BA.4 and BA5 [Citation12].
Table 1. Phase details of Queensland government state and international border closures and restrictions based on population vaccination targets of 70%, 80% and 90% and recommended masking requirements.
Spatial analysis is an important method for exploring infectious disease transmission dynamics, for determining high-risk clusters and patterns of transmission spatially [Citation13–15]. Spatial scan statistics in particular are used to detect and evaluate geographical disease clusters and have been used to identify vulnerable populations or regions that may be at increased risk of COVID-19 [Citation16–18], and evaluate public health interventions allowing targeted and timely responses and implementation of NPIs [Citation19,Citation20]. This information is important both within the context of the COVID-19 pandemic, but also in response to emerging infectious diseases and future pandemics.
While there has been significant work globally on the effect of vaccination and NPIs [Citation21–24] in modifying COVID-19 transmission, there is limited research on the impacts of NPIs and vaccination coverage on spatial patterns of COVID-19 incidence in Australia in relation to these factors. Throughout the pandemic Australia was in a unique position, particularly in the state of Queensland, with very high levels of NPIs and testing availability, and very few COVID-19 infections in the state until the majority of the population was vaccinated. Many early studies of COVID-19 suffer from low data quality due to testing availability, short study periods limited to short waves or outbreaks, this study area allows insight into a unique situation with comparatively good quality surveillance data. This study aims to analyse and explore the spatial patterns of COVID-19 in Queensland, Australia, in relation to three main interventions, vaccination coverage, border closures and masking requirements: (1) visualising incidence rates by statistical area 2 (SA2) region using locally acquired cases from Queensland Health over different intervention phases. (2) Exploring the changes in the rate of transmission by intervention phase and (3) detecting high-risk regions for COVID-19 transmission in Queensland using spatial cluster analysis and identifying significant clusters at different intervention phases.
Materials and methods
Study design and data collection
In this ecological study, we used spatial cluster analysis methodology to investigate the spatial distribution and potential clustering of COVID-19 across Queensland, Australia in relation to public health interventions, using SaTScan spatial cluster analysis to identify and assess significant spatial patterns.
COVID-19 notification data were obtained from the Queensland Health Open Data Portal [Citation25] for the period of 1 January 2021 through to 19 July 2022 for all laboratory-confirmed cases. All provided data were validated and standardised to meet COVID-19 diagnostic definitions, with positive cases identified with polymerase chain reaction (PCR) test or serology testing for antibodies to SARS-CoV-2 [Citation26], and reported with the date of test, source of transmission and SA2 region based on the usual residential address. Cases with missing or null SA2 and interstate or overseas acquired cases were excluded from this analysis. As testing policies changed throughout 2022, with unvalidated self-reported rapid tests and decreased PCR test availability, the study period concludes in July to avoid reduction in data quality.
SA2 shape files with estimated resident population data from 2021 were collected from the Australian Bureau of Statistics (ABS) along with numbers of population identifying as Aboriginal and/or Torres Strait Islander at the SA2 level. Vaccination data (percentage of the population aged over 16 years) by statistical area level 3 (SA3) was collected from the Australian Government Department of Health and Aged Care. SA2 regions are designed to represent communities interacting socially and economically aligning with suburb levels while SA3s are larger areas comprised of spatially related SA2s, encompassing communities, cities or regions [Citation27]. This study was approved by the Queensland University of Technology Human Research Ethics Committee (UHREC2021000067). This study used de-identified aggregated data; therefore, individual consent was not required. All methods were performed following relevant guidelines and regulations.
Study area
Queensland is the third most populated state in Australia, with over 5.24 million residents, and the second largest by area, covering over 1.85 million km2. The study area included a total of 528 SA2 locations, with 14 of these unpopulated or low population (<200 residents). The majority of the population of Queensland resides in South-East Queensland (SEQ), with approximately 3.8 million residents in the region [Citation28]. To compare COVID-19 incidence over varying intervention lengths, incidence per 100,000 persons over 100 days was calculated for each SA2. The two main interventions of border closures and masking requirements were defined as follows: pre-border opening phase 1 (346 days) from 1 January 2021 to 12 December 2021, phase 2 (34 days) from 80% vaccination coverage 13 December 2021 to 15 January 2022, and finally phase 3 (185 days) when all border restrictions were removed from 15 January 2022 to end of the study period on 19 July 2022. Domestic is defined in this study as state or territory borders, and restrictions applied to interstate travellers with road and airport closures in place to prevent movement between states during outbreaks. State-wide masking mandates were introduced as the borders reopened, cases before this time were limited. Level 1 of masking requirements began on 13th December to 1st January (20 days), level 2 (62 days) from 2 January 2022 to 4 March 2022 and level 3 (137 days) compulsory mask wearing ends from 4th March to the study end (see ) [Citation29]. As vaccination thresholds (70, 80 and 90%) were linked to border re-opening phases temporally, spatial cluster analysis for these intervention phases were not analysed separately. Variations in vaccination coverage over time were described spatially at the SA3 level; SA2 outliers with low or zero population were excluded from analysis.
Statistical analysis
High-risk clusters or most-likely clusters (MLCs) for each intervention phase were identified using SaTScan software, (Version 10.1; Martin Kulldorff, Boston, MA) [Citation30] by fitting a purely spatial model with the assumption COVID-19 cases follow Poisson’s distribution according to the SA2 population [Citation31,Citation32]. Spatial cluster analysis identifies statistically significant clusters based on the likelihood ratio to measure of how observed data deviate from expected data under spatial randomness with Monte Carlo testing (999 simulations), to assess statistical significance and critical values for cluster likelihood. This method compares numbers of observed and expected cases within a circular window to determine relative risk (RR) in a spatial context, based on the longitude and latitude centroid of each SA2 region, using daily COVID-19 notifications and residential population for each SA2. Most-likely cluster are the geographically related regions that have the highest likelihood ratio, with secondary clusters ranked in descending order of likelihood ratio, all reported clusters significant at p < .05. The expected number of COVID-19 cases is based on the assumption of Poisson’s distribution according to the population of the region. The null hypothesis H0 states the model reflects constant risk with an intensity or spatial randomness; the alternative hypothesis HA shows that the number of observed cases exceeds expected cases, or spatial clustering, is derived from the following equation [Citation32]:
(1)
(1)
where
is the expected number of COVID-19 cases, p represents the population in a SA2 region, C represents COVID-19 cases in the study area and P represents total estimated population within the study area. Likelihood ratio test was performed to evaluate spatial randomness versus clustering, identifying scanning windows with an elevated risk inside compared with the outside for COVID-19, defined by the following equation [Citation30]:
(2)
(2)
with L(Z) the likelihood function for cylinder Z and L0 the likelihood function for H0; nZ the number of COVID-19 cases in a cylinder, μ(Z) the number of expected cases, N the total number of observed cases in the study area and μ(T) is the total number of expected cases in the study area. Relative risk was used to quantify variations in risk between spatial units within and outside clusters, defined by the following equation:
(3)
(3)
where c is the number of observed cases in a SA2 region, e is the total number of expected cases and C represents total COVID-19 cases within the study area. Gini coefficient was used to determine optimal clustering size to identify relevant clustering reporting, to identify population at risk (up to 50% maximum) and non-overlapping clusters [Citation33]. Maximum spatial cluster size was defined as 10% of the population at risk, with a minimum of five confirmed cases (significant clusters at p < .05) to improve sensitivity and detection of spatially relevant clusters [Citation34]. Anselin Local Moran’s I cluster and outlier analysis (999 permutations for sensitivity) was performed to identify statistically significant outliers (low negative Z-score) across phases, i.e. outliers with high values near low values or low values near high values. As risk is not homogenous within a cluster, to reduce uncertainty and detect potential outliers within clusters RR for each SA2 were reported and mapping was performed using ArcGIS Pro software (v. 3.2, 2023) [Citation35].
Results
Descriptive analysis
A total of 649,366 locally acquired, PCR-confirmed COVID-19 cases were recorded from 1 January 2021 to 19 July 2022, from these notifications, 553,932 cases (85.3%) were reported with SA2, while 95,434 cases (14.7%) did not have any SA2 designation. From 1 January 2021 until the border opening in mid-December 2021, 310 locally acquired cases were recorded. With the removal of travel restrictions on 13 December 2021, COVID-19 spread quickly, with the epidemic peak occurring in early January 2022 and all SA2 region shaving recorded cases by 7 January 2022, during this period 156,663 locally acquired cases were reported, with the removal of border restrictions in phase 3, 396,989 cases with SA2 designation were recorded. Due to the low levels of community transmission before the reopening of borders, the phases of masking were assessed from the reopening in December 2021. Throughout level 1 of mandatory masking, 20,155 cases were recorded, increasing throughout level 2 to 323,862 cases, with 209,605 cases recorded after mask mandates (level 3) were removed from March through to mid-July. Across the state, population characteristics vary greatly, with overall lower levels of disadvantage, higher annual incomes and greater numbers of people born overseas in highly populated SEQ including the state capital, Brisbane City. Compared with Far North Queensland (FNQ) and outback regions, including cities and tourist hubs, where the local populations are younger on average, experience higher levels of disadvantage and a higher proportion of people identify as Aboriginal and/or Torres Strait Islander [Citation36].
Temporal trends in COVID-19 incidence
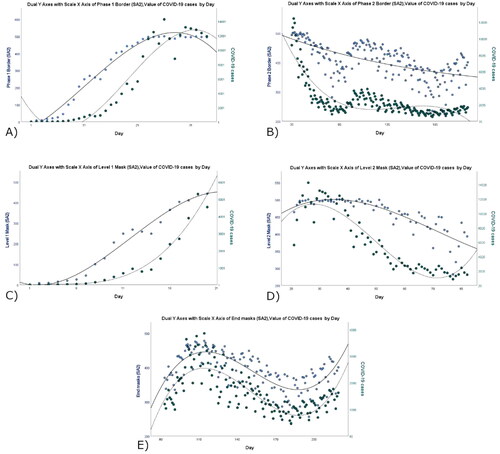
Using scatter plots to describe temporal trends over the interventions for both daily incidence and daily SA2 regions showed a strong positive relationship in phase 2 of reopening while phase 3 trended negatively. There were insufficient cases recorded during phase 1 for analysis (). When divided into stages of masking, the trends in reported cases and SA2 regions are more distinct. In terms of masking phases, the time frames for these differed, with level 1 masking implemented when borders opened and increased to curb transmission in high risk public settings. As level 2 masking transitioned to removal of masking requirements, these scatterplots illustrate the unusual temporal changes occurring in SA2s and daily case notifications for the state. In early March to April, there were unusual patterns of cases and SA2 regions declining, potentially related to increased masking, where lower case burden may result from decreased transmission or undetected cases due to limited testing. After mask mandates were removed, this trend continued when positive cases and affected SA2 regions increased again moving into winter and continuing up to the end of the study period.
Figure 2. Scatter plots with regression line for daily COVID-19 cases (green) and SA2 regions (blue) by phase of border opening (A, B) and masking levels (C–E) from 13 December 2021 to 19 July 2022.
Spatial variations in vaccination coverage
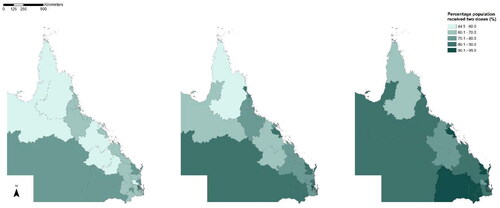
Across Queensland, many regions had very high vaccination uptake with 94.4% of the state population aged over 15 years having received two doses of the vaccine (range = 64.4% to >95%) by end of July 2022. The total population coverage required for transition of border restrictions phases was 70%, 80% and 90%. These thresholds were reached on 15 November 2021, 13 December 2021 and 17 January 2022, respectively. Despite high levels of overall population vaccination coverage, regions with below threshold coverage persisted (see ). The lowest levels of coverage were in the Far North region, with only 61.5% and 51.8% aged over 16 years having received one or two doses, respectively. Additional booster dose uptake was comparatively lower across the state, with less than 60% (range = 49–78.1%) having received more than two doses. Interestingly, despite overall low vaccination coverage, FNQ had relatively high uptake of boosters with 58.5% of the population receiving more than two doses.
Figure 3. Percentage of the population having received two doses of COVID-19 vaccine by SA3 region at vaccination target thresholds. Left to right: 70% state population coverage (15 November 2021), 80% state population coverage (13 December 2021) and 90% state population coverage (17 January 2022).
Spatial distribution of COVID-19
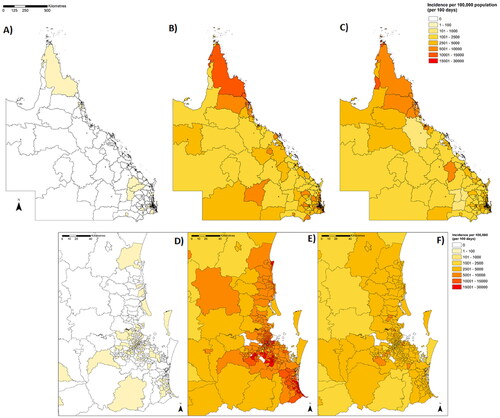
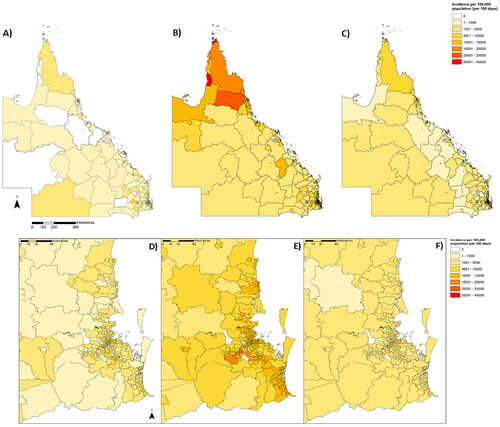
When adjusted for population (cases per 100,000 population) and varying exposure time (per 100 days), we were able to highlight the varying rates of COVID-19 incidence by region. In border opening phase 1, SEQ inner-city regions of St Lucia (100.7/100,000), Taringa (71.4/100,000) and Chapel Hill (40.2/100,000) had the highest incidence per 100,000 persons per 100 days. In phase 2, two SEQ regions, Fortitude Valley (27,528/100,000) and Woolloongabba (26,617/100,000) and Port Douglas in FNQ (26,799/100,000), had the highest incidence rates. By phase 3, the regions with the highest incidence in FNQ include Yarrabah (14,597/100,000), Torres (14,299/100,000) and Weipa (13,459/100,000) ().
Figure 4. COVID-19 incidence per 100,000 population per 100 days by border closure phases for Queensland (A: phase one, B: phase 2 and C: phase 3; D–F: SEQ detail).
During level 1 masking, SEQ inner city suburbs in Paddington–Milton (11,670/100,000) and Noosa Heads (9,336/100,000) and Jondaryan in the southwest (9612/100,000), had the highest incidence. During level 2, SA2 regions in FNQ including Yarrabah (39,190/100,000), Palm Island (35,902/100,000) and Torres (28,362/100,000) had the highest incidence. Without mandatory masking, the regions with the highest incidence were in FNQ in Redlynch (11,004/100,000), Brinsmead (10,475/100,000) and Weipa (10,021/100,000) ().
Figure 5. COVID-19 incidence per 100,000 population per 100 days by masking requirements for Queensland (A: level 1, B: level 2 and C: level 3; D–F: SEQ detail).
Spatial cluster analysis
Analysis of the intervention phases detected significant clusters in regions with greater than expected infection rates when adjusted for population. Prior to the opening of state and international borders, four significant clusters were identified, the MLC located in highly populated regions in SEQ (RR = 30.8, radius 3.21 km, p < .00001). During phase 2 of border changes, seven significant clusters were identified across the state, with the MLC centred in SEQ (Gold Coast) regions (RR = 1.71, 24.5 km, p < .00001), by phase 3 of border changes, there were 17 significant clusters, with more clusters detected in North and Far North QLD regions with lower population density with smaller localised clusters across southeast Queensland. The MLC was detected in FNQ including Cairns City and Torres Strait Islands (RR = 2.64, 838.75 km, p < .00001) () (see for full cluster details).
Figure 6. Relative risk by SA2 with MLC by border restrictions in Queensland with details for SEQ (A: phase one, B: phase 2 and C: phase 3) showing clusters by area (cluster outline) and proportional to population (blue gradient and diameter).
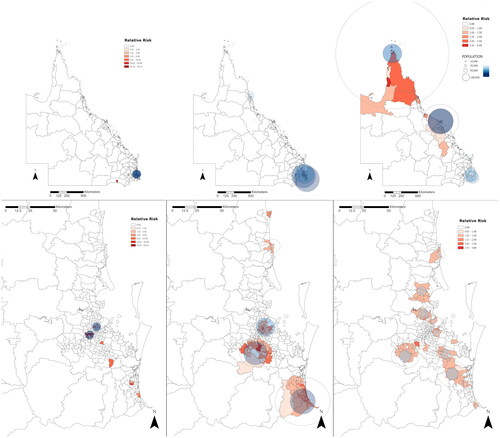
Table 2. Details of most-likely clusters (MLC) of COVID-19 infection by intervention phase.
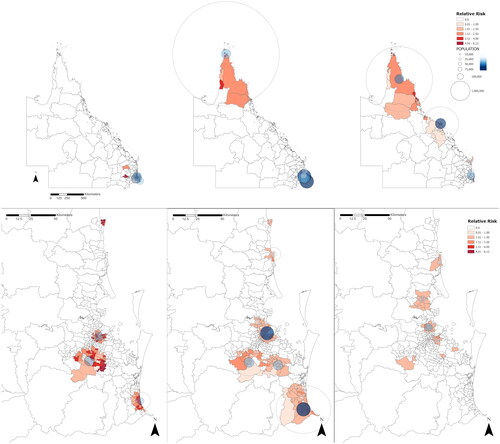
High-risk cluster analysis for masking levels identified 10 significant clusters during level 1 masking across the South-East, with the primary cluster centred in Gold Coast SA2 regions (RR = 2.56, 9.13 km, p < .00001). During mask level 2, 10 significant clusters were identified, with the MLC in FNQ centred over Torres (RR = 2.22, 791.76 km, p < .00001). In level 3 of masking, 15 significant clusters were identified across the state, the MLC was in FNQ, centred in Cape York (RR = 2.88, 488.26 km, p < .00001) ().
Figure 7. Relative risk by SA2 with MLC by masking levels in Queensland with details for SEQ (A: phase one, B: phase 2 and C: phase 3) showing clusters by area (cluster outline) and proportional to population (blue gradient and diameter).
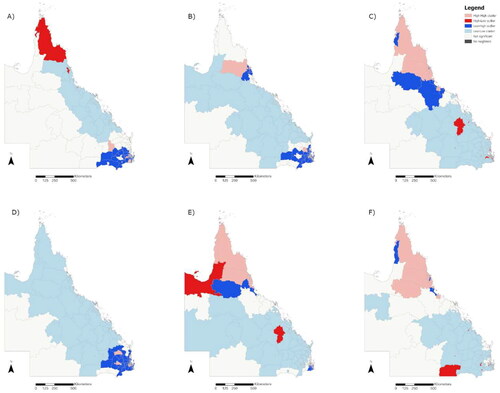
Results of outlier analysis for incidence per 100,000 persons showed similar patterns to the MLC analysis, identifying similar clusters of high or low risk. Additionally, this method identifies unusual outliers in relation to clusters, as areas with low values beside high values or high values beside low values. The most significant of these results are showing a low-high outlier near the northern cluster with comparatively lower values than surrounding areas ().
Figure 8. Map showing cluster and outlier analysis by intervention phases, border (A–C) masking (D–F), showing unusual outliers as high-low or low-high and clusters as high-high or low-low.
Discussion
Spatial analysis of COVID-19 transmission in Queensland revealed the impacts of the three major interventions; state and international border closures, community vaccination levels and mandatory masking and their effect on spatial patterns of transmission and identified high-risk clusters across the state. From this analysis, the implementation of state and international border closures was effective in preventing community transmission of COVID-19 [Citation37], with limited cases of COVID-19 detected while international borders remained closed, mostly related to interstate outbreaks, quarantine breaches or hospitals treating COVID-19 patients in inner-city Brisbane. After the border restrictions were removed, COVID-19 spread quickly, with cases recorded in all SA2 regions within 25 days of reopening. This trend dropped off after reaching the epidemic peak, with daily COVID-19 cases and affected SA2 regions decreasing. As the border reopening phases moved to full reopening, daily case notifications decreased, and small localised clusters occurred in highly populated SEQ, with a large primary cluster in FNQ.
Changes in high-risk clusters indicated the population and regions at risk changed over time and reflected the return to unrestricted population movement from high-density cities, major transport hubs and holiday destinations particularly SEQ, FNQ and Sunshine Coast regions. Travel and population movement were major drivers of the changes in COVID-19 incidence over this time, by the final stages of reopening, the SA2 regions with the highest incidence were predominantly outside the major cities and popular travel destinations. In terms of masking requirements, the phases were shorter, and allowed for finer temporal resolution to identify emerging high-risk clusters, similar to phase 2 of border changes, most clusters were identified in SEQ, while clusters begin to emerge in FNQ. As masking requirements were removed, SEQ outbreaks were subsiding, while transmission remained high in North and Far North QLD.
Border reopening phases were directly tied to population vaccination thresholds over this time, where high uptake in SEQ can be observed, while the Northern regions of Queensland coverage lagged behind and uptake remained low. This may be caused by issues with vaccine availability or vaccine avoidance behaviours. The direct and indirect effects of these interventions over time are difficult to evaluate and changes in transmission, particularly in the decline in cases in March and subsequent increase, may also be attributable to a number of causes, including the lagged effect of increased masking requirements and vaccination, public holidays, delaying school commencement and work-from-home recommendations until late February. Masking may have had minimal effect on transmission at the population level, as a personal protective item used to reduce personal risk, compliance is difficult to measure across the population and may be affected by a range of issues including appropriate mask choice and fitting [Citation38]. Overall, following the large initial outbreak, COVID-19 numbers declined across most of the state, with lower numbers of SA2s recording cases. These results could also be attributed to low numbers of reporting for re-infections due to increasing population immunity or asymptomatic re-infections, reduced testing availability and the introduction of a minimum 12 week wait for re-testing following a positive test result, eventually changed to 35 days [Citation39]. Additionally, rapid antigen testing (RAT) reporting was introduced in January, with eligibility changes for PCR testing, meaning COVID-19 case numbers from this period were under-reported and likely to underestimate actual community transmission and COVID-19 incidence during this period.
While the changes in COVID-19 incidence over time reflect the expected epidemic growth of an outbreak, spatial variations with higher than expected incidence and high risk clusters suggest there may be additional factors contributing to greater transmission risk in some populations and regions. Following the initial outbreak in the most populated SA2s in SEQ, high-risk clusters and regions with the highest incidence were consistent with SA3 areas with lower vaccination; this was most apparent in FNQ. Although the temporal effects of border reopening are difficult to separate from vaccination levels, variations in vaccination coverage at the population level may mitigate transmission rate, or indicate behaviours which modify risk of infection, alternatively the optimal population vaccination threshold for protection may not have been reached in some regions [Citation40,Citation41]. In this study, vaccination may have played a role in reducing the risk of infection in the early stages of reopening [Citation42], with fewer breakthrough cases in vaccinated individuals. This effect has reduced over time with a waning immune response to vaccines [Citation43], low ongoing booster uptake [Citation44] and emerging immune evasive COVID-19 variants [Citation45]. Alternatively, unusual clusters may instead result from social behaviours and attitudes, i.e. lack of trust in governments [Citation46], meaning unvaccinated individuals may also be less likely to participate in preventative behaviours such as avoiding gatherings or public spaces, masking or movement restrictions.
Population and socio-environmental factors likely contribute to spatial variations in COVID-19 transmission, as reported in a recent study by Ward et al. [Citation47]. Socioeconomic factors may have contributed to increased incidence in low socioeconomic areas in Queensland at the postcode level. This supports our findings of high-risk clusters in regions with lower vaccination, rural or very remote regions and predominantly Aboriginal and Torres Strait Islander communities in FNQ (see Supplementary Figure 1). These were among the last SA2 regions to record cases, though these regions experience high levels of transmission once introduced. Communities in these regions are especially vulnerable to COVID-19 infections, with lower overall vaccination coverage (<65% two doses over 15 years), limited healthcare resources, experience greater levels of disadvantage and are more likely to have long-term health conditions compared to the total Queensland population [Citation48,Citation49]. Other SA2 regions identified as high-risk clusters may also have vulnerable populations with different socio-environmental risk factors for infection; higher population density, younger age groups or lower socioeconomic status [Citation50] are linked to an increased risk of COVID-19 infection. Additionally, regional weather variability may contribute to variations in transmission dynamics or population susceptibility through mediating immune response, altered behaviours or increased population mobility [Citation51].
As far as we are aware, this is the first study describing spatial patterns of COVID-19 incidence in relation to vaccination coverage and high-risk cluster analysis at the SA2 level in Queensland describing the role of public health interventions including vaccination and the potential modifying effect on COVID-19 transmission using a spatial approach. Spatial clusters in our study were defined temporally in terms of interventions, over shorter time periods (ranging from 20 days to 346 days), allowing identification of changing clusters and affected regions. This method allows for the timely identification of high-risk regions and implementation of targeted public health responses, i.e. healthcare resources, increasing antiviral prescribing, and public health messaging in spatial units related to community interactions.
Some limitations we have identified in this study include the varying availability of COVID-19 data, due to changes in testing policies and availability, i.e. reduced PCR testing and transition to RAT self-reporting. Case numbers are less likely to accurately represent community levels of COVID-19. Due to the timeline of policy changes and variations in compliance, it is difficult to separate the possible effects of vaccination or masking from other factors. Additionally, RAT reporting methods were informal and lacked validation, relying on self-reported testing data. Cooperation and general adherence to NPIs are difficult to measure at the population level, particularly in the case of masking requirements. Negative sentiment towards NPIs and vaccination may also be related to a decreased likelihood of getting tested or reporting symptoms when infected.
It is important to acknowledge the potential for spatial bias or modifiable unit area problem (MAUP), which may influence the interpretation of results due to spatial aggregation [Citation52], which may lead to overemphasis of clusters particularly in large geographical areas and in small population. To attempt to mitigate this aggregation, we have selected the smallest population at risk to determine maximum cluster size to reduce oversized aggregate clusters [Citation53], and manually excluded unusual populations or clusters as outlined in the methods. As risk within clusters is heterogeneous, outliers will exist even within a highly related area; therefore, significant clusters identified through this method require interpretation in the context of local population and regional factors.
SA2 regions may also have varying levels of access to PCR testing, particularly in relation to metropolitan versus regional testing availability. Moreover, SA2 designations for positive PCR results are based on registered residential addresses and may not be related to the testing location of the case or the source of infection. When comparing incidence between phases, there appears to be limited variance in the data, with most results falling within one standard deviation or below the mean value across the state (Figures S2 and S3) which may reduce the ability to compare across spatial units and sensitivity to detecting spatial variations over time potentially leading to artificially significant clusters. Finally, as an ecological study where effects of NPIs are being examined at the population level, there are inherent limitations to this method particularly the potential for ecological fallacy when interpreting these results, as associations observed at the population level may not necessarily apply to individual risk.
As a preliminary epidemiological study, these methods are useful for providing broad population level information for health policy makers and insight into vulnerable populations and regions. For the future, further in-depth exploration of the spatial and temporal patterns of transmission in Queensland is important, utilising complex disease transmission models with consideration for emerging subvariants and changes in transmissibility and the effect of socio-environmental risk factors including age, sex, Indigenous status, income or education levels, also temporal considerations including school holidays, changing testing availability and effects of seasonality or weather variability.
Conclusions
This study contributes to the ongoing understanding of COVID-19 transmission in Queensland, Australia and the effectiveness of NPIs in reducing transmission. Using spatial cluster analysis, we identified high-risk clusters for COVID-19 at the SA2 level in relation to masking, vaccination and border restrictions. High-risk clusters were identified in cities and areas related to incoming travellers, over time the locations and size of clusters changed, with smaller localised clusters identified in regional and remote areas, and areas with lower vaccination coverage, providing important information for public health policymakers for targeted interventions and public health responses. High-risk regions identified in this study may have unique socioenvironmental or population risk factors contributing to higher levels of transmission, increased susceptibility or changes in behaviour or adherence to restrictions that are important to explore in further studies.
Supplemental Material
Download MS Word (1.4 MB)Disclosure statement
No potential conflict of interest was reported by the author(s).
Data availability statement
The data that support the findings of this study are from publicly available sources. COVID-19 incidence data for Queensland, Australia are available from the COVID-19 Resources Open Data Portal from the Queensland Government repository (CC BY 4.0) (https://www.data.qld.gov.au/dataset/queensland-covid-19-case-line-list-location-source-of-infection/resource/1dbae506-d73c-4c19-b727-e8654b8be95a) [Citation54]. All Australian SA2 population estimates data for 2021–2022 are available for download from the Australian Bureau of Statistics (ABS) data repository (CC BY 4.0) (https://www.abs.gov.au/statistics/people/population/regional-population/2021-22/32180DS0001_2021-22r.xlsx) [Citation55].
Additional information
Funding
References
- Mahase E. China coronavirus: WHO declares international emergency as death toll exceeds 200. BMJ. 2020;368:m408. doi: 10.1136/bmj.m408.
- Ashcroft P, Lehtinen S, Bonhoeffer S. Test–trace–isolate–quarantine (TTIQ) intervention strategies after symptomatic COVID-19 case identification. PLOS One. 2022;17(2):e0263597. doi: 10.1371/journal.pone.0263597.
- Gillespie JA, Buchanan J, Schneider CH, et al. COVID 19 vaccines and the Australian health care state. Health Policy Technol. 2022; 11(2):100607. doi: 10.1016/j.hlpt.2022.100607.
- El-Heneidy A, Ware RS, Robson JM, et al. Respiratory virus detection during the COVID-19 pandemic in Queensland, Australia. Aust N Z J Public Health. 2022;46(1):10–15. doi: 10.1111/1753-6405.13168.
- Vardoulakis S, Sheel M, Lal A, et al. COVID-19 environmental transmission and preventive public health measures. Aust N Z J Public Health. 2020;44(5):333–335. doi: 10.1111/1753-6405.13033.
- Hanly MJ, Churches T, Fitzgerald O, et al. The impact of re-opening the international border on COVID-19 hospitalisations in Australia: a modelling study. Med J Aust. 2022;216(1):39–42. doi: 10.5694/mja2.51291.
- Stobart A, Duckett S. Australia’s response to COVID-19. Health Econ Policy Law. 2022;17(1):95–106. doi: 10.1017/S1744133121000244.
- Wright E, Pollard G, Robertson H, et al. Household transmission of the Delta COVID-19 variant in Queensland, Australia: a case series. Epidemiol Infect. 2022;150:e173.
- Sanz-Leon P, Stevenson NJ, Stuart RM, et al. Risk of sustained SARS-CoV-2 transmission in Queensland, Australia. Sci Rep. 2022;12(1):6309. doi: 10.1038/s41598-022-10349-y.
- Wilder-Smith A. What is the vaccine effect on reducing transmission in the context of the SARS-CoV-2 Delta variant? Lancet Infect Dis. 2022;22(2):152–153. doi: 10.1016/S1473-3099(21)00690-3.
- Stokel-Walker C. What do we know about COVID vaccines and preventing transmission? BMJ. 2022;376:o298. doi: 10.1136/bmj.o298.
- Communicable Disease Genomics Network. Variants of concern: Communicable Disease Genomics Network; 2022 [cited 2022 30 Jun]. Available from: https://www.cdgn.org.au/variants-of-concern
- Cordes J, Castro MC. Spatial analysis of COVID-19 clusters and contextual factors in New York City. Spat Spatiotemporal Epidemiol. 2020;34:100355. doi: 10.1016/j.sste.2020.100355.
- Andersen LM, Harden SR, Sugg MM, et al. Analyzing the spatial determinants of local COVID-19 transmission in the United States. Sci Total Environ. 2021;754:142396. doi: 10.1016/j.scitotenv.2020.142396.
- Liu M, Liu M, Li Z, et al. The spatial clustering analysis of COVID-19 and its associated factors in mainland China at the prefecture level. Sci Total Environ. 2021;777:145992. doi: 10.1016/j.scitotenv.2021.145992.
- Nazia N, Law J, Butt ZA. Spatiotemporal clusters and the socioeconomic determinants of COVID-19 in Toronto neighbourhoods, Canada. Spat Spatiotemporal Epidemiol. 2022;43:100534. doi: 10.1016/j.sste.2022.100534.
- Ullah S, Mohd Nor NH, Daud H, et al. Spatial cluster analysis of COVID-19 in Malaysia (Mar–Sep, 2020). Geospat Health. 2021;16(1). doi: 10.4081/gh.2021.961.
- Yang S-Q, Fang Z-G, Lv C-X, et al. Spatiotemporal cluster analysis of COVID-19 and its relationship with environmental factors at the city level in mainland China. Environ Sci Pollut Res Int. 2022;29(9):13386–13395. doi: 10.1007/s11356-021-16600-9.
- Castro RR, Santos RSC, Sousa GJB, et al. Spatial dynamics of the COVID-19 pandemic in Brazil. Epidemiol Infect. 2021;149:e60.
- Luo W, Liu Z, Zhou Y, et al. Investigating linkages between spatiotemporal patterns of the COVID-19 Delta variant and public health interventions in Southeast Asia: prospective space-time scan statistical analysis method. JMIR Public Health Surveill. 2022;8(8):e35840. doi: 10.2196/35840.
- Ge Y, Zhang W-B, Wu X, et al. Untangling the changing impact of non-pharmaceutical interventions and vaccination on European COVID-19 trajectories. Nat Commun. 2022;13(1):3106. doi: 10.1038/s41467-022-30897-1.
- Talic S, Shah S, Wild H, et al. Effectiveness of public health measures in reducing the incidence of COVID-19, SARS-CoV-2 transmission, and COVID-19 mortality: systematic review and meta-analysis. BMJ. 2021;375:e068302. doi: 10.1136/bmj-2021-068302.
- Ayouni I, Maatoug J, Dhouib W, et al. Effective public health measures to mitigate the spread of COVID-19: a systematic review. BMC Public Health. 2021;21(1):1015. doi: 10.1186/s12889-021-11111-1.
- Leung K, Wu JT, Leung GM. Effects of adjusting public health, travel, and social measures during the roll-out of COVID-19 vaccination: a modelling study. Lancet Public Health. 2021;6(9):e674–e682. doi: 10.1016/S2468-2667(21)00167-5.
- Queensland Health. Queensland COVID-19 case line list – location & source of infection; 2022. Available from: https://www.data.qld.gov.au/dataset/queensland-covid-19-case-line-list-location-source-of-infection/resource/1dbae506-d73c-4c19-b727-e8654b8be95a
- Therapeutic Goods Administration. COVID-19 point-of-care tests; 2022 [updated 12 Jan 2022; cited 2022 Aug 10]. Available from: https://www.tga.gov.au/covid-19-point-care-tests
- Australian Bureau of Statistics. Main structure and greater capital city statistical areas; 2021 [cited 2023 Nov 14]. Available from: https://www.abs.gov.au/statistics/standards/australian-statistical-geography-standard-asgs-edition-3/jul2021-jun2026/main-structure-and-greater-capital-city-statistical-areas#cite-window1
- Australian Bureau of Statistics. Regional population – Queensland; 2022 [updated 2022 Mar 29; cited 2022 Jun 30]. Available from: https://www.abs.gov.au/statistics/people/population/regional-population/latest-release#queensland
- Queensland Government. Queensland’s COVID-19 vaccine plan to unite families; 2022 [cited 2022 Aug 20]. Available from: https://www.covid19.qld.gov.au/government-actions/queenslands-covid19-vaccine-plan/queenslands-covid19-vaccine-plan
- Kulldorff M, Information Management Services Inc. SaTScan™ V10.1: software for the spatial and space-time scan statistics; 2022. Available from: https://www.satscan.org/
- Zhang Y, Bambrick H, Mengersen K, et al. Resurgence of pertussis infections in Shandong, China: space-time cluster and trend analysis. Am J Trop Med Hyg. 2019;100(6):1342–1354. doi: 10.4269/ajtmh.19-0013.
- Desjardins MR, Hohl A, Delmelle EM. Rapid surveillance of COVID-19 in the United States using a prospective space-time scan statistic: detecting and evaluating emerging clusters. Appl Geogr. 2020;118:102202. doi: 10.1016/j.apgeog.2020.102202.
- Han J, Zhu L, Kulldorff M, et al. Using Gini coefficient to determining optimal cluster reporting sizes for spatial scan statistics. Int J Health Geogr. 2016;15(1):27. doi: 10.1186/s12942-016-0056-6.
- Martines MR, Ferreira RV, Toppa RH, et al. Detecting space–time clusters of COVID-19 in Brazil: mortality, inequality, socioeconomic vulnerability, and the relative risk of the disease in Brazilian municipalities. J Geogr Syst. 2021;23(1):7–36. doi: 10.1007/s10109-020-00344-0.
- Esri Inc. ArcGIS Pro version 3.2. Esri Inc.; 2023. Available from: https://www.esri.com/en-us/arcgis/products/arcgis-pro/overview
- Queensland Government Statistician’s Office. Queensland regions compared, Census 2021. Brisbane (QLD): Queensland Government Statistician’s Office; 2022.
- Adekunle A, Meehan M, Rojas-Alvarez D, et al. Delaying the COVID-19 epidemic in Australia: evaluating the effectiveness of international travel bans. Aust N Z J Public Health. 2020;44(4):257–259. doi: 10.1111/1753-6405.13016.
- Boulos L, Curran JA, Gallant A, et al. Effectiveness of face masks for reducing transmission of SARS-CoV-2: a rapid systematic review. Philos Trans A Math Phys Eng Sci. 2023;381(2257):20230133. doi: 10.1098/rsta.2023.0133.
- Queensland Government. After having COVID-19; 2022 [updated 2023 May 9; cited 2023 Sep 27]. Available from: https://www.qld.gov.au/health/conditions/health-alerts/coronavirus-covid-19/health-advice/i-have-covid/after-having-covid-19
- Coccia M. Optimal levels of vaccination to reduce COVID-19 infected individuals and deaths: a global analysis. Environ Res. 2022;204(Pt C):112314. doi: 10.1016/j.envres.2021.112314.
- Wang W, Wu Q, Yang J, et al. Global, regional, and national estimates of target population sizes for COVID-19 vaccination: descriptive study. BMJ. 2020;371:m4704. doi: 10.1136/bmj.m4704.
- Sheel M, Vun Voo T, Pingault N, et al. Vaccine breakthrough infections in a highly-vaccinated Australian population during a SARS-CoV-2 Delta outbreak. Commun Dis Intell. 2022;46. doi: 10.33321/cdi.2022.46.32.
- Menni C, May A, Polidori L, et al. COVID-19 vaccine waning and effectiveness and side-effects of boosters: a prospective community study from the ZOE COVID study. Lancet Infect Dis. 2022;22(7):1002–1010. doi: 10.1016/S1473-3099(22)00146-3.
- Attwooll J. Booster take-up disparities widen. Royal Australian College of General Practitioners; 2022 [updated 2022 Mar 18; cited 2022 Jul 8]. Available from: https://www1.racgp.org.au/newsgp/clinical/booster-take-up-disparities-widen
- Cele S, Jackson L, Khoury DS, et al. Omicron extensively but incompletely escapes Pfizer BNT162b2 neutralization. Nature. 2022;602(7898):654–656. doi: 10.1038/d41586-021-03824-5.
- Trent M, Seale H, Chughtai AA, et al. Trust in government, intention to vaccinate and COVID-19 vaccine hesitancy: a comparative survey of five large cities in the United States, United Kingdom, and Australia. Vaccine. 2022;40(17):2498–2505. doi: 10.1016/j.vaccine.2021.06.048.
- Ward S, Restrepo AC, McHugh L. Area-level geographic and socioeconomic factors and the local incidence of SARS-CoV-2 infections in Queensland between 2020 and 2022. Aust N Z J Public Health. 2023;47(6):100094. doi: 10.1016/j.anzjph.2023.100094.
- Queensland Government Statistician’s Office. Queensland Aboriginal and Torres Strait Islander population, Census 2021 Snapshot. Brisbane (QLD); 2022.
- Thurber KA, Barrett EM, Agostino J, et al. Risk of severe illness from COVID‐19 among aboriginal and Torres Strait Islander adults: the construct of ‘vulnerable populations’ obscures the root causes of health inequities. Aust N Z J Public Health. 2021;45(6):658–663. doi: 10.1111/1753-6405.13172.
- Roder C, Maggs C, McNamara BJ, et al. Area-level social and economic factors and the local incidence of SARS-CoV-2 infections in Victoria during 2020. Med J Aust. 2022;216(7):349–356. doi: 10.5694/mja2.51436.
- McClymont H, Si X, Hu W. Using weather factors and Google data to predict COVID-19 transmission in Melbourne, Australia: a time-series predictive model. Heliyon. 2023;9(3):e13782. doi: 10.1016/j.heliyon.2023.e13782.
- Fotheringham AS, Wong DWS. The modifiable areal unit problem in multivariate statistical analysis. Environ Plan A. 1991;23(7):1025–1044. doi: 10.1068/a231025.
- Sherman RL, Henry KA, Tannenbaum SL, et al. Applying spatial analysis tools in public health: an example using SaTScan to detect geographic targets for colorectal cancer screening interventions. Prev Chronic Dis. 2014;11:e41. doi: 10.5888/pcd11.130264.
- Queensland Health. Queensland COVID-19 case line list – location & source of infection [dataset]. Brisbane (QLD); 2023.
- Australian Bureau of Statistics. Population estimates and components by SA2, 2021 to 2022 – revised [dataset]. Canberra (ACT); 2022.