
ABSTRACT
Open Learner Model (OLM) visualisations capture and display a learner’s learning state such as knowledge levels, learning progress, and misconceptions. Exposing learners to their own models offers learners a perspective about their learning state. Numerous benefits have been reported include providing more opportunities for learners to collaborate, enhancing learning outcomes, and prompting learners to be more self-regulated. We describe a new independent OLM tool, Doubtfire++ that we have designed to support Task-Oriented Portfolio teaching to raise student awareness of their progress and achievements, and to encourage self-regulated learning. The results of our evaluation show that Doubtfire++ helped the teaching staff in creating a supportive learning environment and students felt supported and rewarded for learning in a self-regulated manner. We have identified several OLM visualizations that were perceived to assist self-regulated learning. We also have gained insightful inputs and feedback that lead to expanding its application to a broader context.
Introduction
Learning outcomes provide important information in assessing the educational quality. In embracing an outcome-based learning, many higher education institutions have embedded graduate attributes and the intended learning outcomes with their programmes to reflect the development of essential knowledge and skills among the students throughout their studies. University students today are required to take greater ownership of their learning and evidence their learning outcome achievements with learning artefacts. Involving students and engaging them in iterative formative assessment practices are crucial in order to encourage self-regulated learning. This places the responsibility of learning from the teacher to the student, that is, shifted to a student-centred learning environment.
Various teaching and learning approaches and/or technological tools have been used to support either outcome-based or student-centred learning environments, or both. The adoption and deployment of various approaches or tools is not without its challenges, for example, the use of a constructive alignment strategy, e-portfolios and intelligent tutoring systems. While constructive alignment helps teaching staff in aligning their teaching approach with intended learning outcomes to guide learning activities, students may lack self-evaluation and self-reflection and feel the alignment is not clear (Cain, Citation2013). E-portfolios are used to facilitate students in documenting and showcasing their learning artefacts (López-Crespo, Blanco-Gandía, Valdivia-Salas, Fidalgo, & Sánchez-Pérez, Citation2022; Mahasneh, Citation2020; Shroff, Trent, & Ng, Citation2013) but the challenge is students are required to accept more responsibility and work progressively on them (Bolliger & Shepherd, Citation2010; Slepcevic-Zach & Stock, Citation2018). Intelligent tutoring systems encourage and engage students in independent learning, but students often struggle to use the systems due to lack of self-regulated skills (Kelly & Heffernan, Citation2015; Vermunt & Donche, Citation2017).
In embracing an outcome-based and student-centred learning, the instructional setting has to be created to support students to be self-regulated learners. In addition, with the outbreak of COVID-19 pandemic, many physical classes are shifted to online classes (Baber, Citation2020; Mahmood, Citation2021) in which students would need to be more responsible of their learning. To this end, Open Learner Model (OLM) visualizations that allow students to visualize learning aspects are believed to guide them in taking greater responsibility to advance in their learning, that is, to become self-regulated learners. Self-regulated learning is an essential skill for effective learning in an outcome-based and student-centred learning environment.
We have developed such a tool, Doubtfire++. Doubtfire++ supports staff and students to visualize the links between learning tasks and the desired learning outcomes in the instructional settings. It enables staff to track student progress towards achieving learning outcomes. At the same time, it supports students to better manage their learning and make reflection on their learning progress to achieve the intended outcomes. First, we review the Task-Oriented Portfolio teaching approach. This teaching approach aims to stimulate self-regulated behaviours among students through the application of OLM visualizations. Then, an overview of Doubtfire++, the independent OLM tool designed in this research study for supporting student self-regulated learning is presented. Next, we describe the evaluation approach. After that, the OLM visualizations and the evaluation results are presented. This is followed by the threats to validity. Finally, the paper is concluded with a summary of the research work and some key future research directions.
Related work
Task-oriented portfolio teaching
Task-Oriented Portfolio Teaching is an outcome-based and student-centred teaching approach, as in . It begins with teaching staff setting up a teaching and learning context that maps assessment tasks with the intended learning outcomes (Biggs, Citation2014). Assessment criteria are defined for different achievement levels. These define the workload and quality of work that students need to demonstrate to fulfil the assessment criteria to achieve the desired grade level. Tasks are allocated to different grades, meaning that a Pass can be achieved if all Pass-related tasks are completed to an adequate standard. Similarly, a Credit can be achieved by satisfactorily completing all Pass and Credit-related tasks.
Figure 1. Task-oriented portfolio instructional setting.
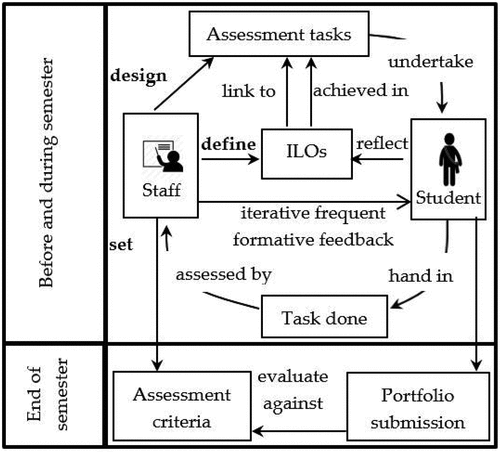
All tasks completed by the students are assessed by the teaching staff. If the task meets the required standard, it will be signed off as Complete. For tasks that do not meet the required standard, feedback is given to students to fix the problem and resubmit. Students create a portfolio to evidence that these tasks are completed. Through this iterative formative feedback, students are guided to improve and complete all assessment tasks to meet the required standard. In this teaching approach, it is critical for teaching staff to create a supportive learning environment with frequent feedback so that students become self-regulated learners.
Self-Regulated Learning (SRL)
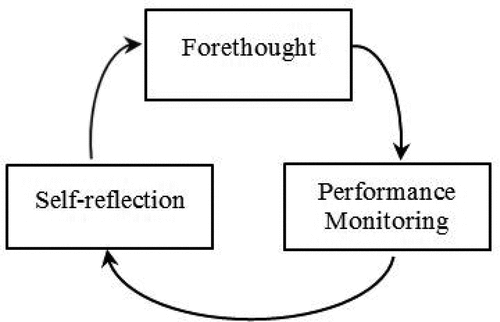
Each individual student is different. Social cognitive researchers ascribe these differences to the way students self-regulate their learning process (Schunk, Citation1989; Zimmerman, Citation2002). Self-regulation is neither an innate mental ability nor academic performance skills (Zimmerman, Citation2002). Self-regulation is teachable and can be enhanced by using high-quality self-regulatory processes (Hofer, Yu, & Pintrich, Citation1998; Zimmerman, Citation2002). For example, close self-monitoring allows students to discover subtle progress in their learning that gives them self-satisfaction. This increases their self-efficacy in performing a higher level of skills (Schunk, Citation1983). Self-regulated learners view learning as an activity they do for themselves and as such they learn in a proactive way and thus more likely to succeed in their studies (Siadaty et al., Citation2012; Thirouard, Bernaert, Dhorne, & Bianchi, Citation2015). The three distinct phases in self-regulation are: forethought, performance monitoring, and self-reflection (Zimmerman, Citation2002; Zimmerman & Campillo, Citation2003) as shown in .
Figure 2. Phases and processes of self-regulation.
Forethought phase
This involves the processes and learners’ beliefs prior to their learning efforts. Two main classes of the processes in this phase include task analysis and self-motivation. Setting the goal to achieve and planning of learning tasks to acquire knowledge and skills are examples of task analysis, whereas student beliefs about their learning is known as self-motivation. This includes their beliefs about their personal capability to learn and the personal consequences of learning, such as the learning outcomes that they will benefit from. Plans made, goals set, and firm beliefs in this phase would lead to the strategies used in the next phase, the performance monitoring phase.
Performance monitoring phase
The strategies planned to be used is implemented in this phase. This phase consists of two main processes known as self-control and self-observation. Self-control includes learner control of strategies and monitoring techniques to engage in learning. Task strategies involve the implementation of the tasks, such as the sequence, scope, and direction that have been planned with appropriate use of available resources to achieve the task goal. Self-observation involves, for example, self-monitoring of personal events to gauge the cause of these events, for example, learners involve in tracking their own functioning such as identifying the learning activities that need to be completed or redone and the number of activities that remain. The next phase is self-reflection phase in which outcomes of this phase are evaluated by the learners themselves.
Self-reflection phase
This phase involves processes that are carried out after each learning effort. It consists of two main processes known as self-judgment and self-reaction. Self-judgement relates to the learner ability to self-evaluate and to benchmark their performances against some standards, such as their prior performance, others’ performance or a set standard. It also relates to a learner’s beliefs about the cause of errors made or success attained. Self-reaction concerns learner feelings of self-satisfaction and their responses to the feeling. It has great impact on learners’ motivation and efforts invested in learning. Higher self-satisfaction drives motivation, whereas lower self-satisfaction restrains learners from putting in further efforts.
Self-regulation is a recursive cyclical process. This means the result of self-reflection would change learners’ existing task analysis and implementation strategies in the next cycle of the self-regulation phases. It is a self-directive process that engage learners in active learning, plan for their learning strategies, monitor the effectiveness of the strategies and suitably adapt to any changes of strategies. These self-regulated behaviours are important for learners in achieving their desired goals. Understanding the self-regulation processes enable learners to manage their thoughts, feelings and behaviours and transform them into skills for learning.
Evans (Citation2014) and Vermunt and Verloop (Citation1999) classify these processes as three important dimensions in self-regulation framework that include Metacognitive, Cognitive, and Affective. Metacognitive refers to learners’ understanding of how they learn that include various constructs such as Orienting and Planning, Monitoring, Testing or Diagnosing, Adjusting, Evaluating or Reflecting, and Agentic Engagement. Cognitive is defined as how an individual processes information that include numerous constructs such as Relating or Structuring, Analysing, Concretizing or Applying, Memorizing or Rehearsing, Processing Critically, and Selecting. Affective means how we manage our emotions and can be observed through these constructs: Motivating or Expecting, Concentrating or Exerting Effort, Attributing or Judging Oneself, Appraising, Dealing with Emotions, and Network Management. Learners may have different strategies or use combination of strategies to achieve various learning outcomes (Evans, Citation2021).
Open Learner Model (OLM)
An Open Learner Model is a visual representation of a student’s learning aspect that is accessible by the student it represents. The OLM concept that is drawn from Intelligent Tutoring Systems (ITS) has three main components: a domain model, a pedagogical model and a learner model (Bull & Kay, Citation2013). The domain model consists of subject of study, such as the topics, concepts and interrelationships of concepts. The learner model maintains the system’s inferences about an individual learner’s understanding of the domain knowledge based on his/her interaction with the system, by means of tests or problem solving. The pedagogical model contains the knowledge infrastructure required to customize the presentation of the teaching material based on the student model (Bull & Kay, Citation2013), enabling teaching staff to offer personalization to learners (Bull & Kay, Citation2013; Chynał, Kozierkiewicz-Hetmańska, & Piet, Citation2017).
The learner model contains known concepts, knowledge level, difficulties and misconceptions (Bodily et al., Citation2018; Bull & Kay, Citation2013). A machine-usable format allows the system to intelligently track student knowledge or skill mastery levels, so as to provide personalized instruction to students. However, this format is hidden in the system. Self (Self, Citation1990) proposes to expose students to this learner model due to its great educational value to students. The ability to access the learner model enables students to self-evaluate their progress in various aspects of the domain (Bull & Kay, Citation2013; Conati, Porayska-Pomsta, & Mavrikis, Citation2018; Long & Aleven, Citation2017).
Web technology provides support for learner models. This leads to the reuse of some parts of the model by other learning applications and allows the creation of learner models from multiple learning applications (Kay, Kummerfeld, & Lauder, Citation2002; Zapata-Rivera & Greer, Citation2004). As a result, the role of learner model has been freed from being contained within the teaching system (Bull & Kay, Citation2016). These OLMs are known as independent open learner models (Bull & Gardner, Citation2009; Bull et al., Citation2012; Bull, Johnson, Alotaibi, Byrne, & Cierniak, Citation2013; Conejo, Trella, Cruces, & Garcia, Citation2011). Such transformation allows the OLM to play an important role as a provider of learning information, thus promoting metacognitive processes among learners (Bull & Kay, Citation2013, Citation2016; Zapata-Rivera, Citation2021). The open learner model is underpinned by information visualization techniques employing various visual representations to help learners set goals, plan and organise, perform self-monitoring and self-evaluation on their learning process (Khosravi, Demartini, Sadiq, & Gasevic, Citation2021). The visual representations that provide formation of mental models of information among learners give them a clear understanding of their learning progress (Liu, Cui, Wu, & Liu, Citation2014). Some OLM research found that multiple progress representations are helpful (Bull et al., Citation2010; Bull, Johnson, Alotaibi, Byrne, & Cierniak, Citation2013; Mabbott & Bull, Citation2004). In this way, when learners are exposed to their own learner models, they would be more responsible for their own learning (Bull & Kay, Citation2013; Guerra, Hosseini, Somyurek, & Brusilovsky, Citation2016). Apart from exposing students to their own model that leads to personalised guidance, presenting parallel views of peers’ models and/or the class progressive models would provide social guidance to students (Hsiao, Bakalov, Brusilovsky, & König-Ries, Citation2011). The formation of the mental models, in this case through OLM visualizations, is posited to provoke learner thought process and prompt them for any necessary change of strategies and planning for further improvement. These OLMs lead learners to be self-aware of their ability, be determined of their goals and be more decisive in their own learning and hence become self-regulated learners in preparing a portfolio to evidence their learning progress and achievements in the Task-oriented Portfolio instructional settings. Open learner models that aid user data exploration and analysis are posited to provoke learner thought process and to encourage their self-regulated behaviour.
Doubtfire++ open learner model visualizations
We wanted to map aspects of self-regulated learning to OLM visualizations and evaluate this approach in our teaching. An independent open learner model tool known as Doubtfire++ was designed and developed based on self-regulation phases to support this teaching approach. Doubtfire++ is designed to provide learning data as multiple analyses and visualizations to the teaching staff and students. We mapped aspects of self-regulated learning to Doubtfire++ OLM visualizations and evaluated the approach in our teaching.
Doubtfire++ consists of eight OLM visualizations that support learner involvement in the three distinct phases in the self-regulation cyclical process: The Forethought, Performance Monitoring and Self-Reflection phases. They allow the teaching staff to monitor student progress and provide frequent formative feedback to support student learning. Some recent research has shown that self-regulated learning strategies, such as goal setting and strategic planning have a remarkable impact on student performance and goal achievement (Kizilcec, Pérez-Sanagustín, & Mal, Citation2017; Lee, Watson, & Watson, Citation2019; Pérez-Álvarez, Maldonado-Mahauad, & Pérez-Sanagustín, Citation2018). In view of these two self-regulated learning strategies are important for learners, the visualizations in this research are mainly developed to guide students in setting their goals and planning for their task, aiming to support students to better manage and reflect their learning progress and achievements in terms of learning outcomes in the Task-oriented Portfolio teaching environment.
Evaluation
We conducted a case study to examine user perceptions regarding their usage, perceived usefulness and overall experience interacting with OLM visualizations in Doubtfire++ to support their roles in a Task-Oriented Portfolio teaching and learning environment to encourage student self-regulated learning. An Explanatory Sequential Mixed-Methods research methodology that consists of a detailed survey and interviews was used in this study to adequately address the research questions (RQ) as follows:
How do users perceive the usefulness of the OLM visualisations for Task-oriented Portfolio teaching to support student self-regulated learning in terms of
goal setting?
performance monitoring?
self-reflection?
The questionnaire consists of three parts. Part 1 was designed to collect demographic information of the respondents. In Part 2, respondents were requested to rate the usefulness of each of the eight OLM visualizations based on a 5-point Likert scale ranging from 1=Not Useful to 5=Very Useful. Respondents rated each item from their perspectives based on their user role as either a teacher or a student. To ensure a better coverage of user usage options, noncommittal categories, ‘did not use’ was included in each question. Part 3 contained open-ended questions to seek for feedback and suggestions. Interview and focus group sessions were also conducted. The interview plan for these sessions consisted of semi-structured open-ended questions. Questions were related to how users used OLM visualizations and their experience in using various OLM visualizations in Doubtfire++.
Following the approval from Swinburne’s Human Research Ethics Committee, our Doubtfire++ prototype tool was deployed in the Faculty of Science, Engineering and Technology at Swinburne University of Technology for one semester. Research participants that include the teaching staff and students were recruited through email invitation at the end of the semester. We managed to collect a total of 134 respondents in which 15 of them were teaching staff with 119 students. Out of the 15 teaching staff, 11 were males with only 4 females. Eleven of them were tutors whereas 4 of them played a multiple role as convenor, lecturer and tutor. All of them were Doubtfire++ frequent users. Frequent user is defined as user who use Doubtfire++ at least twice in a week.
For student respondents, 99 of them were males with only 16 females. Four did not disclose this information. Most of them (98 out of 119) were frequent users, whereas 21 occasionally used it (less than 2 times in a week). Three focus group discussions and seven face-to-face interview sessions were conducted with students and teaching staff respectively. Nine were students and seven were teaching staff with 11 males and 5 females. All of them were Doubtfire++ frequent users.
Quantitative data collected from the survey questionnaire were analysed by using Descriptive Statistics whereas qualitative data collected from the face-to-face interview and open -nded questions were analysed with content analysis. Coded numbers (P1 to P16) are assigned to all the 16 interview respondents to indicate their qualitative responses, whereas other coded numbers (C1 to C3) are used to indicate the qualitative comments collected from the survey respondents. The quantitative analysis results are presented first by using the tornado chart followed by the qualitative results. To retain anonymity of the interview subjects, ‘they’ is used as a pronoun for all the comments.
OLM visualizations and results
Below we discuss key Doubtfire++ features evaluated and summarise results of the evaluation.
Target grade setting visualisations
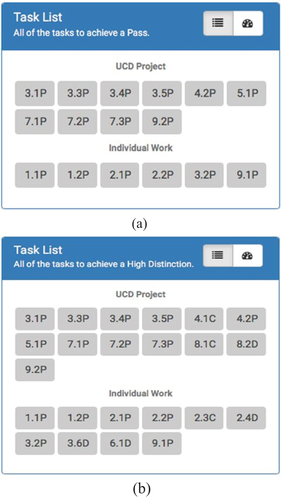
In the forethought phase of self-regulation process, a learner sets learning goals and plans for the tasks needed for learning. Doubtfire++ provides two visualizations, Target Grade Setting () and Task List () are used to support goal setting and task planning. Once a target grade (P=Pass, C=Credit, D=Distinction, HD=High Distinction) has been set by a student, the number of assessment tasks needed to be completed with the required standard to achieve the desired grade will be shown in the Task List . Students can flexibly change the desired grade to see the assessment workload needed to achieve different performance grades.
Figure 3. Target grade setting visualization.
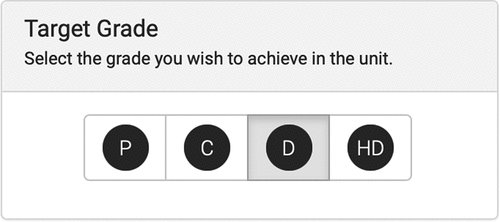
Figure 4. (a) Task list showing workload for a pass grade. (b) Task List showing work for a High Distinction grade.
Target grade setting evaluation
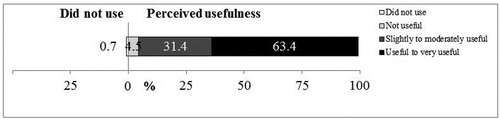
illustrates usage and perceived usefulness of the visualization to set target grade. This was a popular visualization. Only 1 respondent (0.7%) reported not using it. Many respondents (63.4%) found it useful for setting their learning goals, whereas 31.4% rated it as slightly to moderately useful. Only six respondents (4.5%) rated it as not useful. Based on feedback, as high as 94.8% of respondents perceived Target Grade Setting was useful. All the nine student respondents in the focus group discussion session expressed that they felt engaged and rewarded for being able to control their own learning pace.
Figure 5. A tornado chart showing the usage and usefulness rating for Target Grade Setting.
The qualitative results corroborate with the quantitative findings. Below we relate selected feedback on visualisations with elements of the self-regulated learning framework in Evans (Citation2021).
A teaching staff felt that:
P7:
It helped me see what a student was aiming for and guided my one-to-one discussions with them. It also allowed me to give them sufficient advice and warnings about managing their time and some pitfalls that they would likely encounter, especially with the higher grades.
However, one teacher said:
P6:
The way it was used was the top students used it correctly. The people in the middle used it correctly but all the people were really weak would either just keep putting HD or left the default grade – ‘Pass’ there.
Two teaching staff said that they had to intervene in the middle of the semester. One told the class:
P5:
You have few weeks to go, you might need to re-consider changing to a new target grade depending on how much you have done so far.
Student respondents generally perceived that it was useful:
P8:
This visualization helped me to set goals and view the required tasks to reach the desired grade. It made the necessary workload for each grade easier to see and judge.
P13:
Being able to change my desired grade to view the tasks made me felt very rewarding. It was like selecting a difficulty in a game! Tasks seemed more achievable this way.
These visualisations helped teaching staff to understand a student’s expectation in the unit that enabled them to guide student work and discussion. However, it was not fully utilised by students as some students just left the default view – ‘Pass’ in the system throughout the semester. These results show mixed views by teachers on the ability of the Target Grade Setting visualisation to support Orienting and Planning, but support for Reflecting and Adjusting. Most students felt it supported these Metacognitive constructs well.
Performance monitoring visualizations
The next phase of the self-regulation, cyclical process, is the performance monitoring phase. Doubtfire++ provides six visualizations including Task List, Focus List, Task Summary Chart, Burndown Chart, Outcome Alignment and Achievement Chart and Outcome Alignment and Achievement Task View () are used to help students self-monitor their performance and hence to decide appropriate strategies to achieve their learning goals.
Figure 6. Task list using colours to show task statuses.
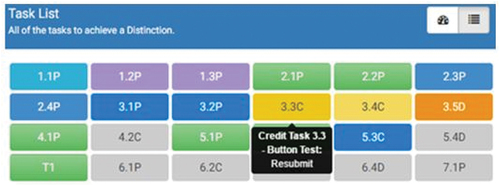
Figure 7. Focus list showing tasks to keep student on track.
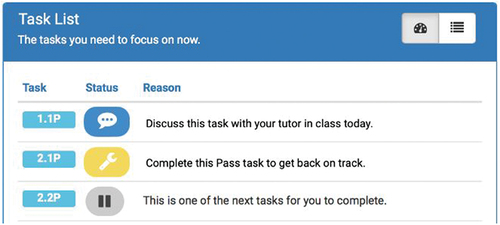
Figure 8. Burndown chart is designed to help students to self-assess their progress.
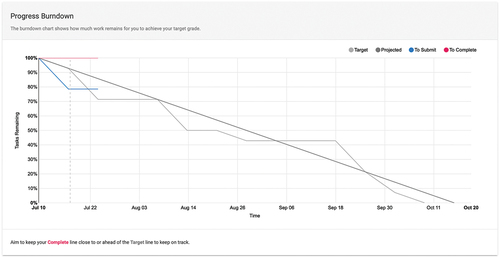
Figure 9. Task summary chart showing summary of task statuses for an individual student.
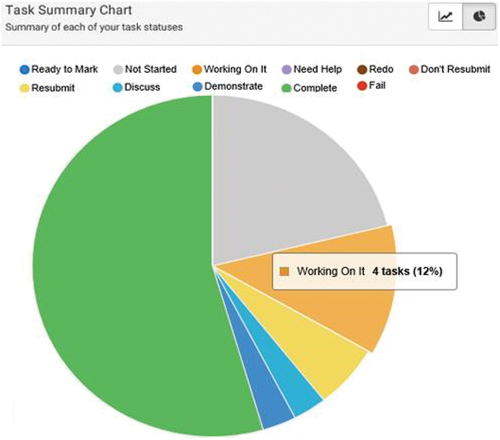
Figure 10. Outcome alignment and achievement chart presenting information about individual and group LO achievements.
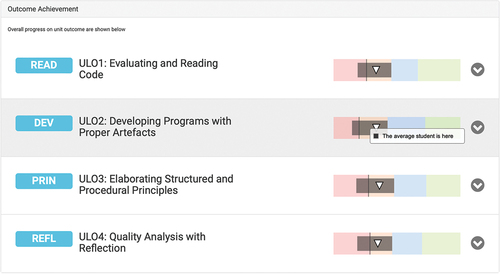
Figure 11. Outcome alignment and achievement task view showing links between learning outcome and tasks.
The Task List () shows the amount of workload and keeps students informed about their task statuses through a range of colour hues, such as green for ‘Complete’, light blue for ‘Discuss’, dark blue for ‘Ready to mark’, yellow for ‘Resubmit’, dark yellow for ‘Working on it’, purple for ‘Need help’, and grey for ‘Not started’. It provides an overview of the status of all tasks and engage student to improve their assessment tasks through iterative formative feedback.
Focus List () suggests assessment tasks in the order of priority to achieve the desired grade and stay on track. It is especially useful for students who are lagging behind to catch up with their work. It is designed to help them visualize what is to be prioritised in their learning.
As students progress through the semester, they are able to track progress via the Burndown Chart (). A line graph shows remaining work versus time by week. The y-axis represents number of tasks to be completed, x-axis denotes time. A flat slope indicates that a student has not made progress for that week. A steeper slope denotes more tasks have been completed, indicating good progress. It gives a stronger implication of trend relationships that show how a student manages and approaches the assessment tasks throughout the semester. The chart is augmented by colour that enables a student to monitor their progress. It provides a mental model about task completion time and amount of workload left.
The Task Summary Chart () shows a summary of task statuses as a pie chart. This presents task status breakdown and as a whole. A user can easily know the proportion of complete versus incomplete tasks. It helps a user to see if more effort is needed for assessment tasks.
The Outcome Alignment and Achievement Chart () displays student learning outcome achievements. Four different colour hues (pink, orange, blue, green) are applied to indicate qualitative achievement levels including the Pass grade (pink), Credit (orange), Distinction (blue) and High Distinction grade (green). The chart benchmarks student achievement against assessment criteria for different grades. The class average (grey line), class achievement range (grey band), and an individual’s achievement (white triangle) are shown on this qualitative range, aim to provide personalised guidance and social guidance to students. In this way, students are able to gain a quick overview of their own achievement and the class achievement as compared to the assessment criteria.
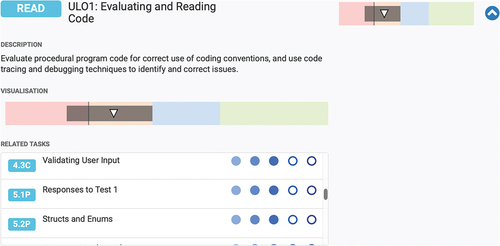
The Outcome Alignment and Achievement displays all assessment tasks that contribute to a particular learning outcome. This visualization, known as Outcome Alignment and Achievement Task View () enables students to visualise the tasks that are designed for students to grasp a specific learning outcome.
Performance monitoring evaluation
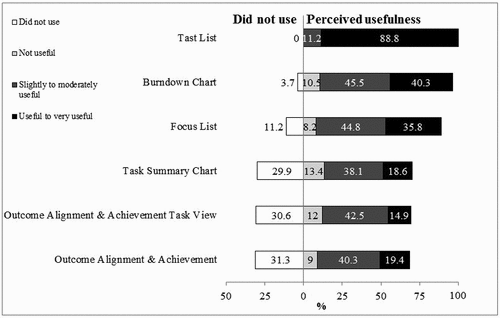
The evaluation results of the six visualizations designed to facilitate users in monitoring student performance are illustrated in . The Task List was the most popular visualization, followed by Burndown Chart and Focus List. Other visualizations such as visualizations for inspecting task status summary and learning outcomes were less popular. Approximately 30% of the users did not use them. All respondents found Task List to be the most useful visualization for monitoring performance. Burndown Chart and Focus List were also found useful by 85.8% and 80.60% of the respondents, respectively.
Figure 12. User usage and usefulness rating for OLM visualizations in monitoring performance.
The qualitative results supported the quantitative findings. All the teaching staff respondents felt that Task List helped them the most. Comments include:
P1:
It told me if my students had any issues with any specific tasks. I could see which tasks they stuck on, which tasks they needed help. I could then help them.
P3:
I referred to it when I counselled those struggling students. I used to it to advise students for tasks to catch up on.
The most notable student comments on Task List were related to its use to monitor their performance and plan for their learning. A student indicated:
P16: I checked it frequently to make sure I was on track. It gave me a quick picture of what I needed to work ahead and planned my time to achieve what I aimed for.
Colour was pointed out by respondents for an easy tracking of progress as well as to motivate students to complete the tasks. A student commented:
P10:
I felt satisfied filling up the list with green. It helped me to visualize quickly and easily knew how close I was in completing the unit!
A teacher said:
P6:
The colour coding made it easy to know which task was awaiting my feedback and I could respond to it quickly.
The results indicate coherent views by students that Task List visualisation facilitates Orienting and Planning, Adjusting, Monitoring and Diagnosing constructs in Metacognitive dimension as well as Motivating and Dealing with Emotions constructs in Affective dimension of self-regulation. Three teaching staff expressed it helped them to support students in applying strategies in Metacognitive, Cognitive and Affective dimension of self-regulation.
The Focus List was not as popular as the Task List as can be seen from the following comment:
P8:
I used this view to get a brief summary of all my upcoming tasks. It was only helpful if I fell behind as it was a constant reminder of the work left to catch up.
The following comment reveals how staff perceived and used the Burndown Chart:
P4:
It was very useful to gauge if a student’s rate of doing tasks was sufficient enough to reach their desired grade during the semester. Based on the shape of the line, student progress can easily be reviewed at the end of the unit. This helps in portfolio assessment.
Students had different opinions about the Burndown Chart. Students who were able to interpret the graph found it to be very useful in helping them to stay on track. However, a student respondent found it hard to understand. Comments include:
P9:
It provided the timeline measurement for me to visualize the required ‘velocity’ of work needed to stay on track. It helped me juggling the workload over my four units!
C1:
I had never really got a good idea of how I was going by looking at this chart. It was just a bunch of lines that were sometimes above the dark grey line and sometimes below it …
The following statement shows how the Task Summary Chart was used by one of the teaching staff.
P1:
It gave me a general overview of my class. I used it occasionally to get a general sense of the class progress.
Some student respondents felt the positive effect of having Task Summary Chart. However, some of them pointed out that the Task List and the Burndown Chart gave more detailed information. This could be the reason why it was perceived to be not so popular:
P15:
It was a good progress breakdown of task statuses. As the pie chart gradually turned greenish, I gained a sense of progress to get the pie chart into 100% green.
P11:
I didn’t use this very much. Instead, I used the Burndown Chart and Task List.
As can be seen from these feedbacks, while Focus List supports Appraising construct of Affective dimension of self-regulation, students hold mixed views that Burndown Chart supports the Judging Oneself construct. Task Summary Chart was perceived to support Monitoring and Diagnosing constructs of Metacognitive dimension of self-regulation.
Although 31.3% of the respondents did not use the Outcome Alignment and Achievement Chart, it is used by some respondents to view LO coverage and to benchmark their performance. A teacher commented:
P6:
It helped me to see the LO coverage and to ensure my unit has a good coverage of the intended LOs.
Two student respondents in the focus group session commented:
P16:
I used this to measure myself against my class and against each grade level for each outcome. It helped me to monitor my own performance.
P11:
I am a competitive person. It motivated me for getting my triangle ahead of the average student block.
However, a student respondent indicated in the survey that:
C2:
While it was nice to be able to see how the rest of my class had gone with the tasks, coming from a relatively tough and disappointing semester, it did not help me when I saw how behind I was.
For the Outcome Alignment and Achievement Task View, 30.6% of the respondents did not used it. For those who used it, some appreciated the information it presented, whereas some students misused it. A teacher said:
P4:
This was useful in reviewing task and outcome alignment for me.
Student comments include:
P10: It gave me a rough idea of the intended links between the tasks and the LOs. It helped me to justify what to include in my portfolio.
P12
: It helped me to know what tasks needed to be completed to grasp a better LO achievement in attaining my learning goal.
C3:
I only used it to fulfil my obligation to pointlessly number the tasks when filling out the portfolio.
P14:
I don’t care about learning outcomes. This is because the learning outcomes had been in-built in the course.
P9:
I regularly used the Target Grade Setting visualization, Task List, Focus List, Task Summary Chart, Burndown Chart and Outcome Alignment and Achievement visualizations. It was handy for gaining a sense of task counts, workload, and overall how much I had progressed and achieved through the unit for the target grade I had chosen. They were related. They helped me to see, reflect and improve my work.
Students hold different views that Outcome Alignment and Achievement Chart helps them to utilise Expecting construct of Affective dimension. Similarly, they also hold mixed views that Outcome Alignment and Achievement Task View supports Orienting and Planning of Metacognitive dimension.
Task List and Burndown Chart were perceived to be two most useful visualization to monitor performance. Other visualizations were not as popular but each was used for a specific purpose or by a specific group of users. For example, Focus List was designed to guide weak students to stay on track and was perceived useful by 80.6% of the respondents. However, it was not as popular as Task List and Burndown Chart, in which 11.2% reported that they did not use it. The results show that visualizations that were used to track learning task status and progress (Task List, Focus List and Burndown Chart) were more popular and perceived more useful than visualizations for presenting learning outcome achievements (Outcome Alignment and Achievement and Outcome Alignment and Achievement Task View). Following task completion, three out of the nine student respondents in the focus group session said they perceived that they had attained the planned learning outcomes.
One important insight gained from the results is a weak student was doubtful about the use of the tool to manage learning. This opens up further research work on key self-regulatory skills needed for students with different learning styles to possess high level self-regulatory skills to effectively manage their learning. In fact, self-regulatory learning comprises a wide range of constructs that can impact the way different learners manage their learning to gain positive outcomes in learning (Panadero, Citation2017), and good design of learning environment is crucial to influence students to self-regulate effectively (Evans, Rutherford, Vieira, & Erasmus+ team, 2021). In general, the tool was perceived to prompt students to utilize both Metacognitive and Affective dimensions of self-regulation.
Visualisations supporting self-reflection visualisation
The last phase of the self-regulation cyclical process is the self-reflection phase. Doubtfire++ uses a Task Alignment Rating () is used to facilitate student self-reflection.
Figure 13. Task alignment rating for facilitating student self-reflection.
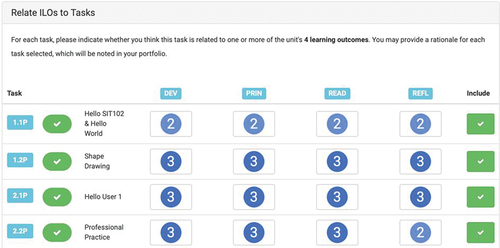
The numbers in the blue circle in encode the weighting of a particular learning outcome in an assessment task. It was designed for students to perform reflection of their learning progress and learning outcome achievements. Students can click on the ratings to indicate which learning outcomes and to what extend they have grasped the learning outcomes from the assessment tasks. The upload button on the right enables students to include their assessment tasks as evidence of their achievements. These reflection data help the teaching staff to investigate any possible misalignment of assessment tasks and learning outcomes.
Visualisations supporting self-reflection evaluation
illustrates user usage and their perceived usefulness of Task Alignment Rating in supporting student self-reflection.
Figure 14. User usage and usefulness rating for the task alignment rating.
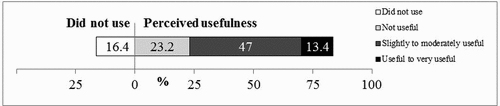
This indicates that quite a number of the respondents (16.4%) did not use it, whereas 23.2% who used it did not find it useful at all. Only 13.4% said it was useful. The majority (47%) rated it slightly to moderately useful. From the teacher perspective, they felt that:
P1:
The data captured was actually very interesting as an exercise to think through how the tasks I had planned relate to the unit learning outcomes.
A tutor suggested:
P2:
It would be more useful to students if they used it to reflect upon each task submission rather than during portfolio submission. This is because their minds are still fresh with the task and can better justify their work.
Depending on students’ attitudes towards learning outcomes and self-reflection, divergent comments were received from the student respondents. They said:
P15:
It made you think about what you had learned from each task. It was good to reflect on your learning but it was not always used to its full purpose. This is because everyone was busy at the end of the semester and tended to put less effort on it.
P8:
I am more task-oriented rather than outcome-oriented. I only used this tool simply because it has to be used for the portfolio.
The Task Alignment Rating that was designed to facilitate student self-reflection. While 16.4% of the respondents did not use it, 23.2% thought that it was not useful. One of the teaching staff respondents pointed out that the way it was designed and the time the reflection practice was conducted was inappropriate. The total number of tasks that could be linked to the number of the intended learning outcomes produced a large matrix for students to reflect, think, and click to link them up. The reflection practice became tedious for students as it was scheduled at the end of the semester when students were busy preparing for final assessments. However, 60.4% of the respondents were receptive to the idea of having it to guide student self-reflection. A teaching staff said that the data helped him to reflect on unit intended LOs. This was supported by a student respondent who used it to reflect on his learning. These results show mixed views by student respondents that Task Alignment Rating helps them to apply Judging construct of the Affective dimension of self-regulation, whereas it helps teaching staff to retrospect assessment practice to better support the Metacognitive, Cognitive, and Affective dimensions of self-regulation.
Threats to validity
It is important to note that the research respondents were recruited from self-selection sampling, which could include users who liked the tool or frequent users hence led to exaggeration of positive findings. Besides that, the respondents participated in the online survey questionnaire were from the same faculty. Also, nine of the fifteen teaching staff were tutors. They were graduate students with limited teaching experience, and little oversight responsibility for the course overall. They could have used the visualizations in different ways, or have different goals for the use of the information to more experienced teachers. In addition, in retaining anonymity of the respondents, it is unclear to what extent students had used Doubtfire++ features. Furthermore, there was a serious gender imbalance in which there were more males than females in this faculty. The gender imbalance in respondents could be representative of student groups surveyed. This potentially creates a bias limiting generalisation of findings.
Conclusions
OLM visualizations supporting students for self-regulated learning were found to guide students in taking ownership of their learning, and provided useful information about student grade aspiration, learning progress and self-reflection. Key contributions of this work include the design and development of an OLM support tool with rich visualizations for both students and teachers, aimed to support a self-regulated outcome-based learning approach. We have also identified several OLM visualizations that were perceived to assist self-regulated learning.
Teachers said that the target grade setting was used well by good or high-achieving students, but weaker students set unrealistic grade targets. As a result, two teaching staff had to intervene in the middle of the semester to remind students in setting an appropriate target to achieve. Only students who actively adjusted their target based on their current status and progress would benefit from it, helping them to better plan their workload and time. Respondents generally perceived that the visualizations for tracking learning progress were essential to guide and drive student task completion. This signifies the need to create awareness among students about the importance of learning outcomes in guiding them to build their strengths and identify areas for their growth. Another key finding is that users actually interacted with multiple visualizations. This corroborates with the findings from other OLM research that multiple progress representations are helpful. Our Doubtfire++ visualisations aid self-reflection were found to help support self-reflection practices. Further research is needed to explore how to conduct the self-reflection practice to benefit both the students and staff. It also suggests exploring simpler visualization designs to ease self-reflection process. Overall, Doubtfire++ visualizations support students to utilize metacognitive, cognitive, and affective strategies to manage learning and teaching staff felt supported to be able to relook into assessment practice to better support student engagement in self-regulated learning.
Our research raises a number of implications for expanding its application to a broader context. Doubtfire++ could be made more dynamic by enhancing it with technology-based personalisation intervention to better guide students in setting a realistic target grade or be motivated to engage with their learning. A leader board ranking visualization could be used to encourage both high achievers to excel and low achievers to better engage in their learning. More robust information visualization techniques could be used to enhance Doubtfire++ to better facilitate self-regulated learning, especially in self-reflection phases for learners to use different self-regulated strategies or combination of strategies, and for the constructive alignment practice to be fully understood and embraced by students.
Acknowledgments
We gratefully acknowledge the financial support from Multimedia University and Swinburne University of Technology. We thank all the respondents for their participation and reviewers for their valuable comments. Grundy is supported by ARC Laureate Fellowship FL190100035.
Disclosure statement
No potential conflict of interest was reported by the author(s).
References
- Baber, H. (2020). Determinants of students’ perceived learning outcome and satisfaction in online learning during the pandemic of COVID19. Journal of Education and E-Learning Research, 7(3), 285–24. doi:10.20448/journal.509.2020.73.285.292
- Biggs, J. (2014). Constructive alignment in university teaching. HERDSA Review of Higher Education, 1, 5–22.
- Bodily, R., Kay, J., Aleven, V., Jivet, I., Davis, D., Xhakaj, F., & Verbert, K. (2018). Open learner models and learning analytics dashboards: A systematic review. In 8th International Conference on Learning Analytics and Knowledge (pp. 41–50). ACM. doi:10.1145/3170358.3170409
- Bolliger, D., & Shepherd, C. (2010). Student perceptions of ePortfolio integration in online courses. Distance Education, 31(3), 295–314. doi:10.1080/01587919.2010.513955
- Bull, S., Gakhal, I., Grundy, D., Johnson, M., Mabbott, A., & Xu, J. (2010). Preferences in multiple-view open learner models. In M. Wolpers, P. Kirschner, M. Scheffel, S. Lindstaedt, & V. Dimitrova Eds., (pp. 476–481). Springer Berlin Heidelberg. doi:10.1007/978-3-642-16020-2_40
- Bull, S., & Gardner, P. (2009). Highlighting learning across a degree with an independent open learner model. Artificial Intelligence in Education: Building Learning Systems That Care: From Knowledge Representation to Affective Modelling (AIED), 200, 275–282.
- Bull, S., Johnson, M., Alotaibi, M., Byrne, W., & Cierniak, G. (2013). Visualising multiple data sources in an independent open learner model. In H. Lane, K. Yacef, J. Mostow, & P. Pavlik (Eds.), Artificial Intelligence in Education (pp. 199–208). Memphis, United St: Springer Berlin Heidelberg. doi:10.1007/978-3-642-39112-5_21
- Bull, S., & Kay, J. (2013). Open learner models as drivers for metacognitive processes. In R. Azevedo & V. Aleven (Eds.), International handbook of metacognition and learning technologies (pp. 349–365). New York: Springer New York. doi:10.1007/978-1-4419-5546-3_23
- Bull, S., & Kay, J. (2016). SMILI☺: A framework for interfaces to learning data in open learner models, learning analytics and related fields. International Journal of Artificial Intelligence in Education, 26(1), 293–331. doi:10.1007/s40593-015-0090-8
- Bull, S., Wasson, B., Kickmeier-Rust, M., Johnson, M., Moe, E., Hansen, C., & MeisslEgghart, G. (2012). Assessing English as a second language: From classroom data to a competence-based open learner model. In Proc. International Conference on Computers in Education, 26-30 November 2012, Singapore (pp. 618–622).
- Cain, A. (2013). Constructive alignment for Introductory Programming [ Thesis]. Australia.
- Chynał, P., Kozierkiewicz-Hetmańska, A., & Piet, M. (2017). Personalisation of learning process in intelligent tutoring systems using behavioural measures. In Multimedia and network information systems (pp. 407–417). Heidelberg: Springer International Publishing. doi:10.1007/978-3-319-43982-2_35
- Conati, C., Porayska-Pomsta, K., & Mavrikis, M. (2018). AI in education needs interpretable machine learning: Lessons from open learner modelling. arXiv preprint arXiv:180700154.
- Conejo, R., Trella, M., Cruces, I., & Garcia, R. (2011). INGRID: A web service tool for hierarchical open learner model visualization. Adjunct Proc (UMAP) Poster and Demo Track, Advances in User Modeling. 11-15 July 2011 Girona, Spain (pp. 406–409).
- Evans, C. (2014). Exploring the use of a deep approach to learning with students in the process of learning to teach in D. In V.D. Gijbels, Richardson, J.T.E., and Vermunt, J. Eds., Learning patterns in higher education. Dimensions and research perspectives (pp. 187–213). London and New York: Routledge. EARLI Book Series
- Evans, C., with Rutherford, S., Vieira, F., Erasmus+ team. (2021). A self-regulatory approach to assessment. Cardiff: Cardiff University.
- Guerra, J., Hosseini, R., Somyurek, S., & Brusilovsky, P. (2016). An intelligent interface for learning content: Combining an open learner model and social comparison to support self-regulated learning and engagement. 21st International Conference on Intelligent User Interfaces, 7–10 March 2016, Sonoma, California (pp. 152–163).
- Hofer, B., Yu, S., & Pintrich, P. (1998). Teaching college students to be self-regulated learners. In D. Schunk & B. Zimmerman (Eds.), Self-regulated learning: from teaching to self-reflective practice (pp. 57–85). New York: Guilford Press.
- Hsiao, I., Bakalov, F., Brusilovsky, P., & König-Ries, B. (2011). Open social student modeling: Visualizing student models with parallel introspectiveviews. International Conference on User Modeling, Adaptation, and Personalization (pp. 171–182). doi:10.1007/978-3-642-22362-4_15
- Kay, J., Kummerfeld, B., & Lauder, P. (2002). Personis: A server for user models. In P.D. Bra, P. Brusilovsky, & R. Conejo (Eds.), LNCS 2347 Adaptive Hypermedia and Adaptive Web Based Systems, Second Int. Conference (pp. 203–212). Springer.
- Kelly, K., & Heffernan, N. (2015). Developing self-regulated learners through an intelligent tutoring system. International Conference on Artificial Intelligence in Education, 22-26 June 2015, Madrid, Spain (pp. 840–843).
- Khosravi, H., Demartini, G., Sadiq, S., & Gasevic, D. (2021). Charting the design and analytics agenda of learnersourcing systems. LAK21: 11th International Learning Analytics and Knowledge Conference, 12-16 April 2021, Irvine, CA, USA (pp. 32–42).
- Kizilcec, R., Pérez-Sanagustín, M., & Mal, J. (2017). Self-regulated learning strategies predict learner behavior and goal attainment in massive open online courses. Computers & Education, 104, 18–33. doi:10.1016/j.compedu.2016.10.001
- Lee, D., Watson, S., & Watson, W. (2019). Systematic literature review on self-regulated learning in massive open online courses. Australasian Journal of Educational Technology, 35(1), 28–41. doi:10.14742/ajet.3749
- Liu, S., Cui, W., Wu, Y., & Liu, M. (2014). A survey on information visualization: Recent advances and challenges. The Visual Computer, 30(12), 1373–1393. doi:10.1007/s00371-013-0892-3
- Long, Y., & Aleven, V. (2017). Enhancing learning outcomes through self-regulated learning support with an open learner model. User Modeling and User-Adapted Interaction, 27(1), 55–88. doi:10.1007/s11257-016-9186-6
- López-Crespo, G., Blanco-Gandía, M., Valdivia-Salas, S., Fidalgo, C., & Sánchez-Pérez, N. (2022). The educational e-portfolio: Preliminary evidence of its relationship with student’s self-efficacy and engagement. Education and Information Technologies, 27(4), 5233–5248. doi:10.1007/s10639-021-10827-2
- Mabbott, A., & Bull, S. (2004). Alternative views on knowledge: Presentation of open learner models. In J. Lester, R. Vicari, & F. Paraguacu (Eds.), Intelligent Tutoring Systems: 7th International Conference ITS (pp. 689–698). Springer.
- Mahasneh, O. (2020). A proposed model for the university students’ e-portfolio. Journal of Education and E-Learning Research, 7, 28–33. doi:10.20448/journal.509.2020.71.28.33
- Mahmood, S. (2021). Instructional strategies for online teaching in COVID-19 pandemic. Human Behavior and Emerging Technologies, 3(1), 199–203. doi:10.1002/hbe2.218
- Panadero, E. (2017). A review of self-regulated learning: Six models and four directions for research. Frontiers in Psychology, 8, 422. doi:10.3389/fpsyg.2017.00422
- Pérez-Álvarez, R., Maldonado-Mahauad, J., & Pérez-Sanagustín, M. (2018). Tools to support self-regulated learning in online environments: Literature review. In V. Pammer-Schindler, M. Pérez-Sanagustín, H. Drachsler, R. Elferink, & M. Scheffel (Eds.), Lifelong technology-enhanced learning (pp. 16–30). Switzerland: Springer. doi:10.1007/978-3-319-98572-5_2
- Schunk, D. (1983). Progress self-monitoring: Effects on children’s self-efficacy and achievement. The Journal of Experimental Education, 51(2), 89–93. doi:10.1080/00220973.1982.11011845
- Schunk, D. (1989). Social cognitive theory and self-regulated learning. In B. Zimmerman & D. Schunk (Eds.), Self-regulated learning and academic achievement: Theory, research, and practice (pp. 83–110). New York: Springer Verlag. doi:10.1007/978-1-4612-3618-4_4
- Self, J. (1990). Bypassing the intractable problem of student modelling. In C. Frasson & G. Gauthier (Eds.), IntelligenT tutoring systems: At the crossroads of artificial intelligence and education (pp. 107–123). Norwood, N.J: Ablex.
- Shroff, R., Trent, J., & Ng, E. (2013). Using e-portfolios in a field experience placement: Examining student-teachers’ attitudes towards learning in relationship to personal value, control and responsibility. Australasian Journal of Educational Technology, 29. doi:10.14742/ajet.51
- Siadaty, M., Gašević, D., Jovanović, J., Pata, K., Milikić, N., Holocher-Ertl, T., Jeremić, Z., Ali, L., Giljanović, A., & Hatala, M. (2012). Self-regulated workplace learning: A pedagogical framework and semantic web-based environment. Journal of Educational Technology & Society, 15, 75–88.
- Slepcevic-Zach, P., & Stock, M. (2018). ePortfolio as a tool for reflection and self-reflection. Reflective Practice, 19(3), 291–307. doi:10.1080/14623943.2018.1437399
- Thirouard, M., Bernaert, O., Dhorne, L., Bianchi, S., Pidol, L., & Petit, Y. (2015). Learning by doing: Integrating a serious game in a MOOC to promote new skills. European MOOCs Stakeholders Summit 2015, 18-20 May 2015, Belgium (pp. 92–96).
- Vermunt, J.D., & Donche, V. (2017). A learning patterns perspective on student learning in higher education: State of the art and moving forward. Educational Psychology Review, 29(2), 269–299. doi:10.1007/s10648-017-9414-6
- Vermunt, J.D., & Verloop, N. (1999). Congruence and friction between learning and teaching. Learning and Instruction, 9(3), 257–280. doi:10.1016/S0959-4752(98)00028-0
- Zapata-Rivera, J.D. (2021). Open student modeling research and its connections to educational assessment. International Journal of Artificial Intelligence in Education, 31(3), 380–396. doi:10.1007/s40593-020-00206-2
- Zapata-Rivera, J.D., & Greer, J. (2004). Inspectable Bayesian student modelling servers in multi-agent tutoring systems. International Journal of Human-Computer Studies, 61(4), 535–563. doi:10.1016/j.ijhcs.2003.12.017
- Zimmerman, B. (2002). Becoming a self-regulated learner: An overview. Theory into Practice, 41(2), 64–70. doi:10.1207/s15430421tip4102_2
- Zimmerman, B., & Campillo, M. (2003). Motivating self-regulated problem solvers. In J. Davidson & R. Sternberg (Eds.), The psychology of problem solving (pp. 233–262). UK: Cabidge niversity Press. doi:10.1017/CBO9780511615771.009