
Abstract
Pimelodus maculatus is an important commercial fish found in the São Francisco and Paraná river basins. NGS was used to sequence the mtDNA of P. maculatus. The mtDNA was annotated and aligned with that of 25 other fish species to enable phylogenetic analysis. The complete mtDNA molecule had 16,561 bp and its GC content was 43.7%; the structure was similar to that of other vertebrates: 2 rRNA, 22 tRNA, 13 protein-coding genes, and a D-loop region containing 914 bp. Phylogenetic analysis yielded a tree with a high bootstrap coefficient that was coherent with the actual phylogeny of the species.
Pimelodidae is the richest family in the order Siluriformes and it is composed of 90 valid species described throughout South America. The majority of pimelodid species are endemic to the neotropics; Pimelodus maculatus is distributed in Brazil throughout the Paraná River Basin (PRB) and the São Francisco River Basin (SFRB). Commonly known as ‘yellow-mandi catfish’ or ‘mandi amarelo’, P. maculatus is a migratory fish with socioeconomic relevance based on its size (maximum standard length, 36 cm) (Lundberg & Littmann Citation2003) and its frequency in artisanal fisheries in PRB and SFRB (Franco de Camargo & Petrere Citation2001; Agostinho & Gomes Citation2002). Thus, it is not listed as threatened or vulnerable species on the International Union for Conservation of Nature and Natural Resources Red List (IUCN Citation2016) or in Brazilian laws (MMA Citation2014).
Several genetic studies of partial mitochondrial and nuclear regions of P. maculatus have found a high degree of genetic diversity among populations (Garcia & Moreira Filho Citation2005; Paiva & Kalapothakis Citation2008; Carvalho et al. Citation2011; Lundberg et al. Citation2011; Pereira et al. Citation2011; Ribolli et al. Citation2012; Ferreira et al. Citation2014; Frantine-Silva et al. Citation2015). Here, we provide the first description of the complete mitochondrial DNA (mtDNA) sequence for P. maculatus, which could support the development of molecular markers studies to aid wildlife forensics, evolutionary approaches, and conservation and management studies.
One P. maculatus specimen was collected in the SFRB, Minas Gerais, Brazil (19°57′07″S, 44°20′34″W). Muscle tissue was extracted and stored at the Tissue and DNA Collection facility of the Universidade Federal de Minas Gerais (deposit code: UFMG-BDT-PP000006). A genomic library was constructed using the Nextera DNA Library Preparation kit (Illumina Inc., San Diego, CA) and sequenced using a MiSeq sequencer (Illumina), with a paired-end 300 bp strategy. The CLC Workbench software (ver. 9.0; CLC Bio-Qiagen, Aarhus, Denmark) was used for de novo assembly, and the mitochondrial genome was annotated and analyzed using the MitoFish webserver (Iwasaki et al. Citation2013). Complete mtDNA sequences from 25 other species, available from GenBank, were aligned to enable phylogenetic analysis with the MEGA software (version 7.0.14; Kumar et al. Citation2016), using a maximum likelihood method with 1000 bootstrap replications and the Tamura–Nei model (Tamura & Nei Citation1993) for nucleotide substitution ().
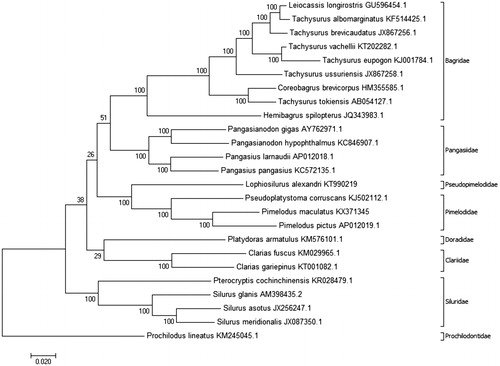
Figure 1. Molecular phylogenetic analysis inferred using the maximum likelihood method based on the Tamura–Nei model (Tamura & Nei Citation1993) with 1000 bootstrap replications. The analysis was carried out using complete mtDNA of Pimelodus maculatus (GenBank accession no. KX371345) and complete mtDNA of 25 other species: Leiocassis longirostris (GU596454.1), Tachysurus albomarginatus (KF514425.1), Tachysurus brevicaudatus (JX867256.1), Tachysurus vachellii (KT202282.1), Tachysurus eupogon (KJ001784.1), Tachysurus ussuriensis (JX867258.1), Coreobagrus brevicorpus (HM355585.1), Tachysurus tokiensis (AB054127.1), Hemibagrus spilopterus (JQ343983.1), Pangasianodon gigas (AY762971.1), Pangasianodon hypophthalmus (KC846907.1), Pangasius larnaudii (AP012018.1), Pangasius pangasius (KC572135.1), Lophiosilurus alexandri (KT990219), Pseudoplatystoma corruscans (KJ502112.1), Pimelodus pictus (AP012019.1), Platydoras armatulus (KM576101.1), Clarias fuscus (KM029965.1), Clarias gariepinus (KT001082.1), Pterocryptis cochinchinensis (KR028479.1), Silurus glanis (AM398435.2), Silurus asotus (JX256247.1), Silurus meridionalis (JX087350.1), and Prochilodus lineatus (KM245045.1). The phylogenetic tree with the highest log likelihood is shown, with the percentages of trees in which associated taxa clustered together shown next to the branches. The phylogenetic tree was rooted with P. lineatus (Characiformes, Prochilodontidae). The D-loop region was excluded from this analysis because it is considered to be highly variable (Gonder et al. Citation2007). The phylogenetic tree obtained was coherent with the phylogenetic studies of Sullivan et al. (Citation2006, Citation2013) and Lundberg et al. (Citation2011), which grouped species in their respective families; Pimelodidae and Pseudopimelodidae were grouped together in the superfamily Pimelodoidea. The analyses were conducted using MEGA7 software (Kumar et al. Citation2016).
The mtDNA sequence (16,561 bp, 514.9 folds of coverage) was deposited in GenBank (accession no. KX371345). The GC content of the sequence was 43.7% and the base frequencies were 31.2% A, 15.5% G, 25.0% T, and 28.2% C. The structure has 2 rRNAs, 22 tRNAs, 13 protein-coding genes, and a 914-bp D-loop. The ND6 gene and regions tRNA-Ala, t-RNA-Asn, tRNA-Cys, tRNA-Tyr, tRNA-Ser, tRNA-Glu, and tRNA-Pro were coded on the light strand. The other genes, tRNA and rRNA, were coded on the heavy strand. Seven regions (ND2, COII, Atp6, COIII, ND3, ND4, and Cyt b) had incomplete stop codons, which were completed in post-transcriptional polyadenylation (Ojala et al. Citation1981), and four tRNAs had different anticodons (UAA and UAG to leucine, and UGA and GCU to serine).
Disclosure statement
The authors report no conflict of interest.
Funding
Financial support was provided by CAPES [Edital Ci^encias Forenses no. 25/2014] and CEMIG project PD455.
References
- Agostinho AA, Gomes LC. 2002. Biodiversity and fisheries management in the Paraná River Basin: successes and failures. In: World Fisheries Trust (Org.). The Blue Millennium Project: managing fisheries for biodiversity. Victoria, BC: World Fisheries Trust-CRDI – UNEP; p. 1–30.
- Carvalho DC, Oliveira DAA, Pompeu PS, Leal CG, Oliveira C, Hanner R. 2011. Deep barcode divergence in Brazilian freshwater fishes: the case of the São Francisco River basin. Mitochindrial DNA. 22:80–86.
- Ferreira M, Bressane KCO, Moresco ARC, Moreira-Filho O, Almeida-Toledo LF, Garcia C. 2014. Comparative application of direct sequencing, PCR-RFLP, and cytogenetic markers in the genetic characterization of Pimelodus (Siluriformes: Pimelodidae) species: possible implications for fish conservation. Genet Mol Res. 13:4529–4544.
- Franco de Camargo SA, Petrere M. Jr 2001. Social and financial aspects of the artisanal fisheries of Middle São Francisco River, Minas Gerais, Brazil. Fisheries Manag Ecol. 8:163–171.
- Frantine-Silva W, Sofia SH, Orsi ML, Almeida FS. 2015. DNA barcoding of freshwater ichthyoplankton in the Neotropics as a tool for ecological monitoring. Mol Ecol Resour. 15:1226–1237.
- Garcia C, Moreira Filho O. 2005. Cytogenetical analyses in three fish species of the genus Pimelodus (Siluriformes: Pimelodidae) from rio São Francisco: considerations about the kariotypical evolution in the genus. Neotrop Ichthyol. 3:285–290.
- Gonder MK, Mortensen HM, Reed FA, Sousa A, Tishkoff SA. 2007. Whole-mtDNA genome sequence analysis of ancient African lineages. Mol Biol Evol. 24:757–768.
- IUCN. 2016. The IUCN Red List of Threatened Species. Version 2015-4 [Internet]; [cited 2016 Jun 10]. Available from: www.iucnredlist.org.
- Iwasaki W, Fukunaga T, Isagozawa R, Yamada K, Maeda Y, Satoh TP, Sado T, Mabuchi K, Takeshima H, Miya M, Nishida M. 2013. MitoFish and MitoAnnotator: a mitochondrial genome database of fish with an accurate and automatic annotation pipeline. Mol Biol Evol. 30:2531–2540.
- Kumar S, Stecher G, Tamura K. 2016. MEGA7: Molecular Evolutionary Genetics Analysis version 7.0 for bigger datasets. Mol Biol Evol. 33:1870–1874.
- Lundberg JG, Littmann MW. 2003. Family Pimelodidae. In: Reis RE, Kullander SO, Ferraris Jr CJ, editors. 2003. Checklist of the freshwater fishes of South and Central America. Porto Alegre: EDIPUCRS; p. 432–446.
- Lundberg JG, Sullivan JP, Hardman M. 2011. Phylogenetics of the South American catfish family Pimelodidae (Teleostei:Siluriformes) using nuclear and mitochondrial gene sequences. Proc Acad Nat Sci Philadelphia. 161:153–189.
- MMA. 2014. Portaria do Ministério do Meio Ambiente n.° 445, de 17 dezembro de 2014. Lista Nacional Oficial de Espécies da Fauna Ameaçadas de Extinção – Peixes e Invertebrados Aquáticos. Brasília: Brasil.
- Ojala D, Montoya J, Attardi G. 1981. tRNA punctuation model of RNA processing in human mitochondria. Nature. 290:470–474.
- Paiva ALB, Kalapothakis E. 2008. Isolation and characterization of microsatellite loci in Pimelodus maculatus (Siluriformes: Pimelodidae). Mol Ecol Resour. 8:1078–1080.
- Pereira LHG, Maia GMG, Hanner R, Foresti F, Oliveira C. 2011. DNA barcodes discriminate freshwater fishes from the Paraíba do Sul River Basin, São Paulo, Brazil. Mitochindrial DNA. 22(S1): 71–79.
- Ribolli J, Melo CMR, Zaniboni-Filho E. 2012. Genetic characterization of the Neotropical catfish Pimelodus maculatus (Pimelodidae, Siluriformes) in the Upper Uruguay River. Genet Mol Biol. 35:761–769.
- Sullivan JP, Lundberg JG, Hardman M. 2006. A phylogenetic analysis of the major groups of catfishes (Teleostei: Siluriformes) using rag1 and rag2 nuclear gene sequences. Mol Phylogenet Evol. 41:636–662.
- Sullivan JP, Muriel-Cunha J, Lundberg JG. 2013. Phylogenetic relationships and molecular dating of the major groups of catfishes of the Neotropical Superfamily Pimelodoidea (Teleostei, Siluriformes). Proc Acad Nat Sci Philadelphia. 162:89–110.
- Tamura K, Nei M. 1993. Estimation of the number of nucleotide substitutions in the control region of mitochondrial DNA in humans and chimpanzees. Mol Biol Evol. 10:512–526.