
Abstract
Large-scale molecular phylogenetic studies of the avian order Strigiformes have been performed, and numerous mitochondrial genomes have been determined. However, their intergeneric relationships are still controversial, and few comprehensive comparative analyses of mitochondrial genomes have been conducted on Strigiformes. In this study, the mitochondrial genome of Otus lettia was determined and compared with other Strigiformes. The O. lettia mitochondrial genome was 16,951 bp in size. For Strigiformes, atp8 can be used as a suitable molecular marker for population genetic diversity, while cox1 is a candidate barcoding marker for species identification. All protein-coding genes may be under strong purifying selection pressure, and one extra cytosine insertion located in nad3 is common to all owls except Tyto longimembris, T. alba, and Athene noctua. Four different mitochondrial gene arrangement types were found among the Strigiformes mitogenomes, and their evolutionary relationship between each other can be perfectly explained by the tandem duplication and random loss model. The phylogenetic topologies using the mitochondrial genomes showed that target species O. lettia had a closer relationship with O. scops + O. sunia than O. bakkamoena, the genus Glaucidium was paraphyletic, and the Ninox clade was located at the basal position of Strigidae lineage. Our phylogenetic trees also supported the previous recommendations that Sceloglaux albifacies, Ciccaba nigrolineata, and Ketupa flavipes should be transferred to Ninox, Strix, and Bubo, respectively. These findings will be helpful in further unraveling the mitochondrial evolution and phylogeny of Strigiformes.
1. Introduction
Birds are primarily diurnal, but one notable exception is the nocturnal owls (Aves: Strigiformes) (Zhou et al. Citation2019b). Owls display a cosmopolitan distribution (except the Antarctic, most of Greenland, and some remote islands) (Wink et al. Citation2009; Zhou et al. Citation2019b). According to the latest data, the order Strigiformes comprises more than 240 recognized species assigned to two families: Tytonidae (barn owls) and Strigidae (typical owls) (Handbook of the Birds of the World and BirdLife International Citation2019; Gill et al. Citation2021). Although recent large-scale molecular phylogenetic studies have been performed on the Strigiformes, most of them relied on a single or few markers (Wink and Heidrich Citation2000; Wink et al. Citation2009; Sun et al. Citation2016; Zhang et al. Citation2016), moreover, the intergeneric relationships inferred by these studies remain controversial (Wink et al. Citation2009; Kang et al. Citation2018; Lee et al. Citation2018; Spiridonova and Surmach Citation2018; Park et al. Citation2019a, Citation2019b; Zhou et al. Citation2019a; Sun et al. Citation2020; Zhong et al. Citation2020), and extensive paraphyly was revealed in Strigidae (Salter et al. Citation2020; Sun et al. Citation2020). Therefore, the phylogenetic relationships of Strigiformes species still need further studies.
Owing to several features, including multiple copies in a cell, extremely compact gene packing, maternal inheritance, low sequence recombination, and generally rapid evolutionary rates, mitochondrial genome (mitogenome) has been used extensively in studies of phylogenetic relationship and comparative genome (Liu et al. Citation2014; Yan et al. Citation2017; Sun et al. Citation2020). Dozens of Strigiformes mitogenomes have been deposited in the GenBank now, and many studies have successively reported their characteristics (Zhang et al. Citation2016; Zhong et al. Citation2020). Meanwhile, several mitochondrial gene arrangement orders have been found, such as duplicated control regions (Hanna et al. Citation2017; Kang et al. Citation2018). Comparative mitogenomic analyses among multiple related species can provide sufficient sequence data (e.g. gene organization, arrangement, and codon usage) and it is of great significance for understanding biodiversity and evolution (Bondarenko et al. Citation2019). Yet, few comprehensive comparative mitogenome analyses have been performed on Strigiformes. Hanna et al. (Citation2017) confirmed the presence of a duplicated control region in Strigiformes mitogenome for the first time, Kang et al. (Citation2018) conducted the mitochondrial gene rearrangements analyses of Strigidae for the first time and determined four gene orders. As more Strigiformes mitogenomes are sequenced, will we find more novel rearrangement types?
In this study, we sequenced the mitogenome of the Collared Scops Owl (Otus lettia), which is listed as National Class II Key Protected Wild Animals in China. Based on our new data together with the other 32 available Strigiformes mitogenomes from GenBank, we aimed to: (i) determine the comparative mitogenomic features of owls, including genome size, nucleotide composition, nucleotide diversity, gene evolutionary rate, features of a protein-coding gene, and gene arrangement; (ii) reconstruct the phylogenetic relationships for owls using mitogenomes.
2. Materials and methods
2.1. Specimen collection and DNA extraction
The sample used in this experiment was an illegally hunted owl (Location: Zhaotong City, Yunnan Province, China), and it was confiscated by the forest police and identified as Otus lettia erythrocampe by morphological characters and molecular identification. The forest police provided us with a few individual feathers for this study, which we then preserved in 95% ethanol (Specimen ID PB2019-211-1, presently stored at the Chengdu Research Base of Giant Panda Breeding, contact person Jiaojiao Yu, email [email protected]). Genomic DNA was extracted from the feather samples using the QIAGEN® DNeasy Blood and Tissue Kit, following the manufacturer’s instructions.
2.2. DNA amplification and sequencing
Overlapping fragments were amplified by the ordinary PCR method. PCR primer sets were chosen from a previous study (Sorenson et al. Citation1999). Reaction volumes and cycling conditions of PCR were shown in Supplementary Table 1 and Supplementary Figure 1, respectively. The DNA purification and sequencing were carried out as previously described by Liu et al. (Citation2019). The sequences were checked using Chromas (http://technelysium.com.au/) and assembled using SeqMan from the DNASTAR Lasergene package (https://www.dnastar.com/), then checked manually.
2.3. Genome annotation
The preliminary predictions of mitochondrial ribosomal RNA genes (rRNAs), transfer RNA genes (tRNAs), protein-coding genes (PCGs) and control region (D-loop), and the definitions of gene boundaries were carried out using MITOS (http://mitos2.bioinf.uni-leipzig.de/index.py) (Bernt et al. Citation2013) and MitoAnnotator (http://mitofish.aori.u-tokyo.ac.jp/annotation/input.html) (Iwasaki et al. Citation2013). The PCGs were rechecked using NCBI ORFfinder (http://www.ncbi.nlm.nih.gov/gorf/gorf.html). The tRNAs were further confirmed with ARWEN (http://mbio-serv2.mbioekol.lu.se/ARWEN/) (Canbäck and Laslett Citation2008) and tRNAscan-SE (http://lowelab.ucsc.edu/tRNAscan-SE/) (Lowe and Chan Citation2016) via their proposed cloverleaf secondary structures and anticodon sequences. Additionally, all results were verified via alignment with their closely related species’ homologs to further improve the genome annotation. The mitogenome map was drawn by the online tool CGView Server (http://cgview.ca/) (Grant and Stothard Citation2008).
2.4. Data acquisition and processing
Over 50 Strigiformes mitogenomes have been deposited in GenBank now, but many of them belong to the same species, thus we retrieved 32 representative mitogenomes belonging to 27 species (). The taxonomic classification of all species was following the current version of HBW and BirdLife Taxonomic Checklist (Handbook of the Birds of the World and BirdLife International Citation2019). Our preliminary investigation found that the annotations of nad3 genes in the sequences KP889214 and MG916810 were inconsistent with the descriptions of their corresponding studies (Zhang et al. Citation2016; Lee et al. Citation2018). Thus, we re-annotated all the nad3 genes from all retrieved Strigiformes mitogenomes. Finally, we found nad3 sequences of 12 mitogenomes showing differences between original annotation and re-annotation results. The comparison of the original annotation and re-annotation results of these 12 sequences were shown in Supplementary Table 2.
Table 1. Mitogenome sequences were used in this study.
2.5. Comparative mitogenomic analyses
Twenty-nine mitogenome sequences were used in the comparative genome analyses (). The nucleotide composition and substitution were calculated using MEGA X (Kumar et al. Citation2018). The nucleotide skew was measured using the formulas ‘AT-skew = (A − T)/(A + T)’ and ‘GC-skew = (G − C)/(G + C)’ (Perna and Kocher Citation1995). The nucleotide polymorphism and the ratios of non-synonymous substitutions rate (Ka) to synonymous substitutions rate (Ks) for each PCG among Strigiformes mitogenomes were estimated by DnaSP (Rozas et al. Citation2017).
2.6. Molecular phylogenetic analyses
The phylogeny of 33 Strigiformes species was constructed using two rRNAs and 10 PCGs excluding nad6, atp8, and cytb due to unverified nad6 in Ciccaba nigrolineata MN356178 and Strix aluco MN122823, atp8 in Athene noctua MN651450, cytb in Strix leptogrammica KC953095 (). According to genome-scale phylogeny results (Prum et al. Citation2015), the Coliiformes species Urocolius indicus and Colius striatus were chosen as the outgroups.
The rRNAs sequences were aligned in batches with MAFFT (Katoh and Standley Citation2013) integrated into PhyloSuite (Zhang et al. Citation2020), using ‘–auto’ strategy and ‘normal’ alignment mode. The PCGs sequences were aligned with the codon-aware program MACSE (Ranwez et al. Citation2018) integrated into PhyloSuite (Zhang et al. Citation2020), based on ‘Vertebrate mitochondrial genetic code.’ Subsequently, gap sites were recognized and removed with trimAl (Capella-Gutiérrez et al. Citation2009) integrated into PhyloSuite (Zhang et al. Citation2020), using the ‘automated1’ command. Finally, the trimmed alignments of 12 chosen genes (10 PCGs: atp6, cox1, cox2, cox3, nad1, nad2, nad3, nad4, nad4L, nad5; two rRNAs: 12S, 16S) were concatenated into two datasets using PhyloSuite (Zhang et al. Citation2020), 10PCG dataset (9531 bp) and 10PCG + 2rRNA dataset (12,017 bp), which were used for the Maximum Likelihood (ML) and Bayesian inference (BI) analyses.
The ML analyses were carried out using IQ-TREE (Minh et al. Citation2020) under Edge-linked partition style for 10,000 replicates of ultrafast bootstrap (Hoang et al. Citation2018), as well as the Shimodaira–Hasegawa–like approximate likelihood-ratio test (SH-aLRT) (Guindon et al. Citation2010). The BI phylogenies were inferred using MrBayes (Ronquist et al. Citation2012) under partition model (2 parallel runs, 10,000,000 generations, the minimum estimated sample size values were more than 100, the average standard deviation of split frequencies values were below 0.01, and the potential scale reduction factor values were close to 1.0000), in which the initial 25% of sampled data were discarded as burn-in. The partition-specific substitution model (Supplementary Table 3) was chosen by ModelFinder (Kalyaanamoorthy et al. Citation2017) integrated into PhyloSuite (Zhang et al. Citation2020) according to BIC criterion.
3. Results
3.1. Characterization of the Otus lettia mitogenome
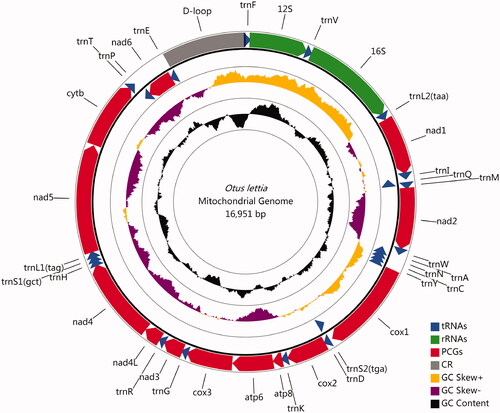
The mitogenome of O. lettia was a circular genome with 16,951 bp in size. The overall nucleotide composition was biased toward C and A (32.86% C, 30.59% A, 22.72% T, and 13.83% G), and G + C content was lower than A + T content. It included the canonical two rRNAs, 13 PCGs, 22 tRNAs, and one D-loop region (, Supplementary Table 4). Among these, only nad6 and eight tRNAs (trnQ, trnA, trnN, trnC, trnY, trnS2, trnP, and trnE) were encoded on the light strand. A total of 86 nucleotide intervals were noted at 20 locations, and a total of 29 overlapping nucleotides were dispersed at five gene junctions (Supplementary Table 4). The D-loop region of 1378 bp was located between trnE and trnF genes, and possessed an A + T content of 57.70%. A repeat pattern of 22 bp (ACACACACATACCATCCATCCA) with 2.9 tandem repeats was found at 5′-end of the D-loop region. We deposited the O. lettia mitogenome in GenBank with the accession ID MW364567.
Figure 1. The graphical visualization of Otus lettia mitogenome.
3.2. Comparative mitochondrial genome
3.2.1. Nucleotide composition
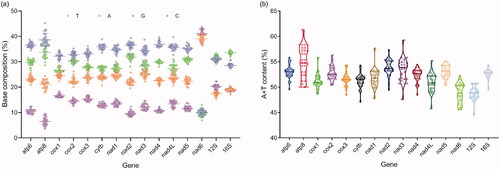
We calculated that the average genome size of 29 complete Strigiformes mitogenomes was 18,003 bp () and their overall average base composition was 23.10% T, 32.80% C, 30.32% A, and 13.78% G. For the gene region (), nad6 had more G base than the other three bases (G > T > 9.99% C ≈ 9.78% A), whereas the other 12 PCGs did the exact opposite (C > A > T > G), which was closely related to the encode strand; in addition, there was not much difference between 12S (31.46% A ≈ 30.94% C > G > T) and 16S (A > C > 19.01% T ≈ 18.87% G). More interestingly, more than 50% A + T content was observed in PCGs and rRNAs except for nad6 and 12S; atp8 had the highest A + T content (), which was also found in Charadriiformes mitogenomes (Hu et al. Citation2017).
Figure 2. The base composition (a) and A + T content (b) of 29 Strigiformes mitogenomes. Each circle represents a mitogenome.
For the nucleotide skew of Strigiformes mitochondrial genes (), nad6 showed marked negative AT-skew and positive GC-skew values, whereas rRNAs and other PCGs showed negative GC-skew and positive AT-skew values (except for AT-skew of nad1 in Athene brama KF961185, Athene noctua MN122903 and O. bakkamoena KT340631, nad4L in Asio flammeus KP889214, Strix uralensis MG681081 and S. uralensis MG681082, cox1 in O. bakkamoena KT340631 and Glaucidium brodiei KP684122, and nad3 in O. bakkamoena KT340631 was slightly negative).
3.2.2. Gene evolutionary patterns
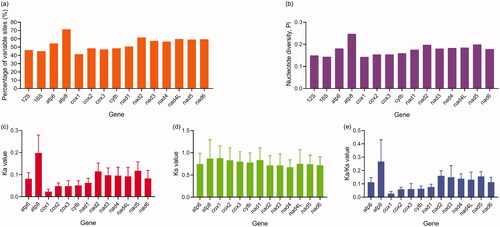
For the rRNAs and PCGs, the percentage of variable sites was from 41.38% in cox1 to 71.43% in atp8, the nucleotide diversity was from 0.14288 in cox1 to 0.24713 in atp8, there was a similar trend between the two observations (). For the PCGs, the Ka, Ks, and Ka/Ks of atp8 were the highest, while the Ka and Ka/Ks of cox1 and the Ks of nad4 were the lowest (). Obviously, differences of Ka basically reflected the differences of Ka/Ks among the 13 PCGs, which was congruent with previous studies (Hu et al. Citation2017; Bi et al. Citation2019).
Figure 3. Statistics of variation sites (a), nucleotide diversity (b), Ka (c), Ks (d), and Ka/Ks (e) of 29 Strigiformes mitogenomes.
3.2.3. Feature of nad3
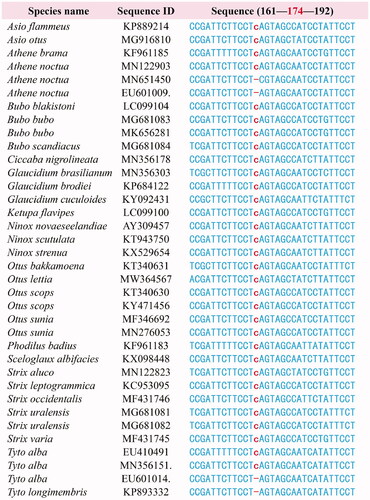
As previously reported (Mindell et al. Citation1998), we also discovered an extra cytosine insertion causing a frameshift at position 174 of nad3 gene in O. lettia mitogenome (), but we found that the nad3 cytosine insertion annotations of some other Strigiformes mitogenomes deposited in GenBank were not carried out as recommended by Mindell et al. (Citation1998). Because of this, we re-annotated them (Supplementary Table 2).
Figure 4. Alignment of the mitochondrial nad3 gene region spanning the extra cytosine insertion for Strigiformes species. Additional three nad3 sequences EU601009, MN356151, and EU601014 were used to show the intraspecific differences of inserted cytosine.
3.2.4. Mitochondrial gene rearrangements
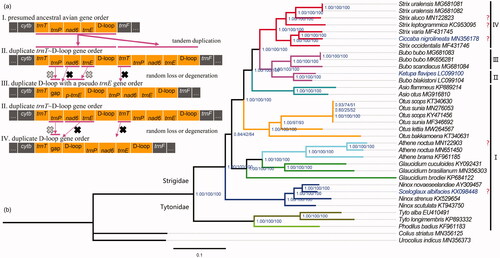
Our comparison results show that the gene reorganization was located in the fragment from cytb to trnF, and duplication of D-loop was the most prominent rearrangement feature (), indicating that the region spanning D-loop was a hotspot of Strigiformes mitogenomes rearrangement. We summarized four gene arrangement types among the Strigiformes mitogenomes (), although a few sequences (e.g. Sceloglaux albifacies KX098448, Athene noctua MN122903, Ciccaba nigrolineata MN356178, Strix leptogrammica KC953095, and Strix aluco MN122823) were not determined due to the incomplete sequencing of important fragments (e.g. the part adjacent to the D-loop). Type I, which was a typical avian gene order and considered ancestral for all Aves, so we named it the presumed ancestral avian gene order (). Type II, which was characterized by two copies of trnT-trnP-nad6-trnE-D-loop, so we called it the duplicate trnT∼D-loop gene order (). Type III was featured with a pseudo trnE (p-trnE) and duplicate D-loop, and type IV was featured with only a duplicate D-loop (). Type I was the most prevailing arrangement out of the four ones, and it was found in all Tytonidae and most Strigidae species (). Type II and III emerged in Bubo + Ketupa clade, and type IV appeared in Strix + Ciccaba clade ().
Figure 5. Strigiformes mitochondrial gene arrangement types (a) and BI and ML phylograms inferred from 10 PCGs and two rRNAs (b). The orders of the genes outside the region depicted in this figure are the same. The phylograms were visualized and annotated using FigTree (http://tree.bio.ed.ac.uk/software/figtree/). Values at nodes are Bayesian posterior probabilities, SH-aLRT bootstrap percentages, and ultrafast bootstrap percentages, respectively. I–IV denote five different gene arrangement types. ‘?’: the arrangement type is uncertain due to incomplete sequencing.
3.3. Mitochondrial phylogenomics
In this study, both ML and BI methods of both datasets (10PCG dataset and 10PCG + 2rRNA dataset) provided identical and well-supported tree topologies and indicated that all owl species grouped into two large lineages, representing two families: Tytonidae and Strigidae (, ). The Ninox clade was located at the basal position of the Strigidae lineage. The genus Glaucidium was paraphyletic. Otus lettia had a close relationship with O. scops + O. sunia. Sceloglaux albifacies, Ciccaba nigrolineata, and Ketupa flavipes were respectively nested within other genus clades, implying their classification status needs to be concerned.
4. Discussion
4.1. Comparative mitochondrial genome
The O. lettia mitogenome has many features similar to other owls, such as genome size and content, nucleotide composition, and skew. AT and GC skews are used to measure compositional asymmetry (Hu et al. Citation2017). We found nad6 of Strigiformes have negative AT-skew and positive GC-skew values, which has been observed also in Accipitriformes (Jiang et al. Citation2015, Citation2019). However, Hu et al. (Citation2017) found that there were positive AT-skew and negative GC-skew values in nad6 of 20 Charadriiformes mitogenomes. This completely opposite phenomenon caught our attention, and eventually, we detected that Hu et al. calculated the skew values of heavy strand corresponding to nad6 location.
To gain a better understanding of the evolutionary patterns of the mitochondrial gene of Strigiformes, we compared the evolutionary rate (). Based on the percentage of variable sites and nucleotide diversity, we can infer that atp8 was the most variable mitochondrial gene in Strigiformes, and cox1 was the most conserved. Without considering gene size, atp8 is suitable as a molecular marker for population genetic diversity analyses, while cox1 is a candidate barcoding marker for species identification. Moreover, in Strigiformes mitogenomes, the highest Ka/Ks value was detected for atp8 and the lowest for cox1, similarly in the Accipitriformes, Charadriiformes, and Piciformes mitogenomes (Jiang et al. Citation2015; Hu et al. Citation2017; Bi et al. Citation2019). In addition, the Ka/Ks ratios of all 13 PCGs were lower than 1, indicating they may be under strong purifying selection pressure.
Yan et al. (Citation2017) once found that the nad3 of all Strigiformes, Galliformes, and Piciformes birds had an untranslated extra cytosine insertion. Whereas some exceptions were found when more sequences were available for comparative analysis (Li et al. Citation2014; Bi et al. Citation2019), including Athene noctua (MN651450 and EU601009), Tyto alba (EU601014), and T. longimembris (KP893332) analyzed in this study (). Moreover, the presence or absence of inserted cytosine appeared to randomly happen in closely related species (Jiang et al. Citation2015; Hu et al. Citation2017), and even in the same species, such as in Chroicocephalus saundersi (Charadriiformes; KJ631624 and JQ071443), A. noctua (Strigiformes; MN122903, MN651450, and EU601009), and T. alba (Strigiformes; EU410491, MN356151, and EU601014) (). However, we cannot rule out whether the interspecies/intraspecific differences are due to mis-editing of the original sequencing files during sequence inspection, so more data are needed in order to verify this. The phenomenon of extra-base insertion was not only common in birds (Li et al. Citation2014; Jiang et al. Citation2015; Hu et al. Citation2017; Yan et al. Citation2017; Bi et al. Citation2019), but also in turtles (Mindell et al. Citation1998). Mindell et al. (Citation1998) speculated the extra-base appears to be not processed during translation. Therefore, we also speculated that the extra cytosine insertion may be the remnant of avian mitogenomes during the rapid explosive evolution (Li et al. Citation2014).
Kang et al. (Citation2018) described the Strigidae mitochondrial gene orders for the first time. Compared with them, we added more species and mitogenome sequences, aiming to explore gene rearrangement on a larger scale. Among the Strigiformes mitogenomes, we also summarized four gene arrangement types, which were identical to Kang et al. (Citation2018) (). The tandem duplication and random loss model can be used to explain most vertebrate mitogenome reorganization (Yang et al. Citation2018). Based on this model, we hypothesized the evolutionary relationship of four Strigiformes mitochondrial gene arrangement types (). Type I generated type II by one tandem duplication, then type II generated type III and type IV by random loss or degeneration. Type I was a typical avian gene order and considered ancestral for all Aves. In our study, Type I was the most prevailing gene order out of the four ones, and it was found in all Tytonidae and most Strigidae species. Type II and III emerged in Bubo + Ketupa clade, and type IV appeared in Strix + Ciccaba clade (). We confirmed that Type II has arisen in the common ancestor of Bubo + Ketupa clade and Strix + Ciccaba clade (Hanna et al. Citation2017). In type II and type III, the pseudogene trnE (p-trnE) and gap degenerated from their functional genes trnE and nad6, respectively. In contrast to trnE, p-trnE lacked anticodon triplet TTC in the anticodon loop. Kang et al. (Citation2018) reported S. leptogrammica KC953095 possessed type I and thought it was a single reversal. However, as previously reported by Hanna et al. (Citation2017), our re-annotation results noted that this sequence potentially contained significant errors in the fragment from nad5 through nad6 to trnF, so we couldn’t determine its correct rearrangement type. Moreover, for the mitochondrial gene order of S. leptogrammica, we thought the single reversal interpretation was debatable. Therefore, it is necessary to collect the samples of S. leptogrammica and re-sequence its mitogenomes in future studies.
4.2. Mitochondrial phylogenomics
Inferring phylogenetic relationships among taxa is a prerequisite for evolutionary and conservation biology studies (Delsuc et al. Citation2005). The introduction of the use of molecular data in phylogenetics had created splendid progress (Delsuc et al. Citation2005). However, information from a single gene is often insufficient to obtain robust statistical support for particular nodes of a phylogeny (Delsuc et al. Citation2005). With the development of sequencing technology, this predicament was solved by genomic data, which could provide a more credible result than a single gene (Song et al. Citation2015; Liu et al. Citation2019). In the present study, two datasets (10PCG dataset and 10PCG + 2rRNA dataset) connected from 12 mitochondrial genes were used.
Target species O. lettia had a closer relationship with O. scops + O. sunia than O. bakkamoena, which was inconsistent with previous studies based on cytb dataset (Wink et al. Citation2009; Zhang et al. Citation2016). More importantly, the taxonomic status of the three species was a matter of concern. Firstly, Sceloglaux albifacies were nested within the Ninox clade. S. albifacies was an extinct species and was once found in New Zealand. Its taxonomic issue had been widely debated (Wink et al. Citation2009). Previous molecular phylogenetic study based on mitochondrial cytb also demonstrated this species should be referred to as Ninox albifacies (Wood et al. Citation2016). Secondly, our results also showed the nested position of Ciccaba nigrolineata within genus Strix, which supports the taxonomic view (Strix nigrolineata) of the Avibase online database (Lepage et al. Citation2014) and the IOC World Bird List (Gill et al. Citation2021). Thirdly, our phylogenetic topology indicated the nested position of Ketupa flavipes within the genus Bubo clade. The scientific discussion about the genus Ketupa lasted for a long time. Earlier, the morphological study had recommended that Ketupa was incorporated into Bubo genus (Amadon and Bull Citation1988), although there were different opinions. Moreover, previous molecular phylogenetic studies based on a single gene (cytb) and the combined dataset (cytb + rag-1) had also proposed merging Ketupa into Bubo (Wink and Heidrich Citation2000; Wink et al. Citation2009). However, Spiridonova and Surmach (Citation2018) recently kept the taxonomic status of K. flavipes, K. zeylonensis, and K. ketupu, and suggested that it was more reasonable to assign B. blakistoni along with these three species to a separate Ketupa genus based on mitogenomic phylogeny. Now different taxonomic results are still used in these primary world bird lists including Avibase on-line database (Lepage et al. Citation2014), Clements Checklist (Clements et al. Citation2019), HBW and BirdLife Taxonomic Checklist (Handbook of the Birds of the World and BirdLife International Citation2019), and IOC World Bird List (Gill et al. Citation2021); for example, B. flavipes was classified into Ketupa genus by HBW and BirdLife Taxonomic Checklist referred by this study (Handbook of the Birds of the World and BirdLife International Citation2019). According to our phylogenetic topology, we supported the recommendation that merges Ketupa into Bubo.
There was no consistent systematic relationship at the genus level in previous studies. In this study, both ML and BI methods provided identical and well-supported tree topologies (, ), which are in congruence with Sun et al. (Citation2020). The Ninox clade was located at the basal position of Strigidae lineage, supporting the conclusion of Sun et al. (Citation2016) and Zhou et al. (Citation2019a), but refuting those of other studies (Wood et al. Citation2016; Spiridonova and Surmach Citation2018; Park et al. Citation2019a, Citation2019b; Zhong et al. Citation2020). In our present study and several others (Park et al. Citation2019b; Salter et al. Citation2020; Sun et al. Citation2020), the genus Glaucidium was paraphyletic. Given the considerable morphological differences and deep mitogenome divergence between G. brodiei and other Strigidae species, Spiridonova and Surmach had pointed out the need for the revision of the Glaucidium genus and its redescription as a separate family (Spiridonova and Surmach Citation2018). We recommend against such a taxonomy because this division would result in a paraphyly of the Strigidae lineage.
Author contributions
Jiaojiao Yu and Jiabin Liu: conceptualization (equal); methodology (equal); investigation (equal); data curation (equal); formal analysis (equal); visualization (equal); writing-original draft (equal); writing-review and editing (equal). Cheng Li: investigation (equal); data curation (equal); formal analysis (equal); writing-review and editing (equal). Wei Wu: resources (equal); investigation (equal); data curation (equal); writing-review and editing (equal). Feifei Feng: resources (equal); investigation (equal); writing-review and editing (equal). Qizhi Wang and Xiaofeng Ying: resources (equal); writing-review and editing (equal). Dunwu Qi: conceptualization (equal); writing-review and editing (equal); funding acquisition (supporting). Guilan Qi: conceptualization (equal); formal analysis (equal); validation (lead); project administration (lead); supervision (lead); writing-review and editing (equal). All authors contributed to and approved the final manuscript.
Acknowledgments
We would like to thank Dr. Jacob R. Owens at Los Angeles Zoo and Botanical Gardens for revising the manuscript.
Disclosure statement
The authors declare that they have no competing interests.
Additional information
Funding
References
- Amadon D, Bull JL. 1988. Hawks and owls of the world: a distributional and taxonomic list. Proc Wes Foundat Vert Zool. 3:294–357.
- Bernt M, Donath A, Jühling F, Externbrink F, Florentz C, Fritzsch G, Pütz J, Middendorf M, Stadler PF. 2013. MITOS: improved de novo metazoan mitochondrial genome annotation. Mol Phylogenet Evol. 69(2):313–319.
- Bi D, Ding H, Wang Q, Jiang L, Lu W, Wu X, Zhu R, Zeng J, Zhou S, Yang X, et al. 2019. Two new mitogenomes of Picidae (Aves, Piciformes): sequence, structure and phylogenetic analyses. Int J Biol Macromol. 133:683–692.
- Bondarenko N, Bondarenko A, Starunov V, Slyusarev G. 2019. Comparative analysis of the mitochondrial genomes of Orthonectida: insights into the evolution of an invertebrate parasite species. Mol Genet Genomics. 294(3):715–727.
- Canbäck B, Laslett D. 2008. ARWEN: a program to detect tRNA genes in metazoan mitochondrial nucleotide sequences. Bioinformatics. 24(2):172–175.
- Capella-Gutiérrez S, Silla-Martínez JM, Gabaldón T. 2009. trimAl: a tool for automated alignment trimming in large-scale phylogenetic analyses. Bioinformatics. 25(15):1972–1973.
- Clements JF, Schulenberg TS, Iliff MJ, Billerman SM, Fredericks TA, Sullivan BL, Wood CL. 2019. The eBird/Clements Checklist of Birds of the World: v2019. [accessed 2021 Mar 4]. https://www.birds.cornell.edu/clementschecklist/download/
- Delsuc F, Brinkmann H, Philippe H. 2005. Phylogenomics and the reconstruction of the tree of life. Nat Rev Genet. 6(5):361–375.
- Gill F, Donsker D, Rasmussen P. 2021. IOC World Bird List (v11.1). [accessed 2021 Mar 4]. https://www.worldbirdnames.org/new/
- Grant JR, Stothard P. 2008. The CGView server: a comparative genomics tool for circular genomes. Nucleic Acids Res. 36(Web Server issue):W181–W184.
- Guindon S, Dufayard J-F, Lefort V, Anisimova M, Hordijk W, Gascuel O. 2010. New algorithms and methods to estimate maximum-likelihood phylogenies: assessing the performance of PhyML 3.0. Syst Biol. 59(3):307–321.
- Handbook of the Birds of the World and BirdLife International. 2019. Handbook of the Birds of the World and BirdLife International digital checklist of the birds of the world: Version 4. [accessed 2021 Mar 4]. http://datazone.birdlife.org/userfiles/file/Species/Taxonomy/HBW-BirdLife_Checklist_v4_Dec19.zip
- Hanna ZR, Henderson JB, Sellas AB, Fuchs J, Bowie RCK, Dumbacher JP. 2017. Complete mitochondrial genome sequences of the northern spotted owl (Strix occidentalis caurina) and the barred owl (Strix varia; Aves: Strigiformes: Strigidae) confirm the presence of a duplicated control region. PeerJ. 5:e3901.
- Hoang DT, Chernomor O, von Haeseler A, Minh BQ, Vinh LS. 2018. UFBoot2: improving the ultrafast bootstrap approximation. Mol Biol Evol. 35(2):518–522.
- Hu C, Zhang C, Sun L, Zhang Y, Xie W, Zhang B, Chang Q. 2017. The mitochondrial genome of pin-tailed snipe Gallinago stenura, and its implications for the phylogeny of Charadriiformes. PLOS One. 12(4):e0175244.
- Iwasaki W, Fukunaga T, Isagozawa R, Yamada K, Maeda Y, Satoh TP, Sado T, Mabuchi K, Takeshima H, Miya M, et al. 2013. MitoFish and MitoAnnotator: a mitochondrial genome database of fish with an accurate and automatic annotation pipeline. Mol Biol Evol. 30(11):2531–2540.
- Jiang L, Chen J, Wang P, Ren Q, Yuan J, Qian C, Hua X, Guo Z, Zhang L, Yang J, et al. 2015. The mitochondrial genomes of Aquila fasciata and Buteo lagopus (Aves, Accipitriformes): sequence, structure and phylogenetic analyses. PLOS One. 10(8):e0136297.
- Jiang L, Peng L, Tang M, You Z, Zhang M, West A, Ruan Q, Chen W, Merilä J. 2019. Complete mitochondrial genome sequence of the Himalayan Griffon, Gyps himalayensis (Accipitriformes: Accipitridae): sequence, structure, and phylogenetic analyses. Ecol Evol. 9(15):8813–8828.
- Kalyaanamoorthy S, Minh BQ, Wong TKF, von Haeseler A, Jermiin LS. 2017. ModelFinder: fast model selection for accurate phylogenetic estimates. Nat Methods. 14(6):587–589.
- Kang H, Li B, Ma X, Xu Y. 2018. Evolutionary progression of mitochondrial gene rearrangements and phylogenetic relationships in Strigidae (Strigiformes). Gene. 674:8–14.
- Katoh K, Standley DM. 2013. MAFFT multiple sequence alignment software version 7: improvements in performance and usability. Mol Biol Evol. 30(4):772–780.
- Kumar S, Stecher G, Li M, Knyaz C, Tamura K. 2018. MEGA X: molecular evolutionary genetics analysis across computing platforms. Mol Biol Evol. 35(6):1547–1549.
- Lee M-Y, Lee S-M, Jeon HS, Lee S-H, Park J-Y, An J. 2018. Complete mitochondrial genome of the northern long-eared owl (Asio otus Linnaeus, 1758) determined using next-generation sequencing. Mitochondrial DNA Part B Resour 3(2):494–495.
- Lepage D, Vaidya G, Guralnick R. 2014. Avibase – a database system for managing and organizing taxonomic concepts. ZK. 420:117–135.
- Li X, Huang Y, Lei F. 2014. Comparative and phylogenomic analyses on mitochondrial genomes of Arborophila species. Yi Chuan. 36(9):912–920.
- Liu G, Zhou L, Li B, Zhang L. 2014. The complete mitochondrial genome of Aix galericulata and Tadorna ferruginea: bearings on their phylogenetic position in the Anseriformes. PLOS One. 9(11):e109701.
- Liu J, Yu J, Zhou M, Yang J. 2019. Complete mitochondrial genome of Japalura flaviceps: deep insights into the phylogeny and gene rearrangements of Agamidae species. Int J Biol Macromol. 125:423–431.
- Lowe TM, Chan PP. 2016. tRNAscan-SE On-line: integrating search and context for analysis of transfer RNA genes. Nucleic Acids Res. 44(W1):W54–W57.
- Mindell DP, Sorenson MD, Dimcheff DE. 1998. An extra nucleotide is not translated in mitochondrial ND3 of some birds and turtles. Mol Biol Evol. 15(11):1568–1571.
- Minh BQ, Schmidt HA, Chernomor O, Schrempf D, Woodhams MD, von Haeseler A, Lanfear R. 2020. IQ-TREE 2: new models and efficient methods for phylogenetic inference in the genomic era. Mol Biol Evol. 37(5):1530–1534.
- Park CE, Kim M-C, Ibal JCP, Pham HQ, Park HC, Shin J-H. 2019a. The complete mitochondrial genome sequence of Otus bakkamoena (Aves, Strigiformes, Strigidae). Mitochondrial DNA Part B Resour 4(1):775–776.
- Park CE, Kim M-C, Ibal JCP, Pham HQ, Park HC, Shin J-H. 2019b. The complete mitochondrial genome sequence of Otus scops (Aves, Strigiformes, Strigidae). Mitochondrial DNA Part B Resour 4(1):764–765.
- Perna NT, Kocher TD. 1995. Patterns of nucleotide composition at fourfold degenerate sites of animal mitochondrial genomes. J Mol Evol. 41(3):353–358.
- Prum RO, Berv JS, Dornburg A, Field DJ, Townsend JP, Lemmon EM, Lemmon AR. 2015. A comprehensive phylogeny of birds (Aves) using targeted next-generation DNA sequencing. Nature. 526(7574):569–573.
- Ranwez V, Douzery EJP, Cambon C, Chantret N, Delsuc F. 2018. MACSE v2: toolkit for the alignment of coding sequences accounting for frameshifts and stop codons. Mol Biol Evol. 35(10):2582–2584.
- Ronquist F, Teslenko M, van der Mark P, Ayres DL, Darling A, Höhna S, Larget B, Liu L, Suchard MA, Huelsenbeck JP. 2012. MrBayes 3.2: efficient Bayesian phylogenetic inference and model choice across a large model space. Syst Biol. 61(3):539–542.
- Rozas J, Ferrer-Mata A, Sánchez-DelBarrio JC, Guirao-Rico S, Librado P, Ramos-Onsins SE, Sánchez-Gracia A. 2017. DnaSP 6: DNA sequence polymorphism analysis of large data sets. Mol Biol Evol. 34(12):3299–3302.
- Salter JF, Oliveros CH, Hosner PA, Manthey JD, Robbins MB, Moyle RG, Br T, Faircloth BC. 2020. Extensive paraphyly in the typical owl family (Strigidae). Auk. 137(1):ukz070.
- Song X, Huang J, Yan C, Xu G, Zhang X, Yue B. 2015. The complete mitochondrial genome of Accipiter virgatus and evolutionary history of the pseudo-control regions in Falconiformes. Biochem Syst Ecol. 58:75–84.
- Sorenson MD, Ast JC, Dimcheff DE, Yuri T, Mindell DP. 1999. Primers for a PCR-based approach to mitochondrial genome sequencing in birds and other vertebrates. Mol Phylogenet Evol. 12(2):105–114.
- Spiridonova LN, Surmach SG. 2018. Whole mitochondrial genome of Blakiston’s fish owl Bubo (Ketupa) blakistoni suggests its redescription in the genus Ketupa. Russ J Genet. 54(3):369–373.
- Sun C-H, Liu H-Y, Min X, Lu C-H. 2020. Mitogenome of the little owl Athene noctua and phylogenetic analysis of Strigidae. Int J Biol Macromol. 151:924–931.
- Sun X, Zhou W, Sun Z, Qian L, Zhang Y, Pan T, Zhang B. 2016. The complete mitochondrial genome of Glaucidium brodiei (Strigiformes: Strigidae). Mitochondrial DNA A DNA Mapp Seq Anal. 27(4):2508–2509.
- Wink M, El-Sayed A-A, Sauer-Gürth H, Gonzalez J. 2009. Molecular phylogeny of owls (Strigiformes) inferred from DNA sequences of the mitochondrial cytochrome b and the nuclear RAG-1 gene. Ardea. 97(4):581–591.
- Wink M, Heidrich P. 2000. Molecular systematics of owls (Strigiformes) based on DNA sequences of the mitochondrial cytochrome b gene. In: Chancellor RD, Meyburg B-U, editors. Raptors at risk. London: WWGBP/Hancock Housep; p. 819–828.
- Wood JR, Mitchell KJ, Scofield RP, De Pietri VL, Rawlence NJ, Cooper A. 2016. Phylogenetic relationships and terrestrial adaptations of the extinct laughing owl, Sceloglaux albifacies (Aves: Strigidae). Zool J Linn Soc. 179:907–918.
- Yan C, Mou B, Meng Y, Tu F, Fan Z, Price M, Yue B, Zhang X. 2017. A novel mitochondrial genome of Arborophila and new insight into Arborophila evolutionary history. PLOS One. 12(7):e0181649.
- Yang J, Yu J, Liu J, Zhou M, Li B, Ouyang B. 2018. Three new Ranidae mitogenomes and the evolution of mitochondrial gene rearrangements among Ranidae species. Asian Herpetol Res. 9:85–98.
- Zhang D, Gao F, Jakovlić I, Zou H, Zhang J, Li WX, Wang GT. 2020. PhyloSuite: an integrated and scalable desktop platform for streamlined molecular sequence data management and evolutionary phylogenetics studies. Mol Ecol Resour. 20(1):348–355.
- Zhang Y, Song T, Pan T, Sun X, Sun Z, Qian L, Zhang B. 2016. Complete sequence and gene organization of the mitochondrial genome of Asio flammeus (Strigiformes, strigidae). Mitochondrial DNA A DNA Mapp Seq Anal. 27(4):2665–2667.
- Zhong Y, Zhou M, Ouyang B, Zeng C, Zhang M, Yang J. 2020. Complete mtDNA genome of Otus sunia (Aves, Strigidae) and the relaxation of selective constrains on Strigiformes mtDNA following evolution. Genomics. 112(5):3815–3825.
- Zhou C, Chen Y, Hao Y, Meng Y, Yue B, Zeng T. 2019a. Characterization of the complete mitochondrial genome and phylogenetic analysis of Otus sunia (Strigiformes: Strigidae). Mitochondrial DNA Part B Resour 4(1):804–805.
- Zhou C, Jin J, Peng C, Wen Q, Wang G, Wei W, Jiang X, Price M, Cui K, Meng Y, et al. 2019b. Comparative genomics sheds light on the predatory lifestyle of accipitrids and owls. Sci Rep. 9(1):2249.