
 ?Mathematical formulae have been encoded as MathML and are displayed in this HTML version using MathJax in order to improve their display. Uncheck the box to turn MathJax off. This feature requires Javascript. Click on a formula to zoom.
ABSTRACT
The Río de la Plata estuary, located in southeast South America, is of great social and environmental relevance for the region. In the summer of 2018–2019, an exceptional cyanobacterial bloom was detected along the northern coast of the estuary, which greatly affected tourism and recreation, as reported in previous studies and the public press. This is the first work that uses satellite images to quantitatively monitor the evolution of this bloom in an intermediate zone of the estuary, including its initial and ending stages. Chlorophyll-a threshold maps of 10 and 24 µg/L were detected from Sentinel-2 imagery between November 2018-May 2019, while the presence of cyanobacteria was confirmed from phytoplankton field samples and a continuous (point) record of phycocyanin fluorescence. The combination of both satellite and in-situ information was crucial to analyze the spatiotemporal variability of the bloom, and to study its qualitative relationship to environmental drivers: local winds, discharge of the Río de la Plata main tributaries, discharge of a local tributary, water temperature and salinity. Our study shows the complexity of short-term bloom dynamics in a coastal region of the Río de la Plata, particularly highlighting the role of local winds on surface transport and mixing conditions.
RESUMEN
El estuario del Río de la Plata, ubicado al sureste de América del Sur, posee una gran relevancia social y ambiental para la región. En el verano 2018-2019 ocurrió una floración excepcional de cianobacterias a lo largo de la costa norte del estuario, afectando el turismo y la recreación, según se informó en trabajos anteriores y en la prensa. Este es el primer trabajo que utiliza imágenes satelitales para monitorear cuantitativamente la evolución de esta floración en una zona intermedia del estuario, incluyendo su etapa inicial y final. A partir de imágenes de Sentinel-2, se obtuvieron mapas de umbrales de clorofila-a de 10 y 24 µg/L entre noviembre de 2018 y mayo de 2019. La presencia de cianobacterias se confirmó a partir de muestreos de fitoplancton y de un registro continuo (puntual) de fluorescencia de ficocianina. La combinación de información satelital y de campo fue crucial para analizar la variabilidad espaciotemporal de la floración, y para estudiar su relación cualitativa con distintos forzantes ambientales: vientos locales, caudales, temperatura y salinidad. Este trabajo evidencia la complejidad de la dinámica de una floración en la costa del Río de la Plata, destacándose el rol de los vientos locales en el transporte superficial y las condiciones de mezcla.
1. Introduction
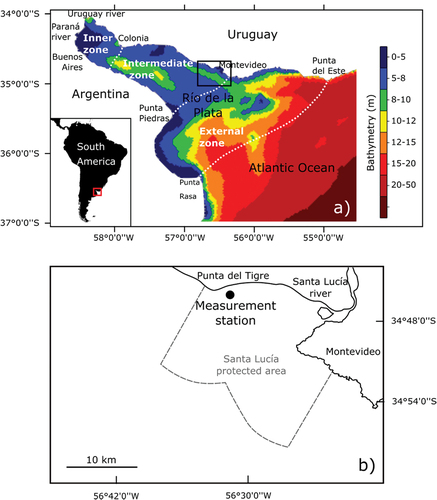
The Río de la Plata estuary, located in southeast South America (), is of great social and environmental relevance for a large region [Citation1]. It has the fifth largest watershed in the world, comprising five countries and being home to more than 110 million inhabitants. Its main tributaries are the Paraná and Uruguay rivers, from which it receives an average daily flow of 26,560 m3/s [Citation2]. Due to various anthropic pressures, the Río de la Plata has been showing symptoms of eutrophication for decades [Citation3], being the occurrence of harmful cyanobacterial blooms one of the main environmental concerns, as they seem to be increasing in intensity and frequency [Citation4,Citation5]. This type of phytoplankton blooms can alter ecosystems functions and services [Citation6], and they especially affect recreation and tourism in the Uruguayan (northern) coast of the estuary [Citation7]. The concentration of cyanobacteria in the northern coast of the Río de la Plata has been previously linked to water temperature and salinity [Citation8], however, the influence of hydrodynamic conditions has not been addressed. The monitoring of cyanobacterial blooms is particularly challenging in the Río de la Plata due to the dynamic nature of both the biological phenomenon and the physical dynamics of the estuary [Citation9]. In this sense, satellite remote sensing arises as a tool of great potential to improve the monitoring of this type of phenomena in large water bodies, providing information in spatiotemporal scales that cannot be achieved with conventional sampling techniques [Citation10].
Figure 1. a) Río de la Plata estuary, including its bathymetry, reference locations, main tributaries (Paraná and Uruguay rivers), and location of the study site in the northern coast; and b) study site and the measurement station (Latitude 34o45ʹ45.5” S and Longitude 56o32ʹ16.7”W) located in the Santa Lucía river mouth, approximately 40 km northwest of Montevideo (capital city of Uruguay).
Phytoplankton blooms are often quantified through chlorophyll a (chl-a) concentrations [Citation11,Citation12], which is among the main retrieved parameters using satellite remote sensing since the 1970ʹs [Citation13]. The remote sensing of chl-a relies on the fact that it is an optically active constituent, meaning that changes in its concentration result in changes in the color of water that can be measured by a remote sensor (i.e., satellite) [Citation14]. Historically, aquatic color satellites have been designed for the observation of the ocean, showing some limitations regarding their spatial, temporal, and spectral resolutions for applications in coastal and inland waters [Citation15]. Furthermore, coastal and inland waters are defined as case 2 waters [Citation16]. This means that their optical properties are given by several optically active constituents that vary independently from each other, challenging the estimation of chl-a concentrations, and requiring the regional validation of empirical and semi-empirical algorithms [Citation17].
Recent studies have highlighted the potential of Sentinel 2-MSI sensor (S2) to retrieve chl-a in coastal regions [Citation18–20]. S2 has the advantage of having high spatial resolution, in the order of 10 m, allowing to detect spatially heterogeneous phenomena, which is a typical characteristic of cyanobacterial blooms [Citation21]. The work of [Citation22], evaluated the viability of S2 to estimate chl-a levels in the northern coast of the Río de la Plata. They proposed the simultaneous use of two chl-a algorithms, which presented opposite trends with suspended sediments concentrations, to detect chl-a thresholds in the order of 101 µg/L, avoiding false positive detections.
The objective of the present work is to study the spatiotemporal variability of an exceptional cyanobacterial bloom that occurred in the summer of 2018–2019 in the northern coast of the Río de la Plata (), including its relationship with potential environmental drivers, such as rivers discharges, local winds and associated wave heights, and water temperature and salinity. To achieve this objective, we relied on the remote sensing of chl-a thresholds, using the method proposed by [Citation22], as well as on field data collected between November 2018 and May 2021. This work demonstrates the usefulness of satellite-based monitoring for water quality applications in a dynamic, complex, and relevant water body of South America. Likewise, it contributes to the identification of the main drivers to be considered for the short-term prediction (on a scale of days) of the evolution of coastal cyanobacterial blooms in the Río de la Plata.
2. Study site and data
2.1. Study site characteristics
Our study site is in the intermediate zone of the Río de la Plata, close to the transition to the external region of the estuary (), comprising the Santa Lucía river mouth and its protected area (), a relevant nursery site for several fish species, including commercial ones [Citation23]. Besides, the site is located immediately upstream of Uruguay’s capital city, Montevideo, which is home of almost half of the country’s population (including its metropolitan area), and has several recreational beaches.
A measurement station was located at Latitude 34°45ʹ45.5” S and Longitude 56°32ʹ16.7”W () for hydrodynamic and environmental monitoring of the input and discharge of a combined-cycled thermoelectric power plant, which was built between 2016 and 2019, and started operating in July 2019. The monitoring began in 2015, and the station was equipped with a moored acoustic doppler current profiler (ADCP, model Sentinel V, manufactured by Teledyne RDI) to measure water velocity profiles, waves, water temperature and depth, and a conductivity-temperature-depth sensor (CTD, model SBE 19plus V2, manufactured by SeaBird), from which salinity was also computed. These measurements revealed a dynamic coastal environment with a strong water temperature cycle, where both freshwater and brackish water conditions can be found (Section A1 of the supplemental material). Periods of negligible or very low salinity levels can have durations of weeks to months, alternated with similar periods of higher salinity, where peaks of around 5 psu or higher occur in the scale of hours or days (see of [Citation22], and Section 2.2 below). Furthermore, salinity at the measurement station was found to be related to the location along the northern coast of the surface turbidity front of the Río de la Plata [Citation2], which can be strongly affected by the discharge of its main tributaries [Citation2,Citation24]. The periods of non-negligible salinity at the measurement station matched periods of low discharge, and conversely, salinity was practically zero for high discharges ( of [Citation2]).
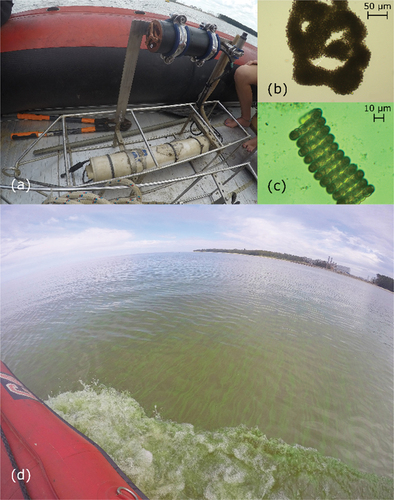
Figure 2. (a) ECO Triplet sensors integrated to the CTD prior to the deployment; (b-c) microscopic images of cyanobacteria-dominated samples collected at the measurement station: (b) Microcystis aeruginosa and (c) Dolichospermum sp.; (d) visual confirmation of cyanobacterial bloom during a field campaign in April, 2019.
Regarding hydrodynamic variables, water currents were aligned with the coast, presenting semi-diurnal fluctuations that can be associated to the predominant astronomical tides in the Río de la Plata [Citation25], and some effect by local winds that were observed mainly close to the surface (Section A of the supplemental material). Wave heights were found to be mainly related to local wind conditions (Section A2 of the supplemental material). No significant correlation was found between wave heights and water velocities, nor between these variables and salinity, reinforcing the link of salinity with the general circulation dynamics of the estuary, rather than local conditions near the coast.
2.2. Phytoplankton field measurements
Phytoplankton was characterized for the study period (November 2018-May 2019) through chl-a concentration, phycocyanin in vivo fluorescence, and phytoplankton samples. For chl-a measurements, sub-surface water samples, triplicated at most dates, were collected for 20 different field campaigns (different dates) at the measurement station indicated in ). Chl-a was extracted with 90% hot ethanol and measured spectrophotometrically [ISO-10260, Citation26].
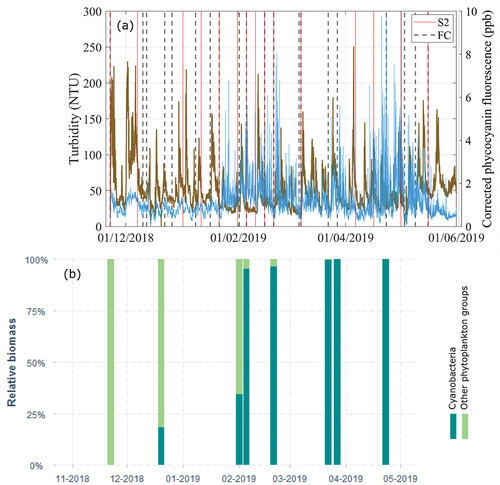
To detect the presence of cyanobacteria, in vivo phycocyanin fluorescence was measured in situ, which is a fingerprint marker for this phytoplankton group [Citation27]. An ECO Triplet optical sensor with bio-wiper (WETLabs, United States) was moored at the measurement station in November 2018 to measure phycocyanin fluorescence (in ppb, EX/EM: 630/680 nm) and turbidity (in NTU) from particles side-scattering at a wavelength of 870 nm (). Measurements were recorded continuously (every half an hour) at approximately 0.5 m from the bottom (the average water depth in the study period was 4.2 m, see Section A2 of the supplemental material). Phycocyanin fluorescence is known to be affected by turbidity [Citation28], and therefore, turbidity data was used to correct phycocyanin measurements (see Section B of the supplemental material). Both the turbidity and the corrected phycocyanin fluorescence time series are shown in ) for the study period. The figure also includes the dates where (cloud-free) S2 images are available for the study site, which were used to obtain surface chl-a maps (see Section 3), and the dates of the field campaigns for which chl-a measurements are available. It is worth highlighting that due to the location of the fluorescence sensor (0.5 m above the bottom), and the lack of a local calibration to phycocyanin or cyanobacteria biomass (the manufacturer calibration might not be valid for natural waters), the fluorescence record was not considered as an accurate measurement of phycocyanin, but rather as a qualitative indicator of cyanobacteria presence at the measurement station. On the other hand, sub-surface phytoplankton samples were taken by triplicate every two to three months, to identify and count phytoplankton to the lowest taxonomical level possible (), using an inverted microscope (Olympus CKX41), and following standard methods [Citation29]. The relative percentage of cyanobacteria identified from these samples are shown in ).
Figure 3. (a) Continuous records (every half an hour) of turbidity (left axis, brown line) and phycocyanin in vivo fluorescence (right axis, blue line) obtained at the measurement station; and (b) relative contribution of cyanobacteria to the total biomass at the measurement station. The solid (red) vertical lines included in panel (a) indicate Sentinel 2-MSI (S2) available images used to retrieve chl-a maps, while de dashed vertical lines indicate dates of the field campaigns (FC) where chlorophyll-a was extracted (see text).
Furthermore, visual inspection was also performed during all field campaigns to confirm cyanobacterial blooms near the measurement station. A bloom was confirmed when the surface water was visually green, and colonies were observable to the bare-eye in sub-surface water samples (scums, ).
2.3. Environmental drivers
As detailed in Section 2.1, the study site is affected by both the general circulation of the Río de la Plata and local conditions. To study the advection (in the scale of days) of cyanobacterial blooms in the study site, the following drivers were considered: discharge of the main tributaries of the estuary (i.e. the Uruguay and Paraná rivers); discharge of the local tributary to the study site (the Santa Lucía river); and local windspeed and direction. Local water currents at the measurement station tended to average to very low values in the scale of days (Section A2 of the supplemental material), so they were not explicitly considered. Regarding the main water quality parameters that can favor the presence of cyanobacteria at the study site, both water temperature and salinity were found to be good predictor factors for cyanobacteria biovolume [Citation8], and hence, we also considered them in the analyses included in this work. Since the estuary is eutrophic [Citation3,Citation30], nutrients were not included in our study, assuming no relevant influence of these variables [Citation31], especially at the scale considered in this work.
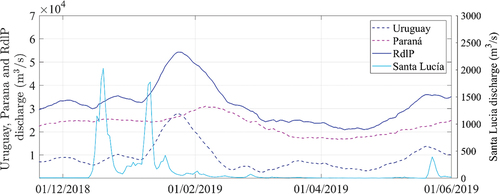
Daily discharges of the Uruguay and Paraná rivers were obtained from the Instituto Nacional del Agua [INA, www.ina.gov.ar), Argentina. Their combined flowrates were above the historical average of 26,560 m3/s reported in [Citation2],between November 2018-February 2019, being particularly high at the end of January 2019, where a considerable discharge peak was registered for the Uruguay river (). The discharge of both tributaries decreased between March and April of 2019, increasing again in May (). On the other hand, the Santa Lucía river is a minor tributary of the Río de la Plata, with an average discharge of 2,700 m3/s, but that could influence the study site given the proximity of the river mouth. River flow was estimated from a discharge rating curve and daily level data, which was obtained from the Dirección Nacional del Agua (DINAGUA, https://www.ambiente.gub.uy/informacion_hidrica/index.php), Uruguay, at the Santa Lucía city station (approximately 50 km upstream of the river mouth). The Santa Lucía river discharge is typically negligible, but it presents abrupt peaks, for example, the ones registered in December 2018 and January 2019 in .
Figure 4. Daily discharge (in m3/s) for the main tributaries of the Río de la Plata, the Uruguay and Paraná rivers (left axis), including their combined flowrate (RdlP), and daily discharge of the local tributary, the Santa Lucía river (right axis), obtained from a rating curve approximately 50 km upstream of the river mouth (see text).
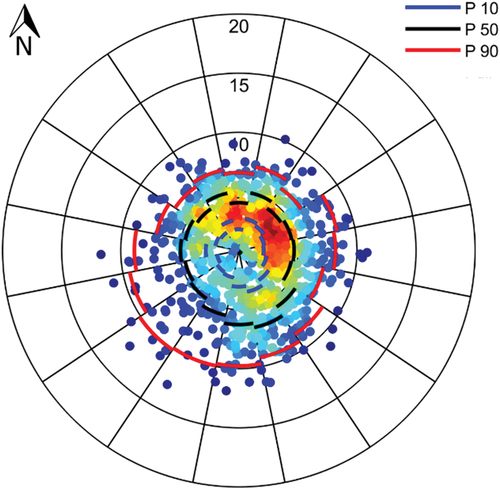
Wind data were obtained from the European Center for Medium-Range Weather Forecasts (ECMWF). The ERA5 reanalysis [Citation32] was used, which has a six-hour time step and spatial resolution of 0.125° (approximately 14 km). We selected the grid point that was closest to the measurement station (Latitude 34°52ʹ30” S, Longitude 56°30ʹ00” W). The most frequent winds came from the NE quadrant during the study period, although the strongest winds were from the SW, reaching above 10 m/s (). It is worth mentioning that the strongest winds, especially from the S, were associated with larger significant wave heights (Section A2 of the supplemental material), so this variable is indirectly considered in the analysis.
Figure 5. Distribution of wind velocities (in m/s) for the study region in the period November 2018-May 2019, obtained from reanalysis data (see text). Each data point indicates the magnitude and direction from which the wind is coming. Warmer (colder) colors represent more (less) density of data points. The 10th, 50th and 90th percentiles (P10, P50 and P90, respectively) are included for each of the 16 discrete directions.
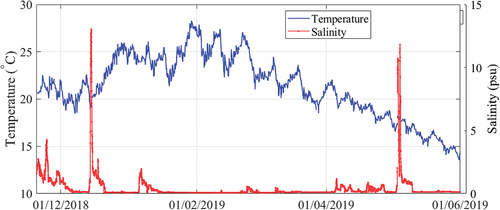
Water temperature and salinity time series at the measurement station were recorded as described in Section 2.1 and are presented in for the study period (November 2018-May 2019). Water temperature was around 20°C at the beginning of the study period, reaching the highest values of about 27°C by the end of January and February 2019, and gradually decreasing to 15°C by the end of May 2019. Salinity was below 5 psu during the entire study period, except for two sharp peaks that exceeded 10 psu: in mid-December 2018 and at the beginning of May 2019. Salinity levels were particularly low from January through April 2019, being negligible most of the time.
Figure 6. Time series of continuous measurements (half an hour) of water temperature (left axis) and salinity (right axis) at the measurement station.
Additionally, daily water temperature maps with spatial resolution of 1 km were obtained for the study site between 22 November 2018 and 16 May 2019, from the Multi-scale Ultra-high Resolution (MUR) sea surface temperature (SST) dataset [https://podaac.jpl.nasa.gov/dataset/MUR-JPL-L4-GLOB-v4.1; Citation33], which are presented in Section C1 of the supplemental material. Values from the temperature maps (Figures S8-S12) showed the same trends and similar magnitudes as the data recorded in situ at the measurement station (). The work of [Citation34], had shown a good performance of the MUR SST data compared to in situ measurements in the Río de la Plata at a coastal location near Montevideo (downstream from our study site), and a comparison for the measurement station used in this work is included in Section C2 of the supplemental material. The advantage of the MUR SST data is that it shows the spatial variability of water temperature, allowing to detect warmer or cooler water masses that reach the study site. Further description of this variability is included in Section 4.
3. Chl-a estimation from Sentinel 2 imagery
Since this study focuses on the cyanobacterial bloom that occurred in the summer season of 2018–2019 along the northern coast of the Río de la Plata, we selected the threshold levels for chl-a maps based on recommendations for exposure in recreational waters where cyanobacteria dominate. The current Alert Level II for drinking and recreational waters was defined by the World Health Organization (WHO, https://www.who.int/) as 24 µg/L [Citation35]. Previously, [Citation36], had associated a level of 10 µg/L with low risk of adverse health effects in recreational waters. Moreover, this latter value is relatively low and can give a better indication of the initial and final stages of the bloom. Therefore, we considered the two threshold levels, 10 and 24 µg/L, for the retrieval of chl-a maps from S2 imagery.
We applied the method proposed in [Citation22], as it was developed for the same study region. The following chl-a indicators were used:
and
where is the water-leaving reflectance (dimensionless) obtained from S2 at the band centered at wavelength
, being 560, 665, 705, and 740 nm the center wavelengths of the green, red, red-edge, and shortest near infrared (NIR) bands of S2. Water-leaving reflectance,
, was obtained by correcting Level 1C S2 images (downloaded from https://scihub.copernicus.eu/) with the atmospheric correction processor ACOLITE [version 20190326.0; Citation37]. The dark spectrum fit (DSF) method available in ACOLITE, with the optional sun glint (SG) correction [DSF+SG), was applied to the images. The validation of this atmospheric correction procedure for our study region was previously presented in [Citation38].
The three-band index (I3B] from EquationEquation (1)(1)
(1) had been widely used by several previous authors to estimate chl-a in turbid productive estuarine and coastal waters [Citation39–42]. On the other hand, several spectral shape (SS) indices had been previously proposed to estimate chl-a [e.g. Citation43, Citation44], being particularly useful to detect cyanobacterial blooms [e.g. Citation45, Citation46]; however, they tended to rely on bands that are not available for S2, such as 620 or 680 nm. The SS index of EquationEquation (2)
(2)
(2) measures the reflectance peak at the red band (centered at 665 nm), relative to a linear baseline between the green and red-edge bands of S2 (centered at 560 and 705 nm, respectively).
The work of [Citation22], found that chl-a estimations from independent indices were not accurate due to the high variability of other optically active constituents in the water that can be found in this region of the Río de la Plata, especially turbidity levels associated to suspended sediments concentrations. The variability found in turbidity affected the retrieval of chl-a concentrations in the order of 101 µg/L: I3B tended to overestimate chl-a when turbidity approached 100 NTU or more, which can be often observed near the turbidity front location, while SS[665] tended to overestimate chl-a for clear waters. Other indices previously proposed for turbid productive waters, such as the NDCI of [Citation47], had the same problem described above for the I3B . [Citation22] suggested then the simultaneous application of the two indices presented in EquationEquations (1)(1)
(1) and (Equation2
(2)
(2) ) to retrieve chl-a threshold levels in the order of 101 µg/L. This avoided false positive detections of algal blooms caused by the large variability of turbidity levels on chl-a indices. For the chl-a concentration ([chl-a]) thresholds selected in this work, the following values of the indices were used based on their regional calibration: I3B≥-3.52x10⁻² and -SS(665)≥-2.32x10⁻³ (for [chl-a]≥10 µg/L); I3B≥3.02x10⁻² and -SS(665)≥5.03x10⁻³ (for [chl-a]≥24 µg/L). Although resulting maps highlight the areas where both indices met these thresholds, we also included in Section 4 maps that show when none, one or both indices detect [chl-a]≥10 µg/L, in order to provide an idea of the spatial uncertainty caused by the variability of turbidity levels in the study site.
4. Results
Chl-a threshold maps were obtained from late November 2018 to May 2019 (). This period comprised the occurrence of a massive cyanobacterial bloom in the northern coast of the Río de la Plata (from the end of January to March of 2019), which affected the use of an important number of recreational beaches during the summer season [Citation5,Citation7]. In this work we present the temporal evolution of the chl-a thresholds, including the initial stages, peaks, and final stages of the bloom at the study site. In addition, we qualitatively relate its intensity and location to potential drivers that were also recorded or obtained for the same period. Since the maps show chl-a, which can be associated to any phytoplankton species, the presence of cyanobacteria was confirmed visually during field campaigns, from phytoplankton samples, and through the continuous record of phycocyanin fluorescence at the measurement station.
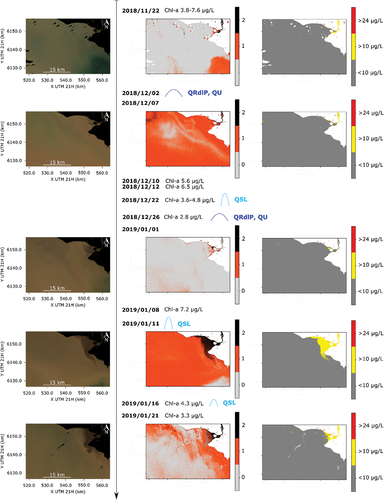
Figure 7. Sequence of Sentinel 2 images between late November 2018 and mid-January 2019. Left panels: RGB composites, with the land indicated in black. Central panels: the chl-a threshold of 10 µg/L as detected by none (gray), only one (red) or both (black) of the chl-a indices described in Section 3. Right panels: threshold maps for chl-a levels above 10 and 24 µg/L, simultaneously detected by both chl-a indices. In central and right panels, the land is indicated in white. The timeline also includes: extracted chl-a concentrations when available, peaks in the Uruguay, Paraná, Río de la Plata and Santa Lucía river discharges (QU, QP, QRdlP, and QSL, respectively), and relevant local wind events.
4.1. Conditions prior to the bloom – late spring and early summer
Between November and December of 2018, chl-a concentrations remained under 10 μg/L in the entire study site (). This was also supported by field measurements, where chl-a was in the range of 4–8 μg/L, and cyanobacteria were either not found or were not dominant at the study site (). The effect of the Río de la Plata discharge peak that occurred on 2 December 2018, can be qualitatively appreciated in the RGB composite of December 7 (), where the clearer water that can be seen in the SW region of the image from November 22 is no longer observed. This suggests turbid freshwater entering the study region, which was also supported by the salinity record (). The high salinity peak recorded in mid-December (>10psu, ) did not match any available S2 images. Another interesting observation is the shift in water temperature in the region, which was around 21–22°C the last week of November, and it decreased to around 20°C during the peak in the discharge, returning to 21–22◦C by mid-December and continuing to increase to 23–24◦C ( and S8).
Between the end of December 2018 and mid-January 2019, three peaks of the Santa Lucía river discharge occurred (). The river plume can be visually detected after each peak in the images of January 1 and 21 (left panels of ). The river discharge seems to bring higher levels of chl-a than the estuarine water, as it can be observed, for example, in the map of 11 January 2019 (). This result is consistent with the field measurement of January 8 (7.2 μg/L of chl-a), which was higher than in the previous and subsequent field campaigns. Nevertheless, chl-a concentrations did not seem to exceed 24 μg/L in any of the above-mentioned dates, and the phycocyanin record was also relatively low during this period (). Conversely to what occurred in early December, the water temperature increased during the Río de la Plata discharge peak of late December to 25–26◦C, decreasing again to 23–24◦C by mid to late January of 2019 (), while the Santa Lucía discharge peaks were not detected in the water temperature maps (Figure S9)
4.2. Bloom initiation and first peak – summer
Small areas of chl-a exceeding 10 μg/L can be observed in the map for January 21 upstream of the Santa Lucía river mouth (center and right panels of ). By this date the Río de la Plata discharge was increasing, especially due to the Uruguay river flow, reaching its maximum peak (for the analyzed period) on 23 January 2019 (). In the next available S2 image of January 31 (), two patches of higher chl-a concentration were distinguished: in the Santa Lucía river mouth, similar than in the map of the previously available date (January 21), and entering the river mouth along the coast from upstream (NW of the image). At this date, intense cyanobacterial blooms were visually observed in Montevideo beaches [Citation7], and we measured chl-a concentrations above 80 μg/L from two water samples collected on 31 January 2019, at Playa Ramirez, Montevideo (not shown). On the other hand, at the study region, concentrations remained close to 10 μg/L, as measured during the field campaign of February 1, where no blooms were visually observed, and cyanobacteria were not dominant in the phytoplankton samples (<50% in ). Four days later, however, after predominance of relatively intense S winds, cyanobacteria blooms were visually observed near the sampling station, and an extensive area of high chl-a concentrations was remotely detected, with regions exceeding the threshold of 24 μg/L, as it can be seen in the map of 5 February 2019 (). The area with highest concentration was detected at the Santa Lucía river mouth, and highly concentrated chl-a patches can be also observed toward the SE of the estuary along the coast, indicating the transport of cyanobacterial biomass downstream of the study site.
Figure 8. Same as but from late January to late February, 2019.
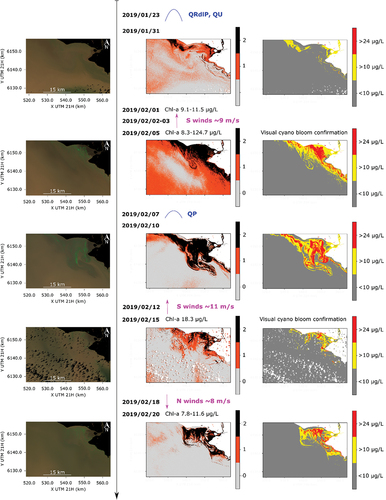
After calmer wind conditions and a peak discharge of the Paraná river, the bloom was observed further away from the coast on the map of February 10 (), with biomass being transported from the Santa Lucía river mouth to the S and SE, reaching regions further away from the coast. At this date, the bloom was also detected upstream of the river mouth along the coast. On the other hand, in subsequent maps of February 15 and 20 (), chl-a decreased upstream, while the bloom remained in the Santa Lucía river mouth. After relatively intense S winds, it was observed inside the river mouth, closer to the coast (on February 15), while after N winds (on January 20) it was clearly separated from the coast and again being transported to the S and SE.
Water temperature within this period firstly increased to about 27°C from the beginning of February ( and S10), matching the increase in the detected chl-a area that exceeded the thresholds of interest. Surface temperature maps show a drastic decrease to around 24°C on February 13, which remained around 23–25°C until February 17 (Figure S10). The temperature drop occurred right after a relatively intense event of S wind that was accompanied by significant wave height of 1.5 m (around the largest values measured at the measurement station, Figure S5), and an increase from 4 to 6 m of the sea level at the measurment station (Figure S4). By February 20, when the bloom area increased again in the study site, the temperature had rose to about 27°C ( and S10). The phycocyanin fluorescence time series clearly confirms the presence of cyanobacteria at the measurement station, with high recorded values during this period (), while cyanobacteria become dominant in the phytoplankton samples ().
4.3. Second peak and end of the bloom – late summer and autumn
Between the end of February and first half of March 2019, phycocyanin time series at the sampling site showed that cyanobacteria were still present, but the peaks in the record diminished (). The available map for March 7 () showed disperse patches of [chl-a]≥10 µ/L (including small areas of [chl-a]≥24 µ/L) in the Santa Lucía river mouth (away from the coast) and in the estuary. Although cyanobacteria presence was visually confirmed in field visits, no scums were observed. The extracted chl-a concentration was around 20 µ/L for the field campaign of March 6. Precedent winds at the beginning of March were mainly from the N.
Figure 9. Same as but from March to mid-May, 2019.
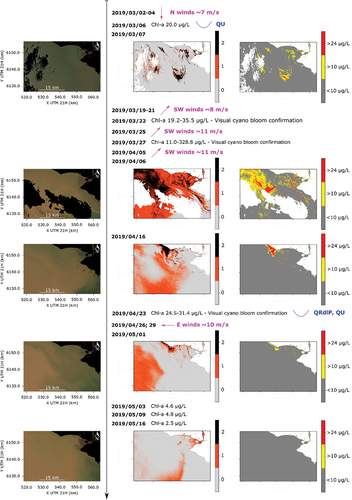
During the second half of March, several intense SW wind events occurred. The phycocyanin fluorescence increased (), cyanobacteria completely dominated phytoplankton samples (), and the extracted chl-a measured during field campaigns also rised. On March 22 and 27, the concentrations were around 178 and 329 μg/L over bloom patches found near the measurement station. Unfortunately, there are not available S2 images in this period. The next image is from April 6 (), and shows a bloom pattern that is quite different from the previous ones, with a massive area of high chl-a concentrations located in the main estuary, but not along the coast as it was observed in February, and filament-shaped patches inside the Santa Lucía river mouth being transported downstream toward the SE. The water temperature during March had a decreasing trend that can be associated to its seasonal cycle (Figure S3a), going from about 25°C at the beginning of March to around 20°C at the beginning of April (Figure S11), with local fluctuations at the measurement station ().
In the second half of April, the phycocyanin fluorescence record showed the highest peaks recorded during the study period (), matching the continued dominance of cyanobacteria in phytoplankton samples (). The available map for April 16 () shows a localized bloom very close to the coast, covering the NW part of the Santa Lucía river mouth, where the sampling site is located. The field campaign of April 23 confirmed the presence of a cyanobacterial bloom there, with extracted chl-a concentrations between 24 and 31 µg/L. By May 1, after a local minimum in the Río de la Plata discharge and a couple of events of relatively intense E winds, the extension and concentration of the bloom considerably decreased in the region (). A sharp peak of salinity that exceeded 10 psu was observed right after this date (), probably associated to the low discharge and previous wind events. During the first half of May the phycocyanin fluorescence record began to rapidly decrease (), although some peaks were still recorded. The temperature steadily dropped under 17°C ( and S12), and the extracted chl-a from field samples was below 5 μg/L. The map of May 16 did not show any area with concentrations higher than 10 μg/L ().
5. Discussion
5.1. Bloom evolution and dynamics
The previous work of [Citation7] suggested that the massive cyanobacterial bloom of 2019 was originated in an upstream reservoir (Palmar) on the Negro river and transported by the Uruguay river toward the Río de la Plata’s northern coast, up to 690 km from its origin. They pointed out that Palmar reservoir had a massive bloom on January 4, which was gone by January 29 after the spillway of the dam remained opened for approximately a month. Simultaneously, an important peak in the Uruguay river discharge was recorded by the end of January, considerably increasing the Río de la Plata total discharge (). The transit time through the Uruguay river to the estuary is highly variable, but during normal to high flow conditions, as in this case, it is in the order of 7–10 days [Citation48]. On January 17, a large cyanobacterial bloom was reported in the northern coast of the Río de la Plata near Colonia (upstream from the study site, see ), and on January 27 sanitary flags were set up at Montevideo beaches due to the presence of cyanobacteria scum [Citation7]. This timeline is consistent with the phycocyanin fluorescence levels recorded at our study site, which increased on January 22 and the subsequent days (). Unfortunately, there are not available S2 images between January 21 and 31, and the latter showed levels of chl-a above 10 µg/L at the Santa Lucía river mouth, but not exceeding 24 µg/L. However, a massive cyanobacterial bloom was detected at the study region later than February 1, and after a few days of persistent and relatively strong S winds. Local winds mainly affect near-surface water velocities [Citation1] (see also Section A of the supplemental material), and could have favored the influx of scums accumulated in the surface that were coming from upstream. Moreover, both the fluvial inputs of the main Río de la Plata tributaries and the persistence of local winds have been shown to influence the extension of the freshwater area of the estuary [Citation24,Citation49]. Specifically, discharges above the 75th percentile (as it occurred for most of the study period presented in this work) and persistent (2-day) SW winds were associated with a marked outward shift of the turbidity and salinity fronts of the estuary [Citation2]. Conditions of consistently low salinity, combined with higher water temperatures that are typical of the summer season, provide favorable conditions for cyanobacteria at the study site [Citation8], which could have enhanced their local growth.
Once the bloom was established in early February at the study site, the spatial patterns seen in chl-a threshold maps (e.g. of February 5 and 20 in ) suggest that there is an exchange of biomass between the Santa Lucía river mouth and the main estuary. This indicates that the region could be a direct source of highly concentrated chl-a patches to downstream locations, which could exacerbate the impact on water quality and recreation along the coast of the estuary. This observation supports recent findings that highlight the importance of the Santa Lucía river system to understand the complexities of coastal blooms in the Río de la Plata [Citation50]. Regarding the temporal variability of the bloom, the spatial extension of the areas with chl-a exceeding the selected thresholds was observed to greatly vary within the scale of a few days, which seemed to be mainly associated with local wind conditions. Particularly, areas exceeding the selected chl-a thresholds considerably diminished (on February 15, ) after an intense southern-wind storm, where high significant wave heights were recorded (Figure S5). The re-appearance of the bloom on February 20 () suggests that its previous reduction might have been caused by an increased mixing in the water column caused by these previous storm conditions [Citation49]. It is important to highlight that aquatic color remote sensing only detects near-surface concentrations of chl-a, and this should be considered when analyzing satellite data, especially in highly dynamic water bodies, such as the Río de la Plata. Therefore, the smaller bloom area observed on February 15 might not necessarily indicate a significant reduction in total cyanobacterial biomass in the region. This is supported by the phycocyanin fluorescence record, which did not decrease during this period and showed relatively high peaks (). Nevertheless, conditions of strong mixing are unfavorable for local phytoplankton growth [Citation51], which may have prevented a worse scenario of increased extension and concentration of the bloom by the end of February at the study site.
We summarized in the relationships between drivers and cyanobacterial accumulation at the study site. The tributaries inflow has two major effects, the advection of phytoplankton cells into the estuary [Citation7], and the position of the turbidity and salinity estuarine fronts. Low (high) tributaries inflow, and persistent NW (S) wind events, determine high (low) salinity levels at the study site [Citation2]. Salinity levels have negative feedback on cyanobacterial presence, meaning that high (low) salinity is less (more) favorable for cyanobacterial accumulation [Citation8]. Local winds increase both the mixing conditions of the water column (unfavorable for phytoplankton growth) and near-surface water currents, which can modify the position of cyanobacteria biomass, either advecting it toward the coast (increasing biomass accumulation), or dispersing the bloom towards other regions of the estuary. It is important to highlight that both river inflow and prevailing winds in the estuary are related to global climatic phenomena, especially the El Niño-Southern Oscillation events [Citation52], and that the influence of high river inflow on the occurrence of phytoplankton blooms can be negative in other regions of the estuary [Citation53]. Finally, water temperature is another driver for cyanobacterial growth in eutrophic ecosystems, and while river inflow also seemed to affect this parameter at the study site (either positively or negatively), its variability is dominated by the seasonal cycle [Figure S3).
Figure 10. Causal loop diagram, based on the one presented in [Citation52], but for cyanobacterial accumulation at the study site. Positive (+) feedbacks are indicated with continuous (green) arrows; Negative (-) feedbacks are shown with dashed (red) arrows; and dash-dotted (blue) arrows represent either positive or negative (+/-) feedbacks according to the characteristics of the driver (e.g. wind direction).
![Figure 10. Causal loop diagram, based on the one presented in [Citation52], but for cyanobacterial accumulation at the study site. Positive (+) feedbacks are indicated with continuous (green) arrows; Negative (-) feedbacks are shown with dashed (red) arrows; and dash-dotted (blue) arrows represent either positive or negative (+/-) feedbacks according to the characteristics of the driver (e.g. wind direction).](/cms/asset/c4a13d5e-3c40-4308-94b8-1755e12b7bce/trib_a_2264511_f0010_oc.jpg)
5.2. The role of remote sensing as a tool
The remote sensing method used in this study provides information regarding chl-a threshold levels, based on indices that were regionally calibrated and evaluated for the study site [Citation22]. This approach has the advantage of providing quantitative data that can be directly associated to alert and risk levels in the presence of cyanobacteria. Other works in the Río de la Plata have previously used remote sensing to study algal blooms in a more qualitative way in terms of chl-a concentrations [Citation7,Citation53], since they relied on the NDCI index [Citation47,Citation54]. The calibration of the NDCI proposed in [Citation47] to estimate chl-a had a poor performance in the Río de la Plata [Citation17,Citation22]. On the other hand, the remote sensing method has the disadvantage of not being able to confirm the presence of cyanobacteria on its own, due to the lack of spectral bands of S2 near the absorption peak of phycocyanin. To overcome this limitation, our study relied on continuous in-situ data of phycocyanin fluorescence and field campaigns. The incorporation of other satellite imagery, such as Sentinel-3, could remotely confirm the presence of cyanobacteria [e.g. Citation55] in future works, especially now that the last reprocessing of level 2 (atmospherically corrected) water-leaving reflectance from Sentinel-3 imagery gave promising preliminary results for the Río de la Plata [Citation56].
Finally, our results also support the sinergy between spatial and point datasets [Citation57]. According to the phycocyanin fluorescence record, the highest concentrations at the measurement station occurred in late April of 2019. However, this could not have been inferred from chl-a maps, because fewer S2 images were available then due to an increase in cloud coverage. Those chl-a maps that were available for this period (April 16 and May 1, ) did show high chl-a concentrations, but only in a relatively small area of the north coast close to the measurement station, loosing relevance in comparison to previous maps that showed much larger areas of chl-a exceeding the selected thresholds (e.g. maps for February in ). Therefore, remote sensing gives a synoptic view of the spatial distribution and extent of the bloom that is not possible to capture with a point station, while the continuous record can capture the short-term dynamics and the occurrence of concentration peaks that cannot be distinguished in the maps mainly due to their temporal resolution, but that could be of great local relevance.
6. Final remarks
The analysis presented in this work supports the good performance of the method proposed in [Citation22] to remotely map (surface) chl-a threshold levels in optically complex coastal waters, with highly variable concentrations of optically active constituents. The simultaneous use of two S2 chl-a indices, the I3B and the SS(665), was crucial to generate maps that were useful to study the evolution of a cyanobacterial bloom, avoiding the detection of false positive chl-a thresholds due to the high range of turbidity levels that are typically found at the intermediate region of the Río de la Plata. As expected, the timeline of the resulting satellite chl-a threshold maps was consistent with extracted chl-a concentrations, while the presence of cyanobacteria was confirmed from phytoplankton samples, from the phycocyanin fluorescence time series recorded at the same measurement station, and by visual inspection during the field campaigns.
Our work showed the complexity of bloom dynamics in a coastal region of the Río de la Plata, which seemed to be affected by different drivers. The effect of local winds was particularly highlighted, which could enhance local growth when blooms enter bays or river mouths that may have higher retention times. Their interchange with the main estuary could be a source of algal biomass to downstream locations, as highly concentrated chl-a patches were observed to be transported from the Santa Lucía river mouth toward the S and SE in several map patterns. Our results also showed the importance of previous (in the scale of a few days) mixing conditions when interpreting chl-a satellite data. Mixing conditions seemed to influence the extent of the bloom detected by satellite imagery, where smaller areas of high chl-a concentrations were retrieved after the occurrence of storms associated to high wind intensities, high significant wave heights, and enhanced mixing.
Overall, both remote estimations and continuous field (point) records were crucial to analyze the evolution of the bloom during the study period. The detection of chl-a thresholds from S2 imagery represents a powerful tool to support monitoring of the Río de la Plata estuary, especially its coastal regions, where high spatial resolution is an advantage to detect heterogeneous cyanobacterial blooms that can impact water quality and the use of water resources. The combination of validated remote sensing techniques with in situ sampling at strategic locations and numerical modeling would allow for the accurate short-term forecast of the bathing water quality on the Río de la Plata beaches. This could be an important tool for local authorities, allowing the emission of daily reports and health alerts that incorporate the forecast of cyanobacteria presence on beaches during the summer months.
Data availability
The data registered at the measurement station is available for academic studies by request to the corresponding author of this work, and after getting authorization from UTE.
Supplemental Material
Download MS Word (2.6 MB)Acknowledgments
This work was supported by the Agencia Nacional de Investigación e Innovación (ANII, National Research and Innovation Agency, Uruguay) under Grant FMV-1-2017-1-136098; Comisión Sectorial de Investigación Científica (CSIC, Scientific Research Committee) of the Universidad de la República, Uruguay, under the 2017 fund for scientific equipment; CSIC and UTE (National Electric Administration of Uruguay) under Grant ID24 (2017); and the Comisión Académica de Posgrado (Academic Graduate Committee) of the Universidad de la República, Uruguay, under the fellowship for graduate studies granted to F. Maciel. The authors want to thank Matías González, Rodrigo Mosquera, and the staff of Movil 1 S.A. and Techno Dive S.A. for their assistance during field measurements; and the assistance of Katherine Bombi in laboratory analyses. Part of the data used in this work was collected during field campaigns in the frame of an outreach project for UTE, and the authors also want to thank the co-responsible scientist in the project, Dr. Rafael Arocena.
Disclosure statement
No potential conflict of interest was reported by the author(s).
Supplementary material
Supplemental data for this article can be accessed online at https://doi.org/10.1080/23863781.2023.2264511
Additional information
Funding
References
- Fossati M, Santoro P, Mosquera R, et al. Dinámica de flujo, del campo salino y de los sedimentos finos en el Río de la Plata. RIBAGUA. 2014;1(1):48–63.
- Maciel FP, Santoro PE, Pedocchi F. Spatio-temporal dynamics of the Río de la Plata turbidity front; combining remote sensing with in-situ measurements and numerical modeling. Cont Shelf Res. 2021;213:104301.
- Nagy GJ, Gómez-Erache M, López CH, et al. Distribution patterns of nutrients and symptoms of eutrophication in the Rio de la Plata River Estuary System. Hydrobiologia. 2002;475:125–139.
- Bonilla S, Haakonsson S, Somma A, et al. Cianobacterias y cianotoxinas en ecosistemas límnicos de Uruguay. INNOTEC. 2015;10:9–22.
- Kruk C, Martínez A, Martínez de la Escalera G, et al. Rapid freshwater discharge on the coastal ocean as a mean of long distance spreading of an unprecedented toxic cyanobacteria bloom. SciTotal Environ. 2021;754:142362.
- Huisman J, Codd GA, Paerl HW, et al. Cyanobacterial blooms. Nature Rev Microbiol. 2018;16(8):471–483.
- Aubriot L, Zabaleta B, Bordet F, et al. Assessing the origin of a massive cyanobacterial bloom in the Río de la Plata (2019): towards an early warning system. Water Res. 2020;181:115944.
- Haakonsson S, Rodríguez MA, Carballo C, et al. Predicting cyanobacterial biovolume from water temperature and conductivity using a Bayesian compound Poisson-Gamma model. Water Res. 2020;176:115710.
- Sathicq MB, Gómez N, Andrinolo D, et al. Temporal distribution of cyanobacteria in the coast of a shallow temperate estuary (Río de la Plata): some implications for its monitoring. Environ Monit Assess. 2014;186(11):7115–7125.
- Blondeau-Patissier D, Gower JFR, Dekker AG, et al. A review of ocean color remote sensing methods and statistical techniques for the detection, mapping and analysis of phytoplankton blooms in coastal and open oceans. Prog Oceanogr. 2014;123:123–144.
- Khan RM, Salehi B, Mahdianpari M, et al. A meta-analysis on harmful algal bloom (HAB) detection and monitoring: a remote sensing perspective. Remote Sens. 2021;13(21):4347.
- Ruddick K, Lacroix G, Park Y, et al. Overview of ocean colour: theoretical background, sensors and applicability for the detection and monitoring of harmful algae blooms (capabilities and limitations) (Real-time coastal observing systems for marine ecosystem dynamics and harmful algal blooms. Oceanographic Methodology Series). Paris: UNESCO Publishing; 2008.
- Gholizadeh MH, Melesse AM, Reddi L. A comprehensive review on water quality parameters estimation using remote sensing techniques. Sensors. 2016;16(8):1298.
- IOCCG. Earth observations in support of global water quality monitoring. Greb S, Dekker A, Binding C. Eds. IOCCG Report Series No. 17. International Ocean Colour Coordinating Group. Dartmouth:Canada; 2018.
- Mouw CB, Greb S, Aurin D, et al. Aquatic color radiometry remote sensing of coastal and inland waters: challenges and recommendations for future satellite missions. Remote Sens Environ. 2015;160:15–30.
- Morel A, Prieur L. Analysis of variations in ocean color. Limnol Oceanography. 1977;22(4):709–722.
- Dogliotti AI, Gossn JI, Gonzalez C, et al. Evaluation of multi- and hyper- spectral chl-a algorithms in the Río de la Plata turbid waters during a cyanobacteria bloom. 2021 IEEE International Geoscience and Remote Sensing Symposium IGARSS; July 11–16, 2021; Brussels, Belgium. 2021. p. 7442–7445. doi: 10.1109/IGARSS47720.2021.9553148
- Bramich J, Bolch CJS, Fischer A. Improved red-edge chlorophyll-a detection for Sentinel 2. Ecol Indic. 2021;120:106876.
- Gernez P, Doxaran D, Barille L. Shellfish aquaculture from space: potential of Sentinel 2 to monitor tide-driven changes in turbidity, chlorophyll concentration and oyster physiological response at the scale of an oyster farm. Front Mar Sci. 2017;4:137.
- Pahlevan N, Smith B, Alikas K, et al. Simultaneous retrieval of selected optical water quality indicators from Landsat-8, Sentinel-2, and Sentinel-3. Remote Sens Environ. 2022;270:112860.
- Oliver RL, Hamilton DP, Brookes JD, et al. Physiology, Blooms and Prediction of Planktonic Cyanobacteria. In: Whitton BA, editor. Ecology of Cyanobacteria II: their Diversity in Space and Time. Dordrecht: Springer; 2012. p. 155–194. doi: 10.1007/978-94-007-3855-3_6
- Maciel FP, Haakonsson S, Ponce de León L, et al. Challenges for chlorophyll-a remote sensing in a highly variable turbidity estuary, an implementation with Sentinel-2. Geocarto International. 2023;38(1):21600.
- Jaureguizar AJ, Solari A, Cortés F, et al. Fish diversity in the Río de la Plata and adjacent waters: an overview of environmental influences on its spatial and temporal structure. J Fish Biol. 2016;89(1):569–600.
- Framiñan MB, Brown OB. Study of the Rio de la Plata turbidity front, Part I: spatial and temporal distribution. Cont Shelf Res. 1996;16(10):1259–1282.
- Santoro P, Fossati M, Piedra-Cueva I. Study of the meteorological tide in the Río de la Plata. Cont Shelf Res. 2013;60:51–63.
- ISO-10260. Water quality measurement of biochemical parameters: spectrophotometric determination of chlorophyll-a concentration (Standard No. 10260). International Organization for Standardization. Geneva: Switzerland; 1992.
- Lee T, Tsuzuki M, Takeuchi T, et al. In-vivo fluorometric method for early detection of cyanobacterial water blooms. J Appl Phycol. 1994;6(5–6):489–495.
- Cremella B, Huot Y, Bonilla S. Interpretation of total phytoplankton and cyanobacteria fluorescence from cross-calibrated fluorometers, including sensitivity to turbidity and colored dissolved organic matter. Limnol Oceanogr Methods. 2018;16(12):881–894.
- Sournia A. Phytoplankton manual (Monographs on oceanographic methodology No. 6). Paris: UNESCO; 1978.
- García-Alonso J, Lercari D, Defeo O, et al. Río de la Plata: a neotropical estuarine system. In: Wolanski E, Day JW, Elliott M, editors. Coasts and Estuaries. Chapter 3. Elsevier; 2019. p. 45–56. doi: 10.1016/B978-0-12-814003-1.00003-4
- Giannuzzi L, Carvajal G, Corradini MG, et al. Occurrence of toxic cyanobacterial blooms in Rio de la Plata Estuary, Argentina: field study and data analysis. J Toxicol. 2012;2012:373618.
- Hersbach H, Bell B, Berrisford P, et al. The ERA5 Global Reanalysis. Q J R Meteorol Soc. 2020;146(730):1999–2049.
- Chin TM, Vazquez-Cuervo J, Armstrong EM. A multiscale high-resolution analysis of global sea surface temperature. Remote Sens Environ. 2017;200:154–169.
- Trinchin R, Manta G, Santana R, et al. Hacia un monitoreo continuo de variables oceanográficas en el Parque Nacional Isla de Flores, Uruguay. INNOTEC. 2021;21:89–108.
- Chorus I, Welker M. Exposure to cyanotoxins: understanding it and short-term interventions to prevent it. In: Chorus I, Welker M, editors. Toxic cyanobacteria in water. A guide to their public health consequences, monitoring and management. 2nd ed. London: CRC Press; 2021. p. 295–400.
- Pilotto LS, Douglas RM, Burch MD, et al. Health effects of recreational exposure to cyanobacteria (blue-green) during recreational water-related activities. Aust N Zealand J Public Health. 1997;21(6)562–566.
- Vanhellemont Q. Adaptation of the dark spectrum fitting atmospheric correction for aquatic applications of the Landsat and Sentinel-2 archives. Remote Sens Environ. 2019;225:175–192.
- Maciel FP, Pedocchi F. Evaluation of ACOLITE atmospheric correction methods for Landsat-8 and Sentinel-2 in the Río de la Plata turbid coastal waters. Int J Remote Sens. 2022;43(1):215–240.
- Dall’Olmo G, Gitelsona AA, Rundquist DC. Towards a unified approach for remote estimation of chlorophyll-a in both terrestrial vegetation and turbid productive waters. Geophys Res Lett. 2003;30(18):1938.
- Gitelson AA, Dall’Olmo G, Moses W, et al. A simple semi-analytical model for remote estimation of chlorophyll-a in turbid waters: validation. Remote Sens Environ. 2008;112(9):3582–3593.
- Gitelson AA, Schalles JF, Hladik CM. Remote chlorophyll a retrieval in turbid, productive estuaries: chesapeake Bay case study. Remote Sens Environ. 2007;109(4):464–472.
- Moses W, Gitelson A, Berdnikov S, et al. Satellite estimation of chlorophyll-a concentration using the red and NIR bands of MERIS - the Azov Sea case study. IEEE Geosci Remote Sens Lett. 2009;4(6):845–849.
- Gower JFR, Doerffer R, Borstad GA. Interpretation of the 685 nm peak in water-leaving radiance spectra in terms of fluorescence, absorption and scattering, and its observation by MERIS. Int J Remote Sens. 1999;20(9):1771–1786.
- Matthews MW, Bernard S, Robertson L. An algorithm for detecting trophic status (chlorophyll-a), cyanobacterial-dominance, surface scums and floating vegetation in inland and coastal waters. Remote Sens Environ. 2012;124:637–652.
- Lunetta RS, Schaeffer BA, Stumpf RP, et al. Evaluation of cyanobacteria cell count detection derived from MERIS imagery across the eastern USA. Remote Sens Environ. 2015;157:24–34.
- Wynne TT, Stumpf RP, Tomlinson MC, et al. Relating spectral shape to cyanobacterial blooms in the Laurentian Great Lakes. Int J Remote Sens. 2008;29(12):3665–3672.
- Mishra S, Mishra DR. Normalized difference chlorophyll index: a novel model for remote estimation of chlorophyll-a concentration in turbid productive waters. Remote Sens Environ. 2012;117:394–406.
- Junes R (2019). Personal communication.
- Jackson M, Sienra G, Santoro P, et al. Temporal and spatial variability scales of salinity at a large microtidal estuary. J Mar Sci Eng. 2021;9(8):860.
- Somma A, Bonilla S, Aubriot L. Nuisance phytoplankton transport is enhanced by high flow in the main river for drinking water in Uruguay. Environ Sci Pollut Res. 2022;29(4):5634–5647.
- Silva CP, Marti CL, Imberger J. Physical and biological controls of algal blooms in the Río de la Plata. Environ Fluid Mech. 2014;14(5):1199–1228.
- Nagy GJ, Muñoz N, Verocai JE, et al. Integrating Climate Science, Monitoring, and Management in the Rio de la Plata Estuarine Front (Uruguay). In: Leal Filho W, Alves F, Caeiro S, et al., editors. International Perspectives on Climate Change Climate Change Management. Switzerland: Springer; 2014. p. 79–92.
- Zabaleta B, Haakonsson S, Achkar M, et al. High-frequency zones of phytoplankton blooms in the Río de la Plata Estuary associated with El Niño-Southern Oscillation. Estuar Coast Shelf Sci. 2023;286:108342. doi: 10.1016/j.ecss.2023.108342
- Mishra D, Ramaswamy L, Kumar A, et al. A multi-cloud cyber infrastructure for monitoring global proliferation of cyanobacterial harmful algal blooms. 2018 IEEE International Geoscience and Remote Sensing Symposium IGARSS; July 22–27, 2018; Valencia, Spain. 2018. p. 9272–9275.
- Mishra S, Stumpf RP, Schaeffer BA, et al. Measurement of cyanobacterial bloom magnitude using satellite remote sensing. Sci Rep. 2019;9(1):1–17.
- Dogliotti AI, Piegari E, Rubinstein L, et al. Observaciones in situ automáticas para el monitoreo y validación de información satelital en el Río de la Plata: primeros datos y resultados. 19° Simposio Científico, Comisión Técnica Mixta del Frente Marítimo, noviembre 2022. Colonia del Sacramento: Uruguay; 2022.
- Teta R, Romano V, Della Sala G, et al. Cyanobacteria as indicators of water quality in Campania coasts, Italy: a monitoring strategy combining remote/proximal sensing and in situ data. Environ Res Lett. 2017;12(2):024001.